| Param | Original file | Final file |
|---|---|---|
| Filename | modeM0/AS1G05_189T01_9000000492_03843cztM0_level2.evt | modeM0/AS1G05_189T01_9000000492_03843cztM0_level2_quad_clean.evt |
| Size (bytes) | 321,353,280 | 39,666,240 |
| Size | 306.5 MB | 37.8 MB |
| Events in quadrant A | 1,700,268 | 256,204 |
| Events in quadrant B | 1,463,175 | 256,662 |
| Events in quadrant C | 4,867,370 | 217,976 |
| Events in quadrant D | 1,485,852 | 245,047 |
| Mode M0 | |||
|---|---|---|---|
| Quadrant | BADHDUFLAG | Total packets | Discarded packets |
| A | 0 | 7389 | 1 |
| B | 0 | 6479 | 0 |
| C | 0 | 16689 | 0 |
| D | 0 | 6781 | 0 |
| Mode SS | |||
|---|---|---|---|
| Quadrant | BADHDUFLAG | Total packets | Discarded packets |
| A | 0 | 64 | 0 |
| B | 0 | 64 | 0 |
| C | 0 | 64 | 0 |
| D | 0 | 64 | 0 |
| Quadrant | Total seconds | Saturated seconds | Saturation percentage |
|---|---|---|---|
| A | 3157 | 24 | 0.760215% |
| B | 3157 | 2 | 0.063351% |
| C | 3157 | 702 | 22.236300% |
| D | 3157 | 15 | 0.475135% |
Noise dominated data is calculated using 1-second bins in cleaned event files. If a bin has >2000 counts, and if more than 50% of those come from <1% of pixels, then it is considered to be noise-dominated and hence unusable.
| Quadrant | # 1 sec bins | Bins with >0 counts | Bins with >2000 counts | High rate bins dominated by noise | Noise dominated (total time) | Noise dominated (detector-on time) | Marked lightcurve |
|---|---|---|---|---|---|---|---|
| A | 3157 | 3157 | 11 | 11 | 0.35% | 0.35% | 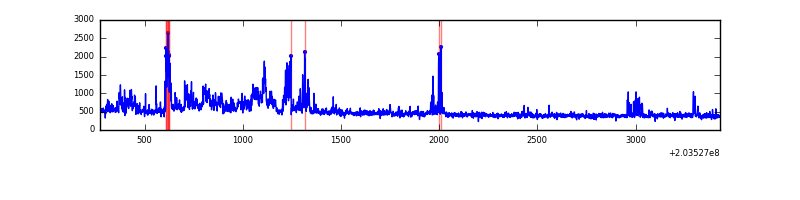 |
| B | 3157 | 3157 | 0 | 0 | 0.00% | 0.00% | 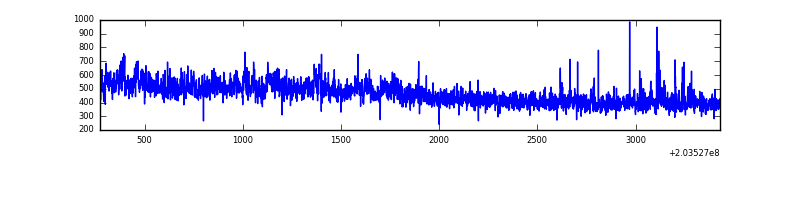 |
| C | 3157 | 3157 | 513 | 513 | 16.25% | 16.25% | 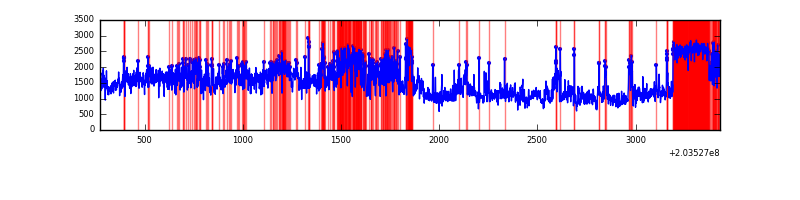 |
| D | 3157 | 3157 | 16 | 16 | 0.51% | 0.51% | 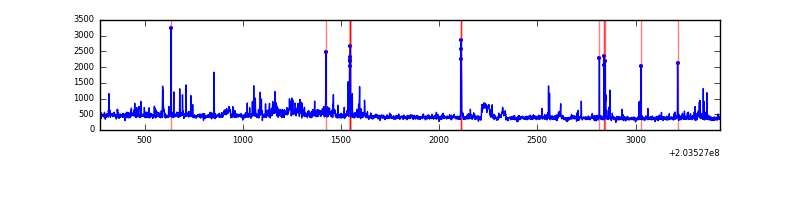 |
Top three noisy pixels from each quadrant. If the there are fewer than three noisy pixels in the level2.evt file, extra rows are filled as -1
| Pixel properties | Quadrant properties | ||||||
|---|---|---|---|---|---|---|---|
| Quadrant | DetID | PixID | Counts | Sigma | Mean | Median | Sigma |
| A | 15 | 234 | 316973 | 4374.06 | 347 | 340 | 72.4 |
| A | 0 | 50 | 13634 | 183.65 | 347 | 340 | 72.4 |
| A | 8 | 15 | 13356 | 179.81 | 347 | 340 | 72.4 |
| B | 15 | 204 | 67287 | 955.77 | 352 | 344 | 70.0 |
| B | 14 | 167 | 16112 | 225.13 | 352 | 344 | 70.0 |
| B | 4 | 81 | 10361 | 143.02 | 352 | 344 | 70.0 |
| C | 2 | 53 | 3577731 | 47344.65 | 317 | 318 | 75.6 |
| C | 1 | 241 | 38772 | 508.91 | 317 | 318 | 75.6 |
| C | 14 | 67 | 5141 | 63.83 | 317 | 318 | 75.6 |
| D | 8 | 112 | 45111 | 502.83 | 338 | 329 | 89.1 |
| D | 13 | 248 | 38203 | 425.26 | 338 | 329 | 89.1 |
| D | 2 | 14 | 32732 | 363.83 | 338 | 329 | 89.1 |
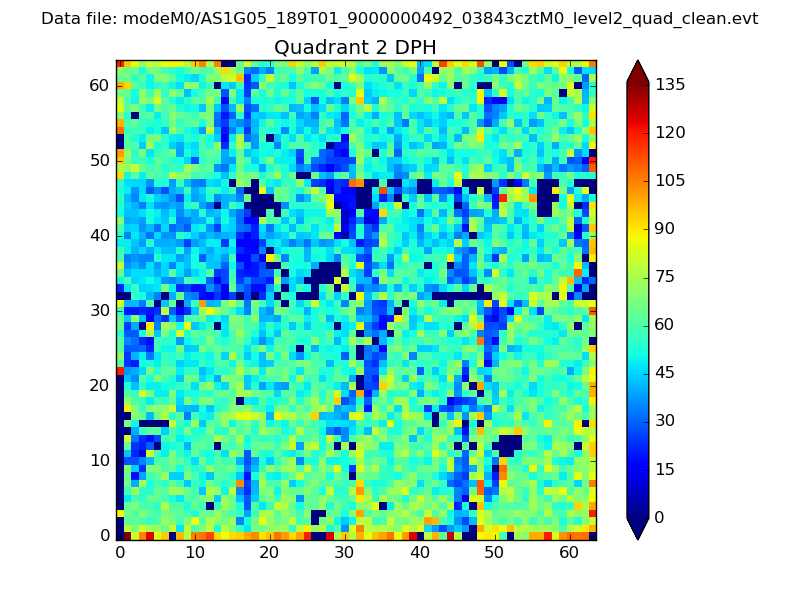
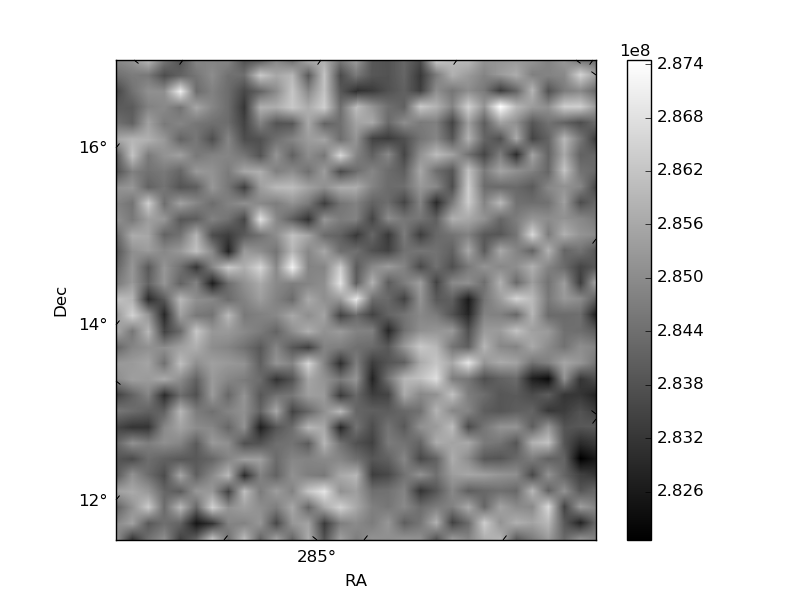
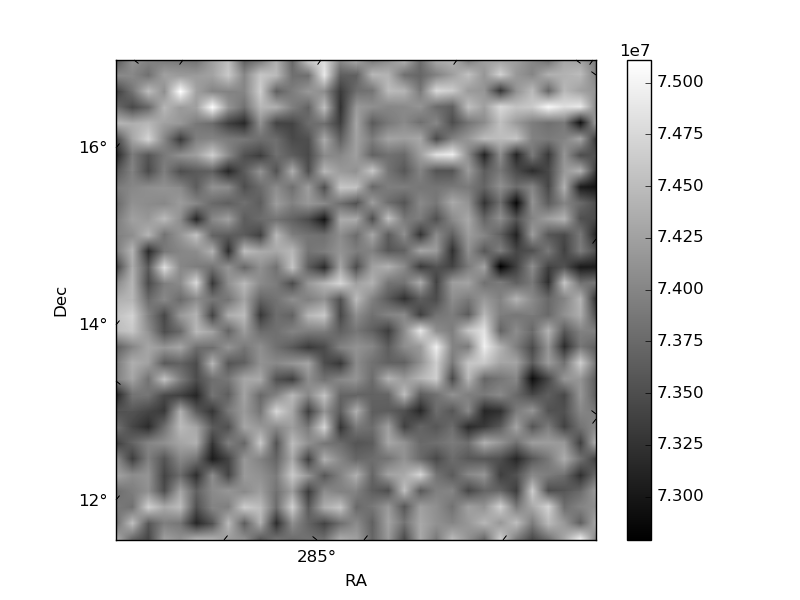
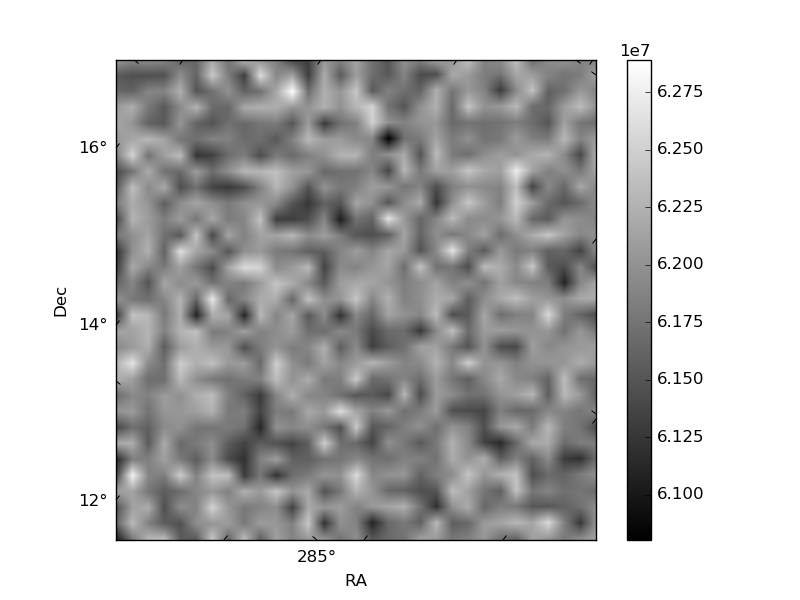
Histogram calculated using DETX and DETY for each event in the final _common_clean file
| Quadrant A | 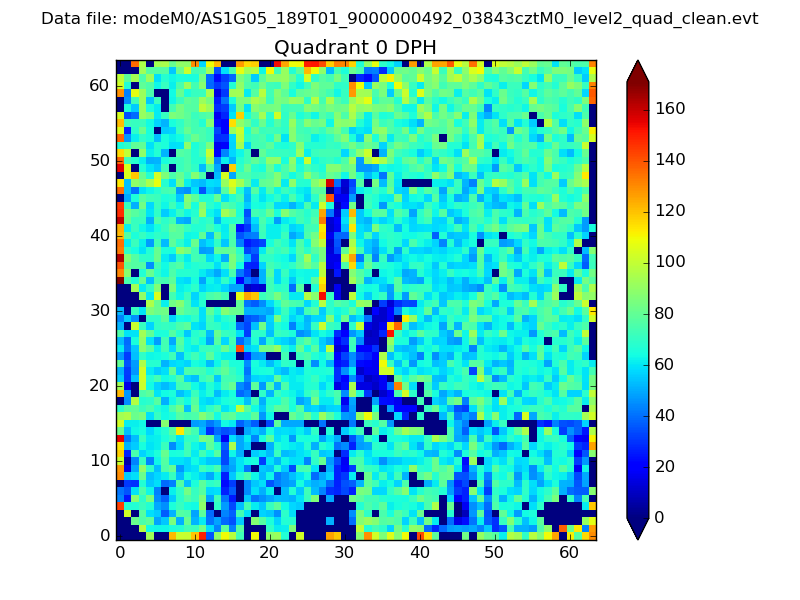 |
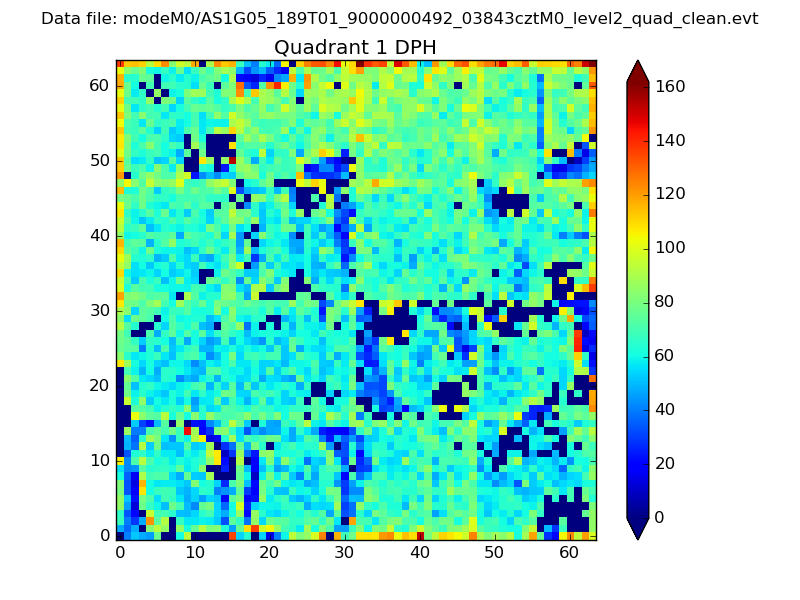 |
Quadrant B |
|---|---|---|---|
| Quadrant D | 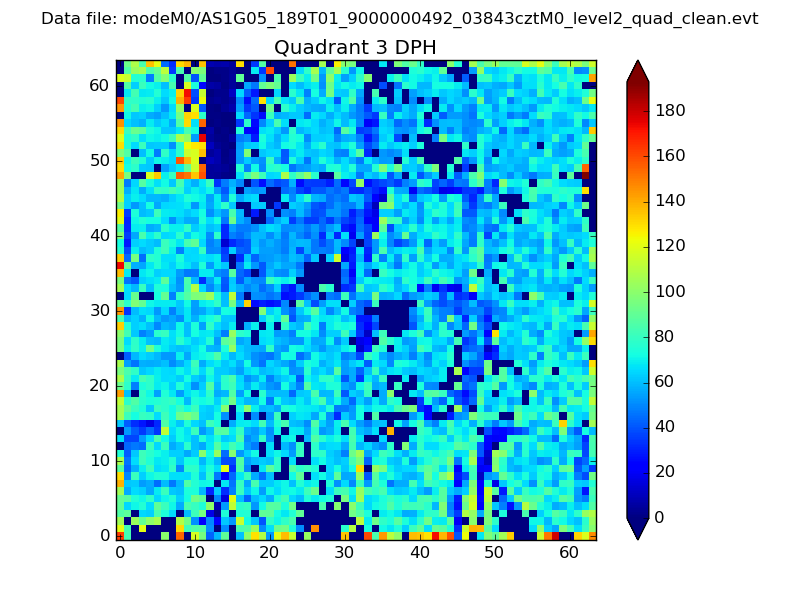 |
 |
Quadrant C |
| Plot type | Count rate plots | Images |
|---|---|---|
| Comparison with Poisson distribution Blue bars denote a histogram of data divided into 1 sec bins. Red curve is a Poisson curve with rate = median count rate of data. |
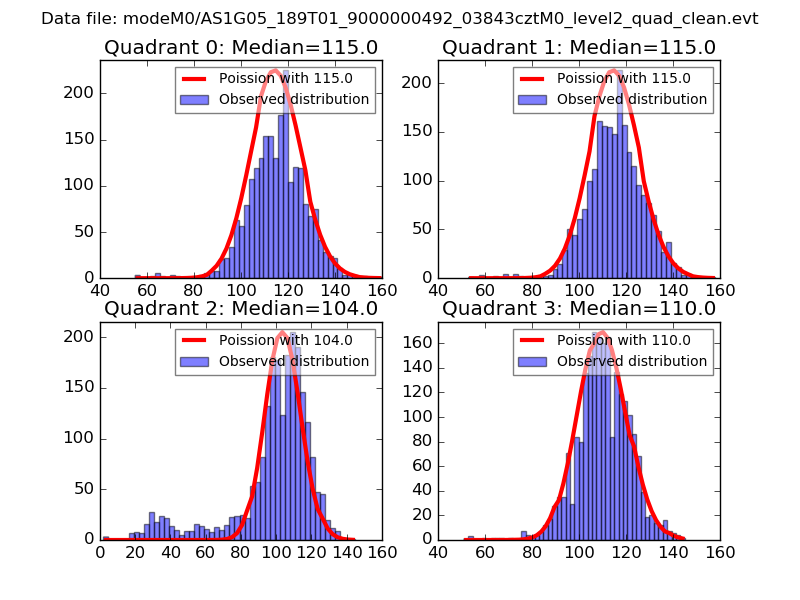 |
 |
| Quadrant-wise count rates Data is divided into 100 sec bins |
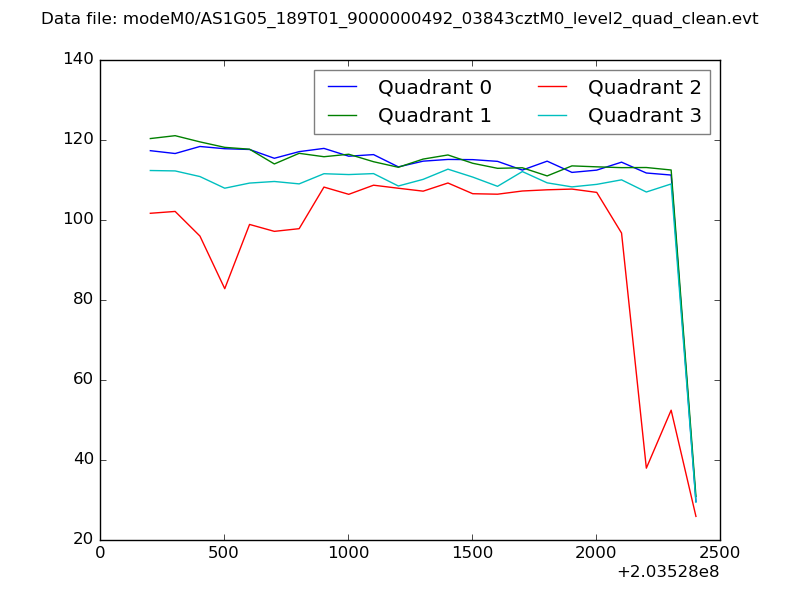 |
|
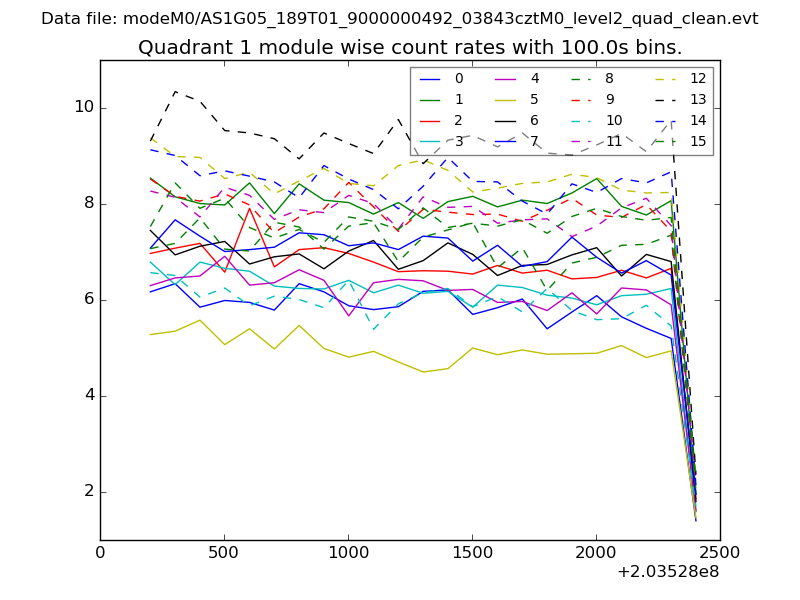
| Module-wise count rates for Quadrant A Data is divided into 100 sec bins |
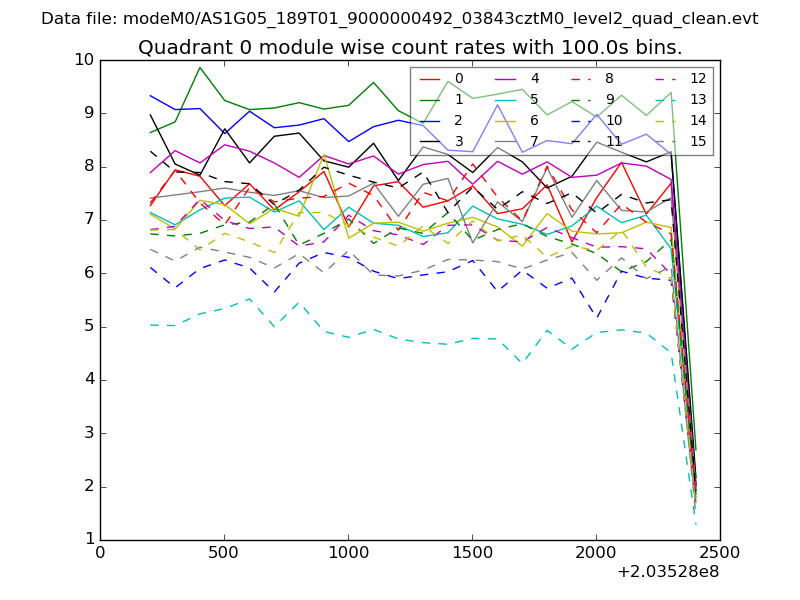 |
 |
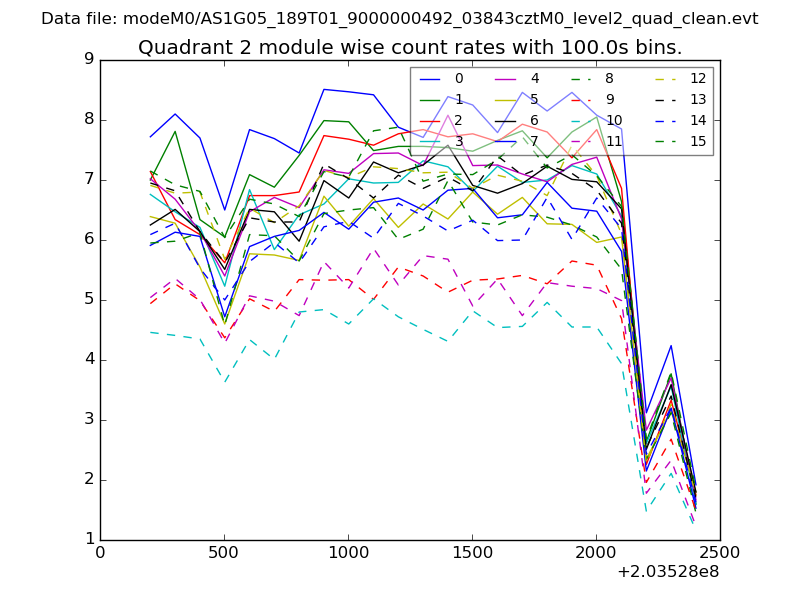
| Module-wise count rates for Quadrant B Data is divided into 100 sec bins |
 |
 |
| Module-wise count rates for Quadrant C Data is divided into 100 sec bins |
 |
 |
| Module-wise count rates for Quadrant D Data is divided into 100 sec bins |
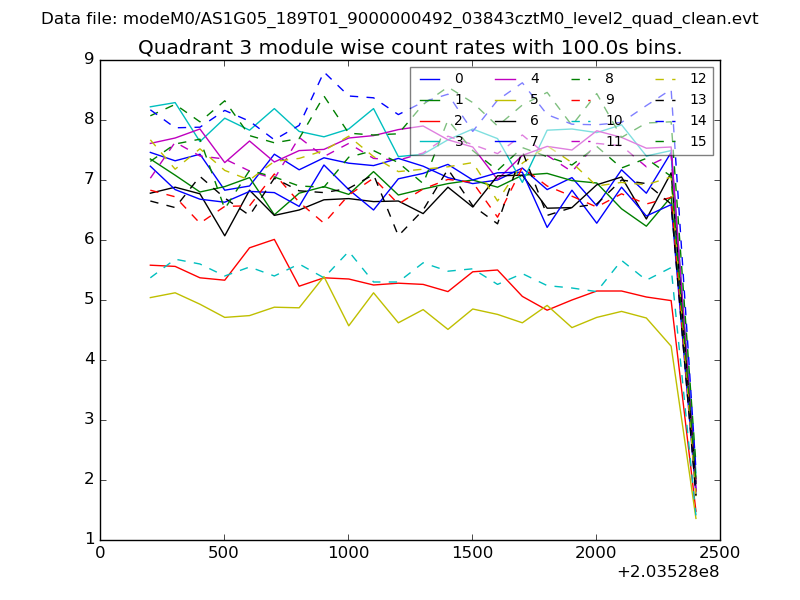 |
 |
| Parameter | Plot |
|---|---|
| CZT HV Monitor | 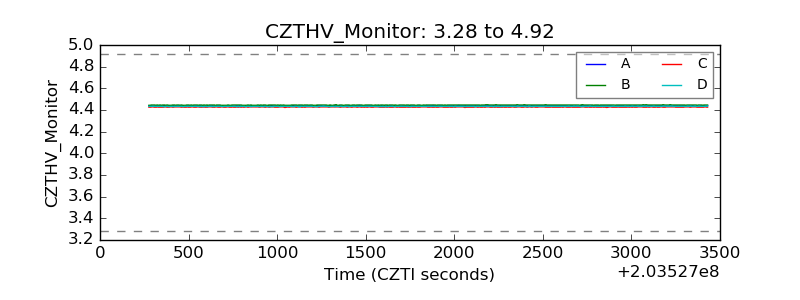 |
| D_VDD | 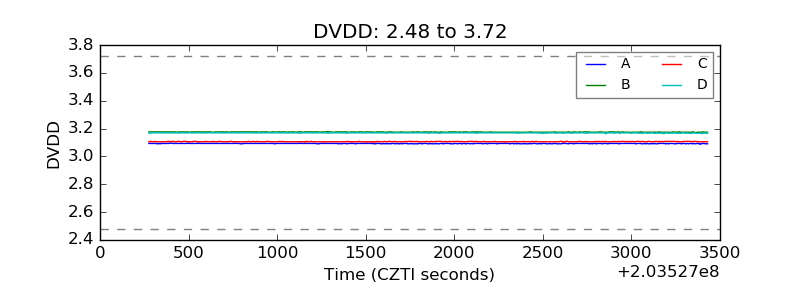 |
| Temperature 1 | 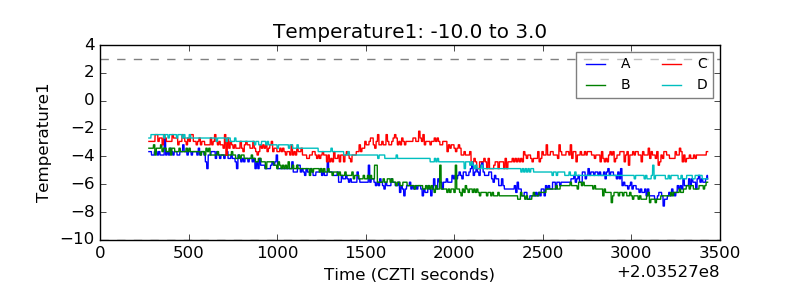 |
| Veto HV Monitor | 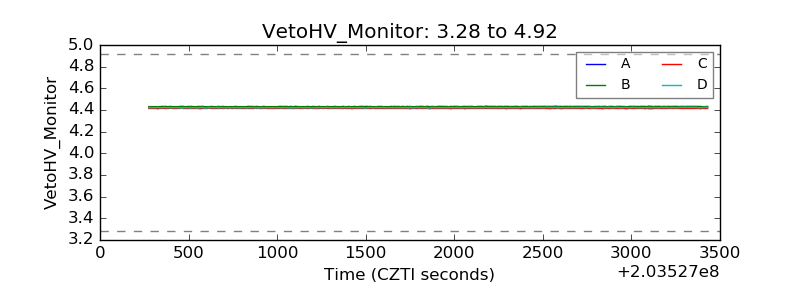 |
| Veto LLD | 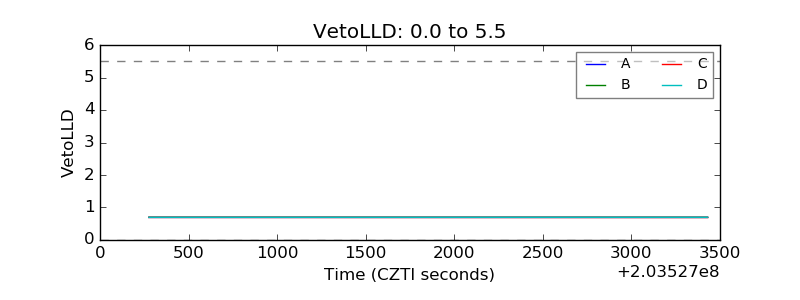 |
| Alpha Counter | 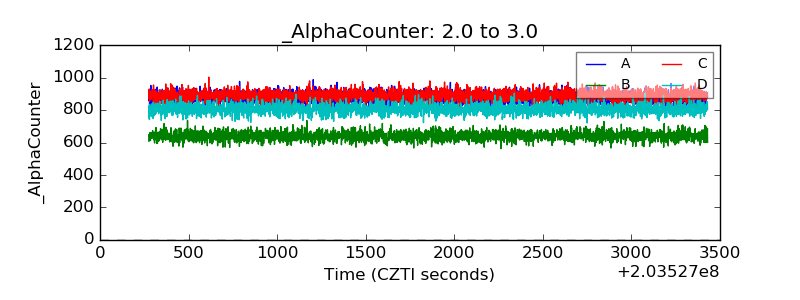 |
| _CPM_Rate | 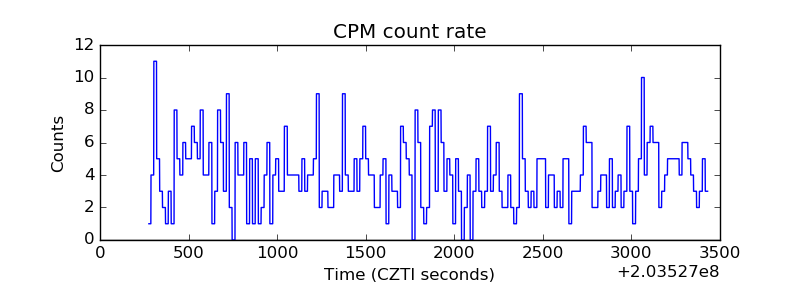 |
| CZT Counter | 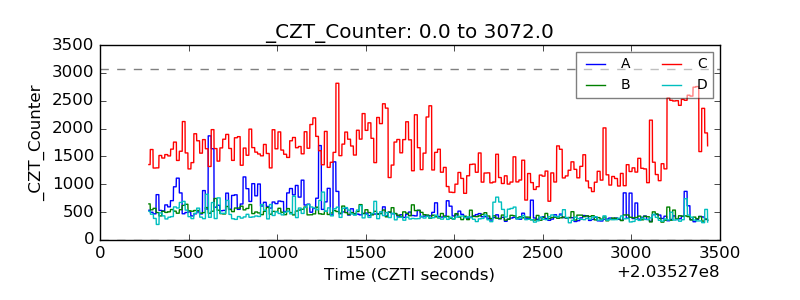 |
| +2.5 Volts monitor |  |
| +5 Volts monitor |  |
| _ROLL_ROT | 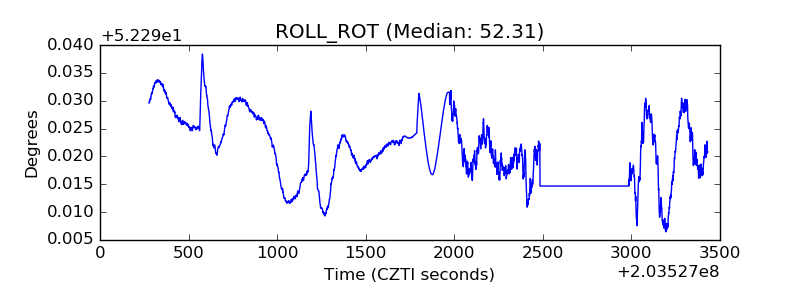 |
| _Roll_DEC | 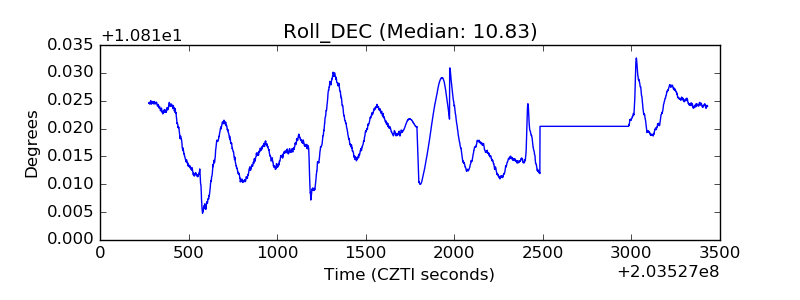 |
| _Roll_RA | 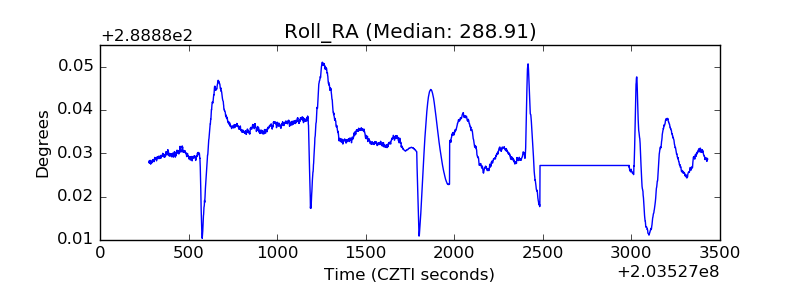 |
| Veto Counter | 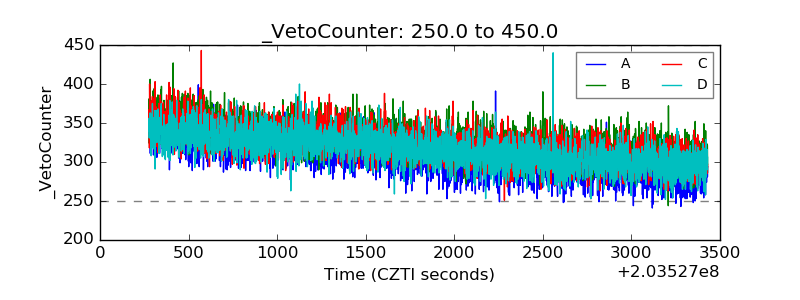 |