| Param | Original file | Final file |
|---|---|---|
| Filename | modeM0/AS1G05_189T01_9000000492_03844cztM0_level2.evt | modeM0/AS1G05_189T01_9000000492_03844cztM0_level2_quad_clean.evt |
| Size (bytes) | 1,304,775,360 | 171,305,280 |
| Size | 1.2 GB | 163.4 MB |
| Events in quadrant A | 9,686,618 | 1,059,177 |
| Events in quadrant B | 7,544,121 | 1,074,973 |
| Events in quadrant C | 14,091,824 | 947,436 |
| Events in quadrant D | 7,144,270 | 1,034,915 |
| Mode M0 | |||
|---|---|---|---|
| Quadrant | BADHDUFLAG | Total packets | Discarded packets |
| A | 0 | 39539 | 4 |
| B | 0 | 32806 | 3 |
| C | 0 | 51730 | 3 |
| D | 0 | 32929 | 3 |
| Mode M9 | |||
|---|---|---|---|
| Quadrant | BADHDUFLAG | Total packets | Discarded packets |
| A | 0 | 21 | 0 |
| B | 0 | 21 | 0 |
| C | 0 | 21 | 0 |
| D | 0 | 21 | 0 |
| Mode SS | |||
|---|---|---|---|
| Quadrant | BADHDUFLAG | Total packets | Discarded packets |
| A | 0 | 316 | 0 |
| B | 0 | 316 | 0 |
| C | 0 | 316 | 0 |
| D | 0 | 316 | 0 |
| Quadrant | Total seconds | Saturated seconds | Saturation percentage |
|---|---|---|---|
| A | 15518 | 766 | 4.936203% |
| B | 15518 | 108 | 0.695966% |
| C | 15518 | 2706 | 17.437814% |
| D | 15518 | 147 | 0.947287% |
Noise dominated data is calculated using 1-second bins in cleaned event files. If a bin has >2000 counts, and if more than 50% of those come from <1% of pixels, then it is considered to be noise-dominated and hence unusable.
| Quadrant | # 1 sec bins | Bins with >0 counts | Bins with >2000 counts | High rate bins dominated by noise | Noise dominated (total time) | Noise dominated (detector-on time) | Marked lightcurve |
|---|---|---|---|---|---|---|---|
| A | 17543 | 15520 | 425 | 425 | 2.42% | 2.74% | 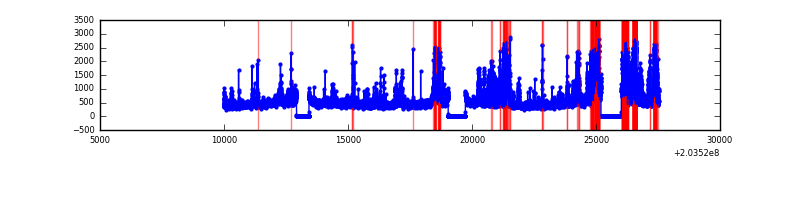 |
| B | 17543 | 15518 | 2 | 2 | 0.01% | 0.01% | 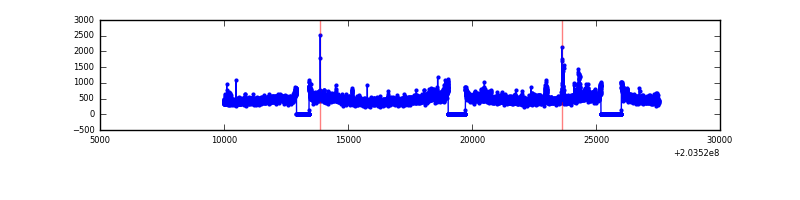 |
| C | 17543 | 15519 | 2618 | 2618 | 14.92% | 16.87% | 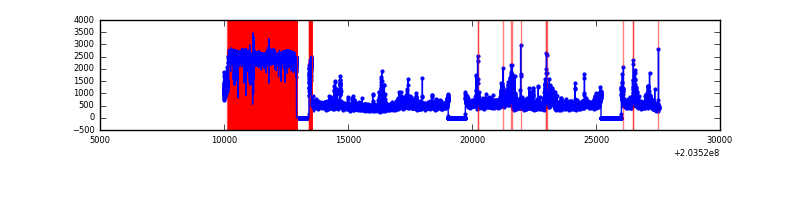 |
| D | 17543 | 15519 | 78 | 78 | 0.44% | 0.50% | 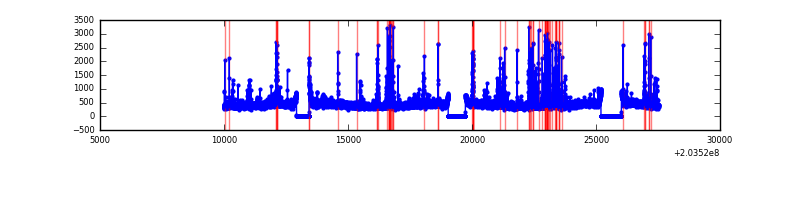 |
Top three noisy pixels from each quadrant. If the there are fewer than three noisy pixels in the level2.evt file, extra rows are filled as -1
| Pixel properties | Quadrant properties | ||||||
|---|---|---|---|---|---|---|---|
| Quadrant | DetID | PixID | Counts | Sigma | Mean | Median | Sigma |
| A | 15 | 234 | 2747300 | 7708.85 | 1748 | 1709 | 356.2 |
| A | 13 | 251 | 78896 | 216.72 | 1748 | 1709 | 356.2 |
| A | 0 | 199 | 58494 | 159.44 | 1748 | 1709 | 356.2 |
| B | 15 | 204 | 444827 | 1279.66 | 1797 | 1755 | 346.2 |
| B | 14 | 167 | 42448 | 117.53 | 1797 | 1755 | 346.2 |
| B | 12 | 111 | 30931 | 84.26 | 1797 | 1755 | 346.2 |
| C | 2 | 53 | 7964112 | 22464.84 | 1522 | 1534 | 354.4 |
| C | 1 | 241 | 63968 | 176.15 | 1522 | 1534 | 354.4 |
| C | 9 | 247 | 63834 | 175.77 | 1522 | 1534 | 354.4 |
| D | 13 | 248 | 367438 | 883.23 | 1715 | 1659 | 414.1 |
| D | 13 | 223 | 109976 | 261.55 | 1715 | 1659 | 414.1 |
| D | 2 | 14 | 51698 | 120.83 | 1715 | 1659 | 414.1 |
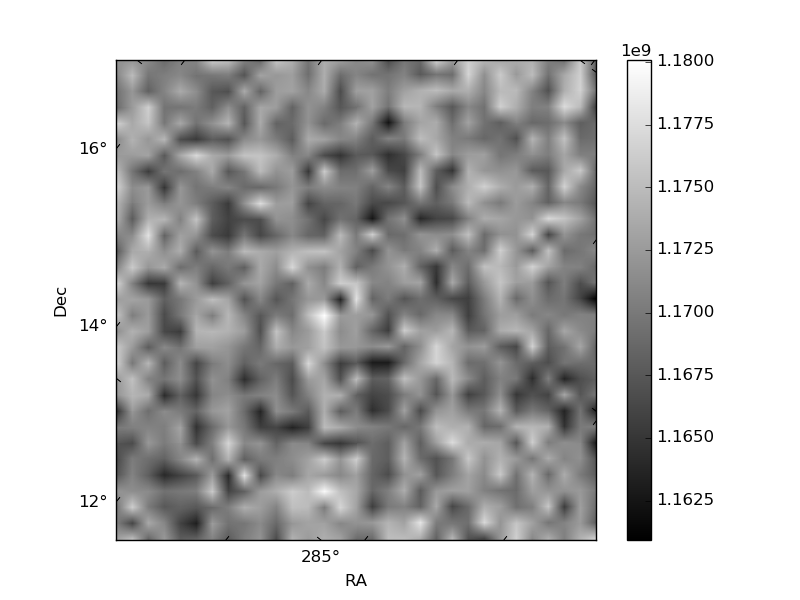
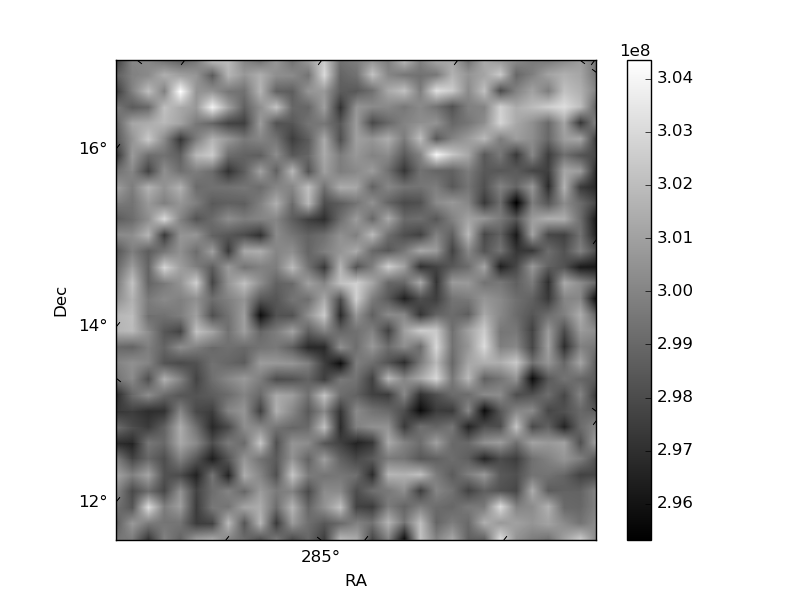
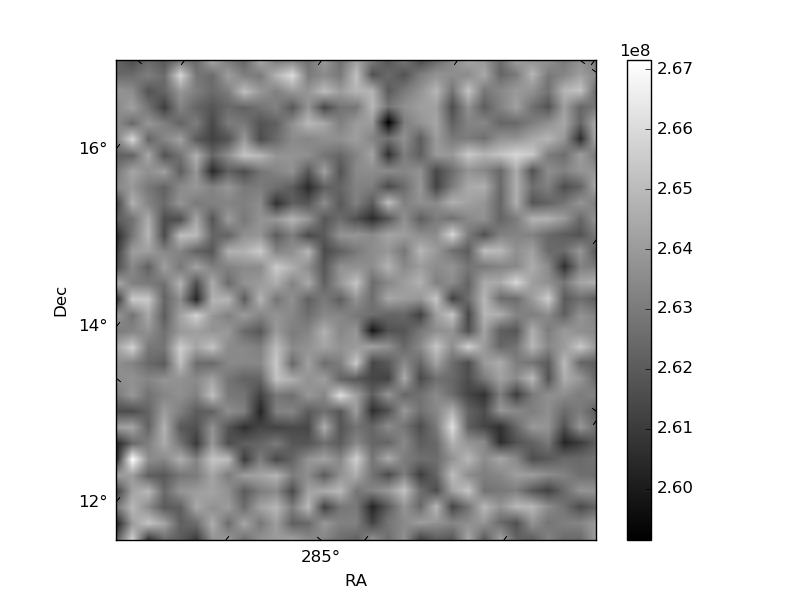
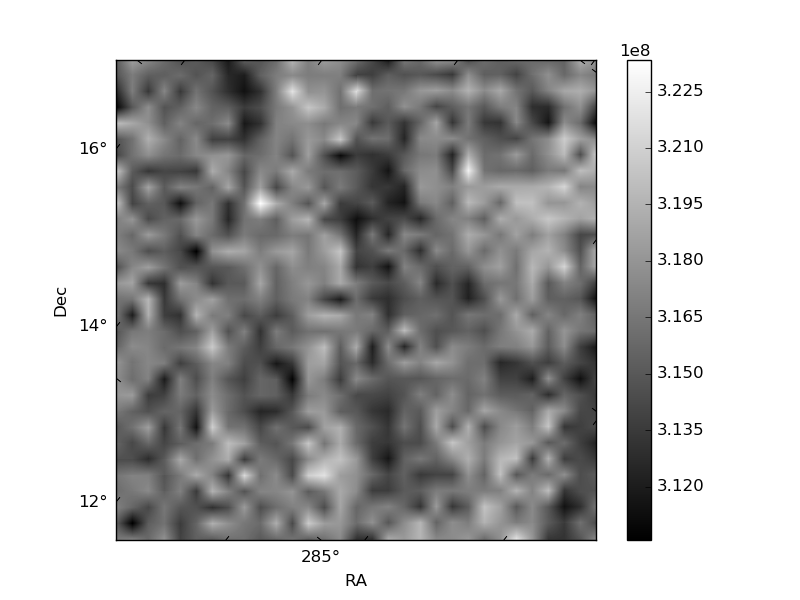
Histogram calculated using DETX and DETY for each event in the final _common_clean file
| Quadrant A | 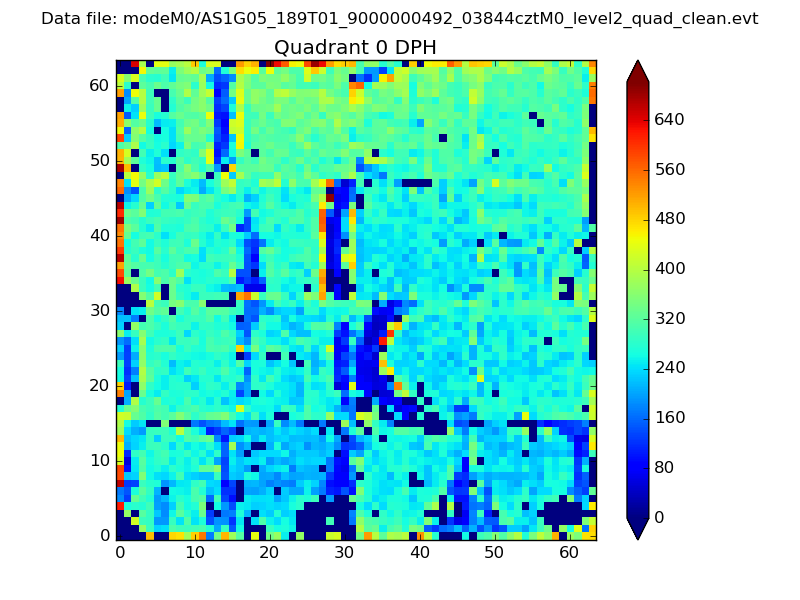 |
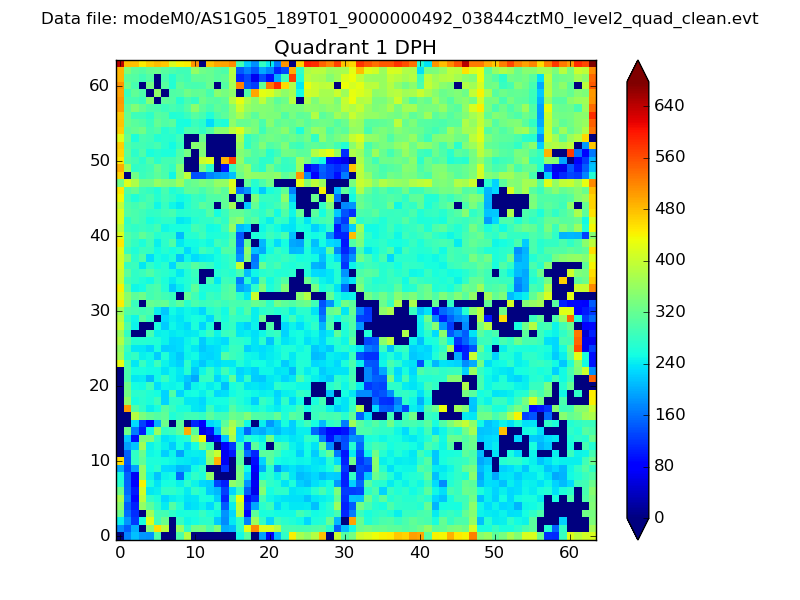 |
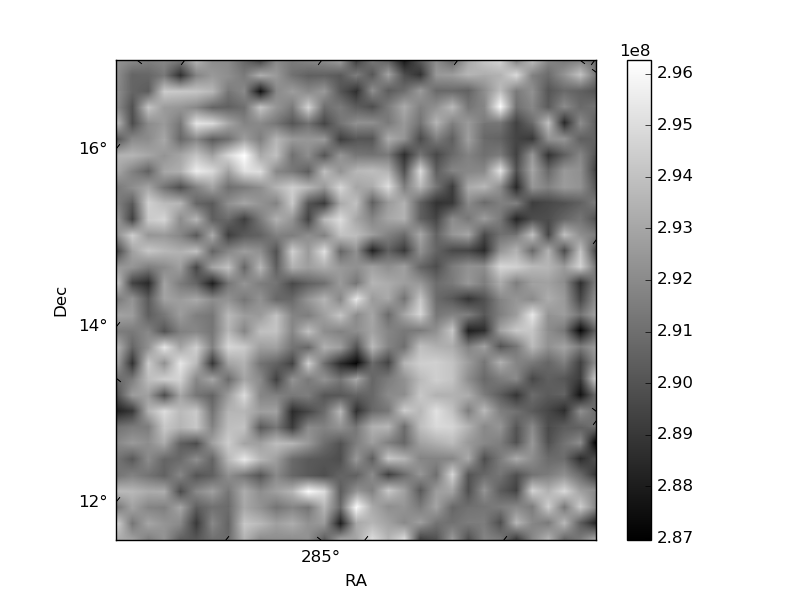
Quadrant B |
|---|---|---|---|
| Quadrant D | 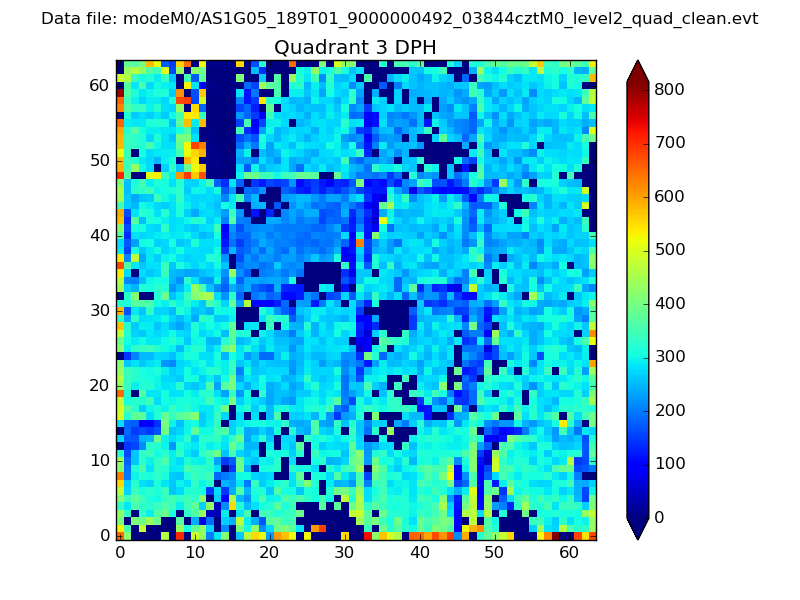 |
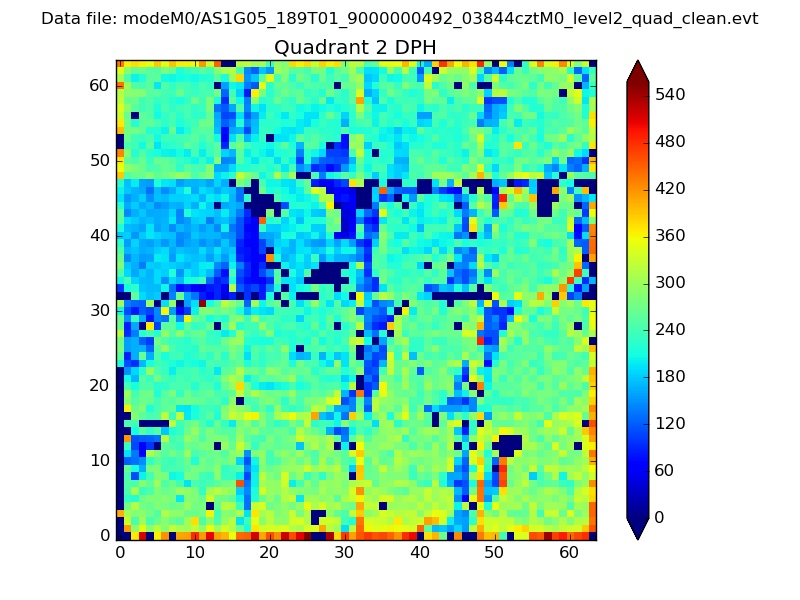 |
Quadrant C |
| Plot type | Count rate plots | Images |
|---|---|---|
| Comparison with Poisson distribution Blue bars denote a histogram of data divided into 1 sec bins. Red curve is a Poisson curve with rate = median count rate of data. |
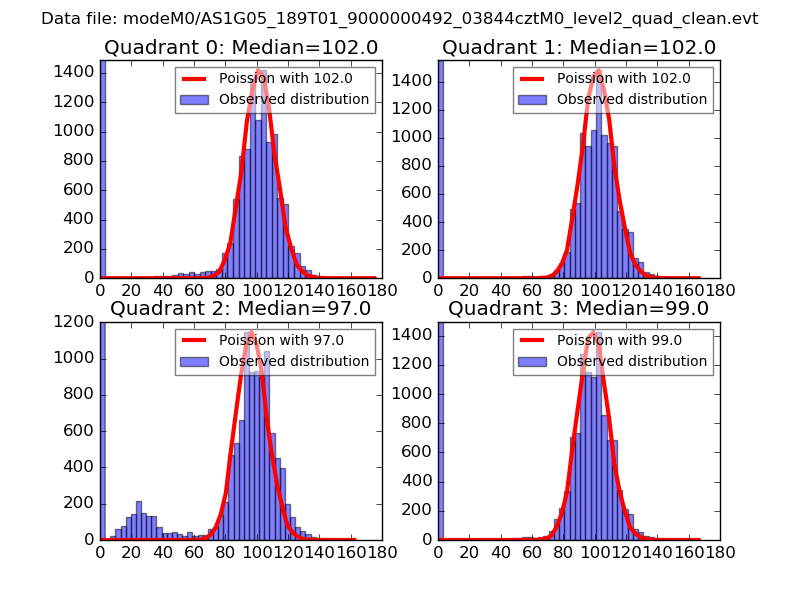 |
 |
| Quadrant-wise count rates Data is divided into 100 sec bins |
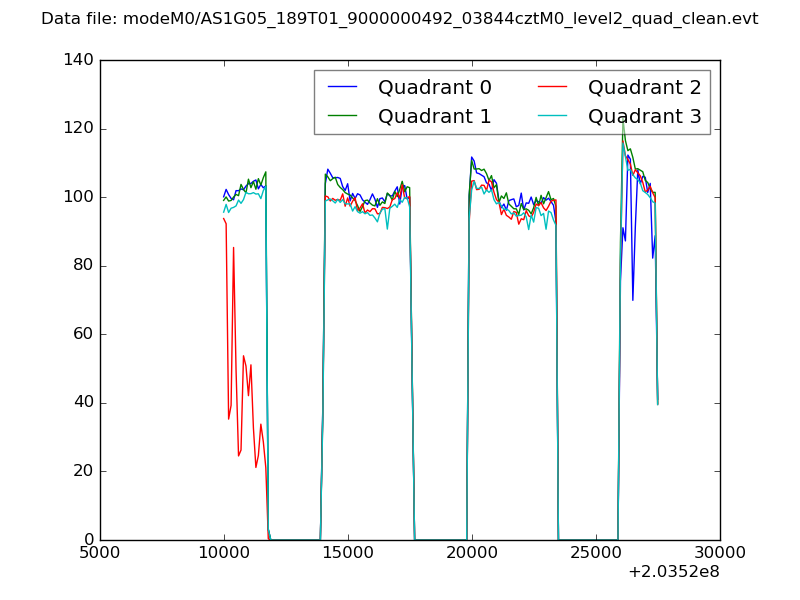 |
|
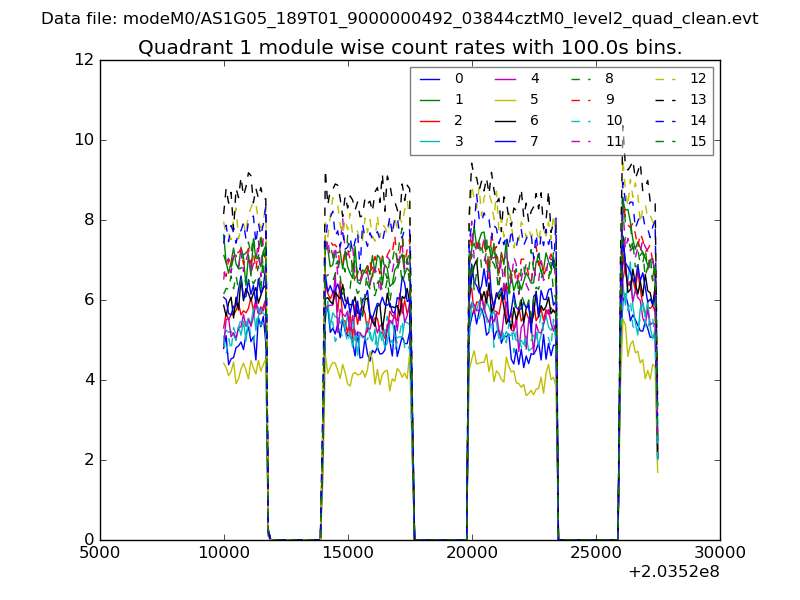
| Module-wise count rates for Quadrant A Data is divided into 100 sec bins |
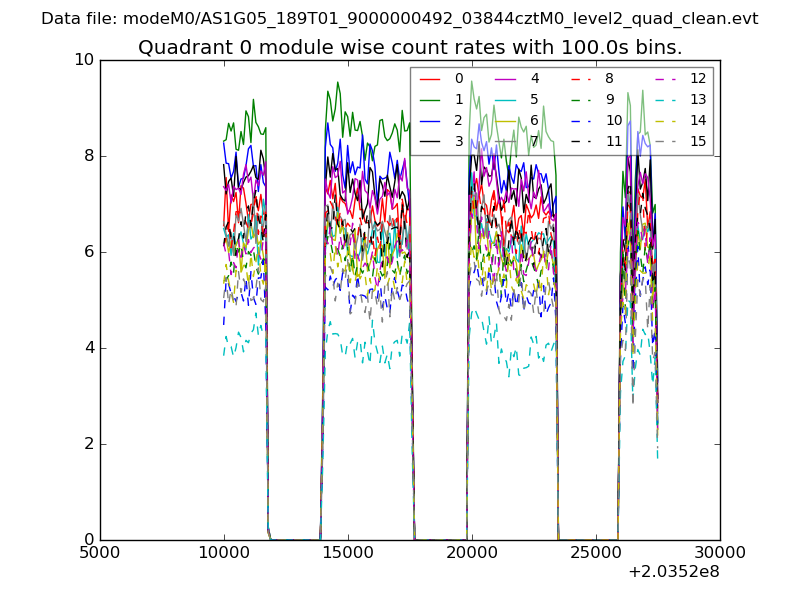 |
 |
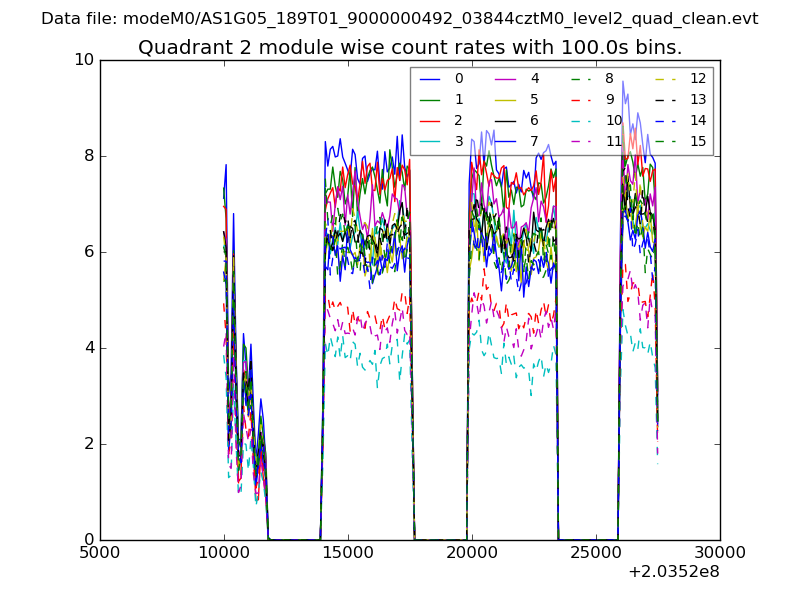
| Module-wise count rates for Quadrant B Data is divided into 100 sec bins |
 |
 |
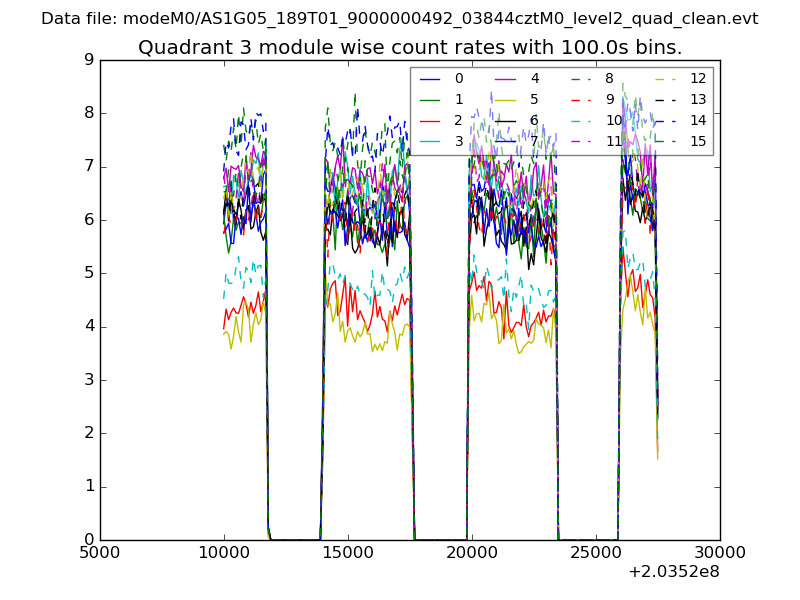
| Module-wise count rates for Quadrant C Data is divided into 100 sec bins |
 |
 |
| Module-wise count rates for Quadrant D Data is divided into 100 sec bins |
 |
 |
| Parameter | Plot |
|---|---|
| CZT HV Monitor | 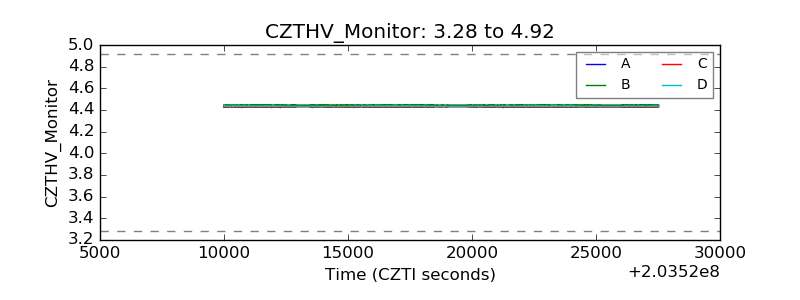 |
| D_VDD | 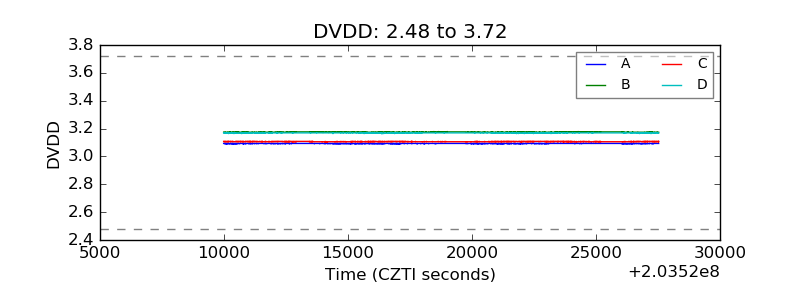 |
| Temperature 1 | 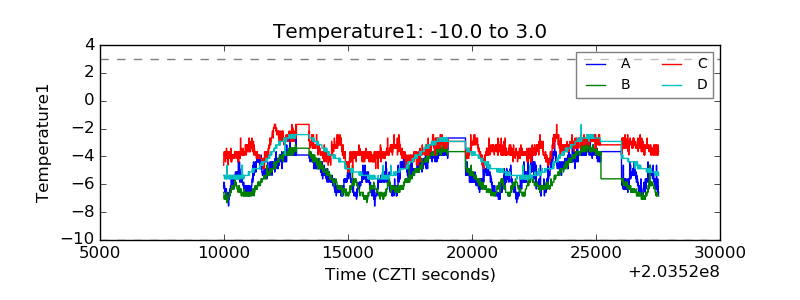 |
| Veto HV Monitor | 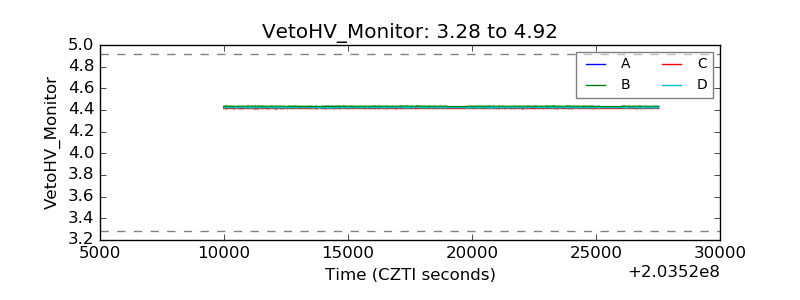 |
| Veto LLD | 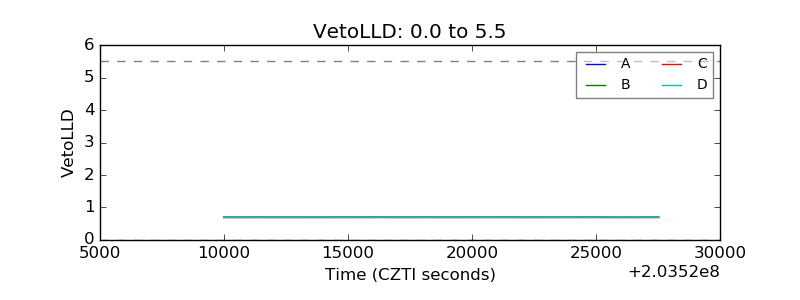 |
| Alpha Counter | 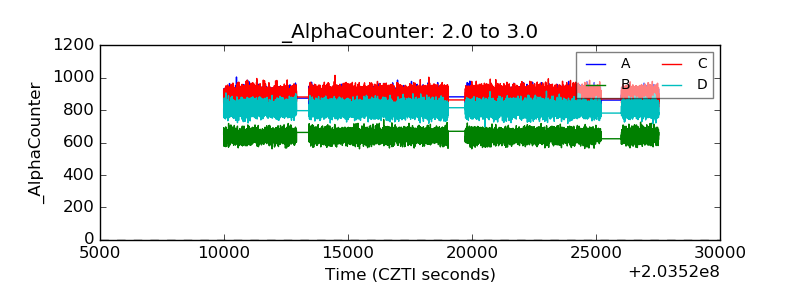 |
| _CPM_Rate | 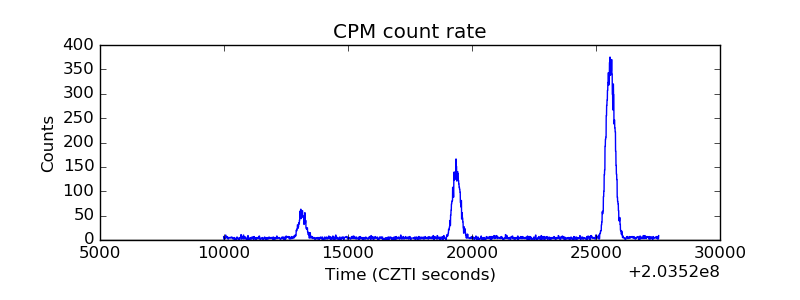 |
| CZT Counter | 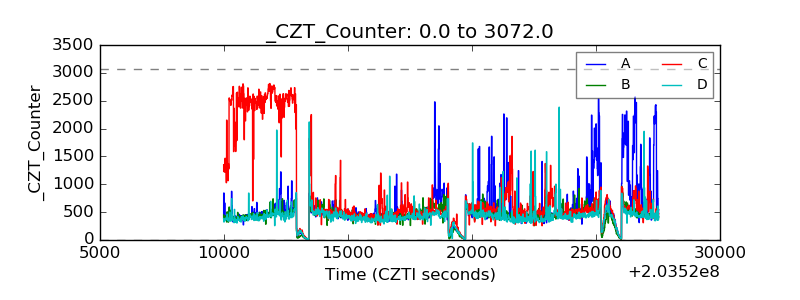 |
| +2.5 Volts monitor |  |
| +5 Volts monitor |  |
| Veto Counter | 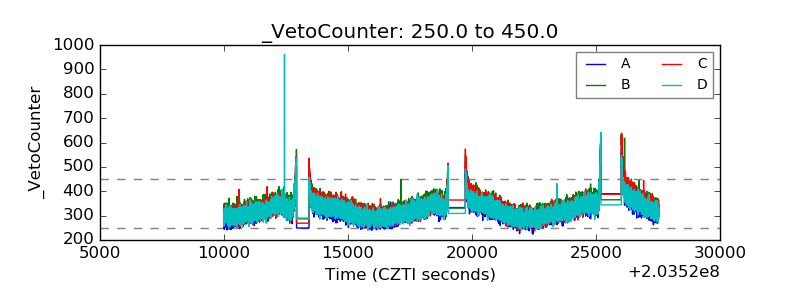 |