| Param | Original file | Final file |
|---|---|---|
| Filename | modeM0/AS1G05_189T01_9000000492_03845cztM0_level2.evt | modeM0/AS1G05_189T01_9000000492_03845cztM0_level2_quad_clean.evt |
| Size (bytes) | 441,218,880 | 66,205,440 |
| Size | 420.8 MB | 63.1 MB |
| Events in quadrant A | 3,658,049 | 396,614 |
| Events in quadrant B | 2,905,763 | 407,626 |
| Events in quadrant C | 3,795,807 | 396,987 |
| Events in quadrant D | 2,604,294 | 393,379 |
| Mode M0 | |||
|---|---|---|---|
| Quadrant | BADHDUFLAG | Total packets | Discarded packets |
| A | 0 | 14909 | 2 |
| B | 0 | 12817 | 1 |
| C | 0 | 15464 | 1 |
| D | 0 | 12244 | 1 |
| Mode M9 | |||
|---|---|---|---|
| Quadrant | BADHDUFLAG | Total packets | Discarded packets |
| A | 0 | 10 | 0 |
| B | 0 | 10 | 0 |
| C | 0 | 10 | 0 |
| D | 0 | 10 | 0 |
| Mode SS | |||
|---|---|---|---|
| Quadrant | BADHDUFLAG | Total packets | Discarded packets |
| A | 0 | 120 | 0 |
| B | 0 | 120 | 0 |
| C | 0 | 120 | 0 |
| D | 0 | 120 | 0 |
| Quadrant | Total seconds | Saturated seconds | Saturation percentage |
|---|---|---|---|
| A | 5863 | 238 | 4.059355% |
| B | 5863 | 36 | 0.614020% |
| C | 5863 | 26 | 0.443459% |
| D | 5863 | 23 | 0.392291% |
Noise dominated data is calculated using 1-second bins in cleaned event files. If a bin has >2000 counts, and if more than 50% of those come from <1% of pixels, then it is considered to be noise-dominated and hence unusable.
| Quadrant | # 1 sec bins | Bins with >0 counts | Bins with >2000 counts | High rate bins dominated by noise | Noise dominated (total time) | Noise dominated (detector-on time) | Marked lightcurve |
|---|---|---|---|---|---|---|---|
| A | 6868 | 5863 | 252 | 252 | 3.67% | 4.30% | 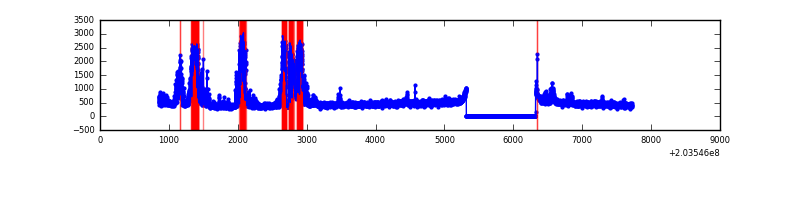 |
| B | 6868 | 5863 | 1 | 1 | 0.01% | 0.02% | 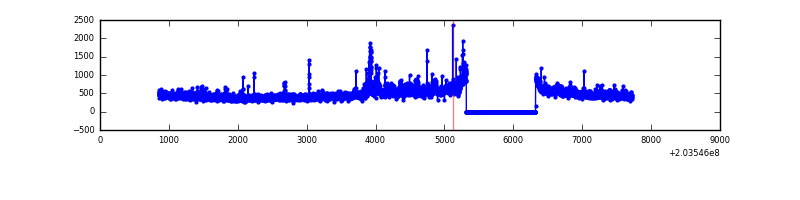 |
| C | 6868 | 5864 | 5 | 5 | 0.07% | 0.09% | 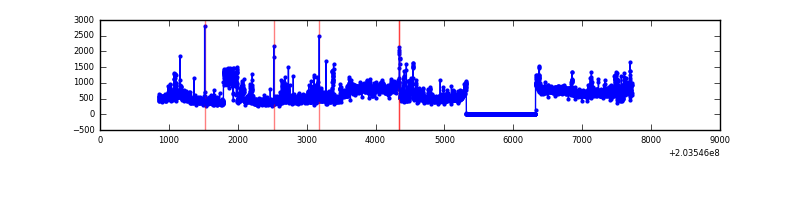 |
| D | 6868 | 5863 | 15 | 15 | 0.22% | 0.26% | 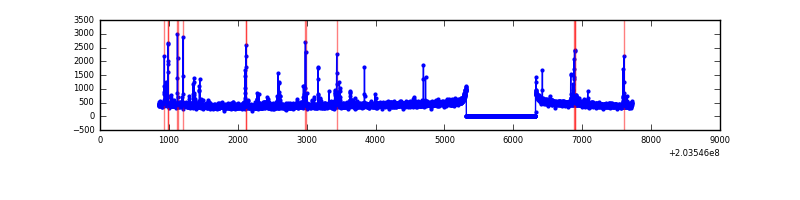 |
Top three noisy pixels from each quadrant. If the there are fewer than three noisy pixels in the level2.evt file, extra rows are filled as -1
| Pixel properties | Quadrant properties | ||||||
|---|---|---|---|---|---|---|---|
| Quadrant | DetID | PixID | Counts | Sigma | Mean | Median | Sigma |
| A | 15 | 234 | 1103273 | 8143.82 | 657 | 641 | 135.4 |
| A | 0 | 199 | 11409 | 79.53 | 657 | 641 | 135.4 |
| A | 0 | 226 | 7522 | 50.82 | 657 | 641 | 135.4 |
| B | 15 | 204 | 212012 | 1608.75 | 672 | 655 | 131.4 |
| B | 4 | 81 | 57848 | 435.33 | 672 | 655 | 131.4 |
| B | 0 | 244 | 21330 | 157.37 | 672 | 655 | 131.4 |
| C | 2 | 53 | 1255803 | 8264.5 | 644 | 647 | 151.9 |
| C | 10 | 65 | 8336 | 50.63 | 644 | 647 | 151.9 |
| C | 13 | 61 | 5453 | 31.64 | 644 | 647 | 151.9 |
| D | 13 | 248 | 77522 | 477.77 | 639 | 620 | 161.0 |
| D | 13 | 223 | 50598 | 310.5 | 639 | 620 | 161.0 |
| D | 2 | 14 | 32287 | 196.74 | 639 | 620 | 161.0 |
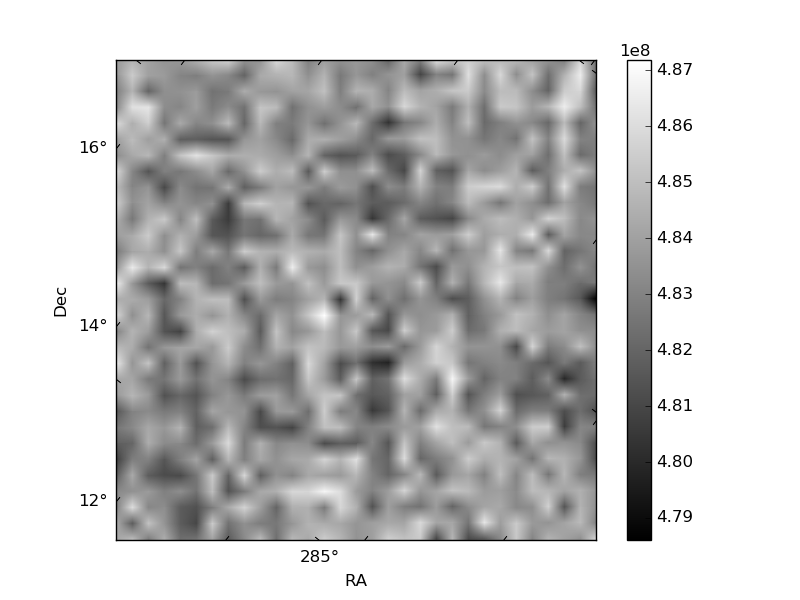
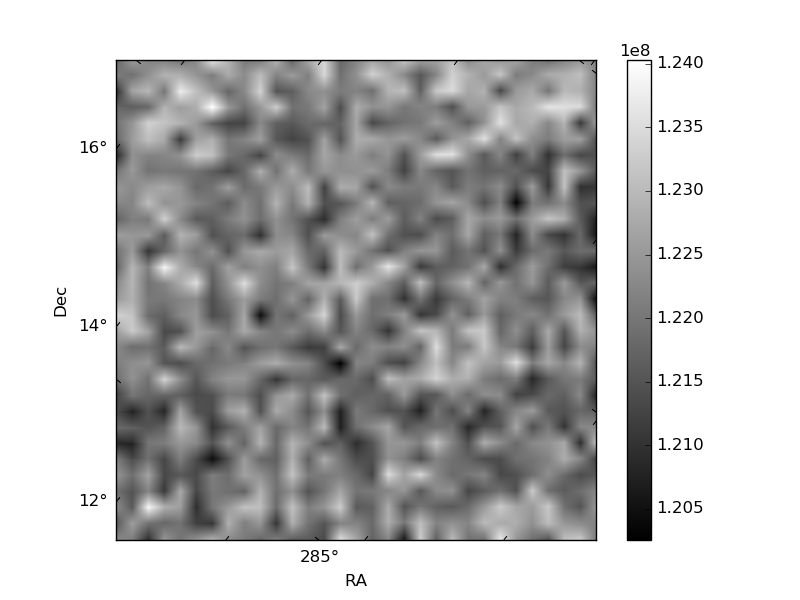
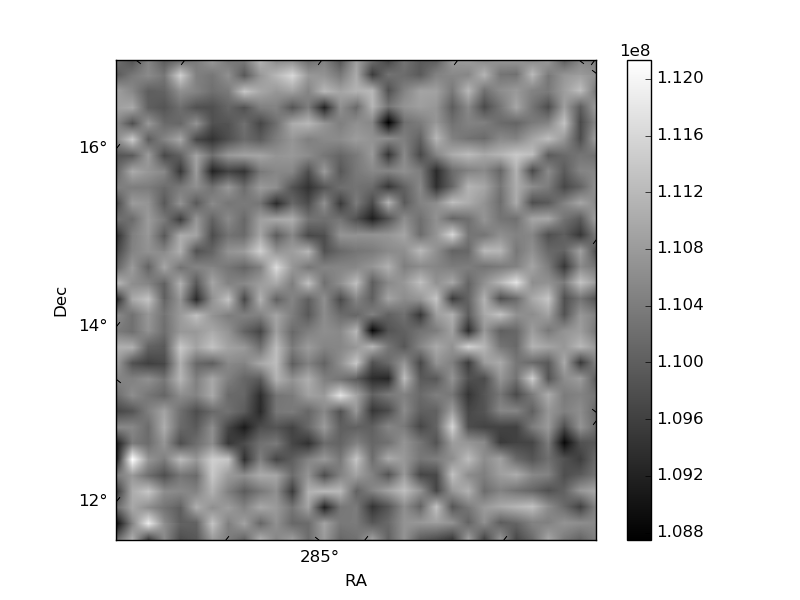
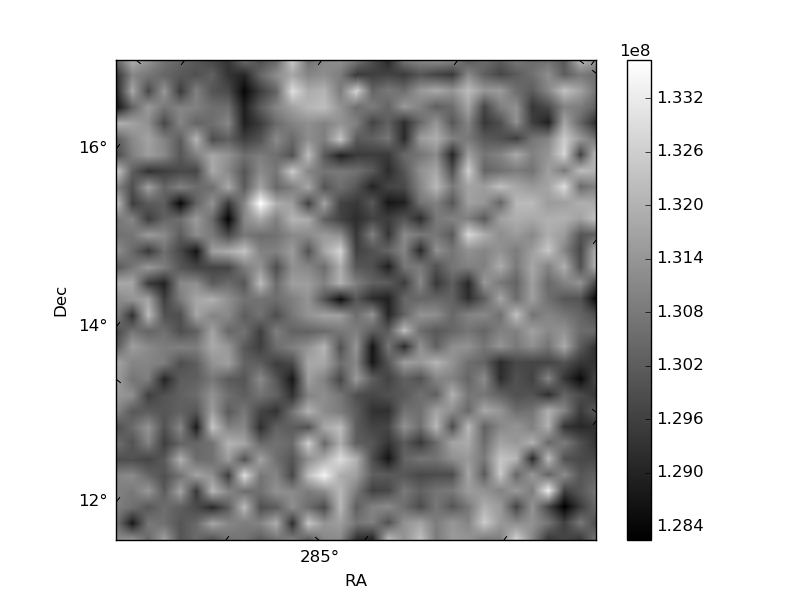
Histogram calculated using DETX and DETY for each event in the final _common_clean file
| Quadrant A |  |
 |
Quadrant B |
|---|---|---|---|
| Quadrant D |  |
 |
Quadrant C |
| Plot type | Count rate plots | Images |
|---|---|---|
| Comparison with Poisson distribution Blue bars denote a histogram of data divided into 1 sec bins. Red curve is a Poisson curve with rate = median count rate of data. |
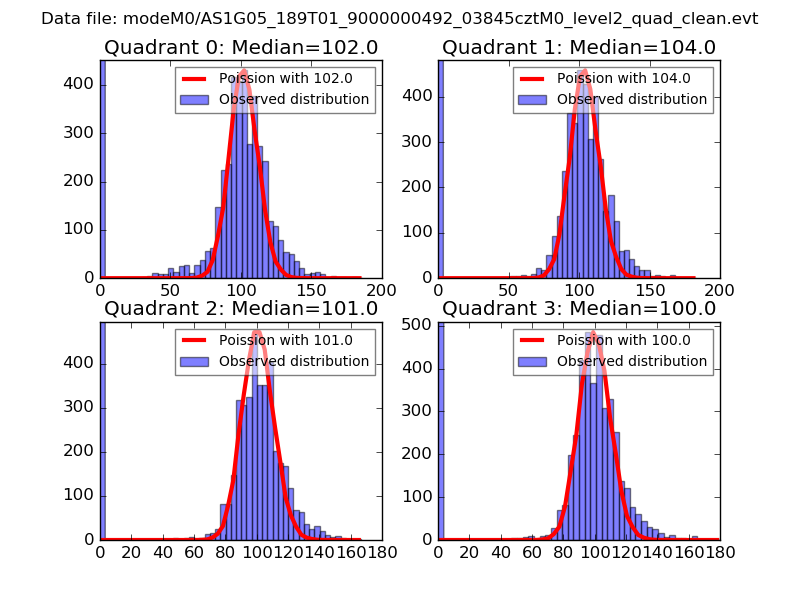 |
 |
| Quadrant-wise count rates Data is divided into 100 sec bins |
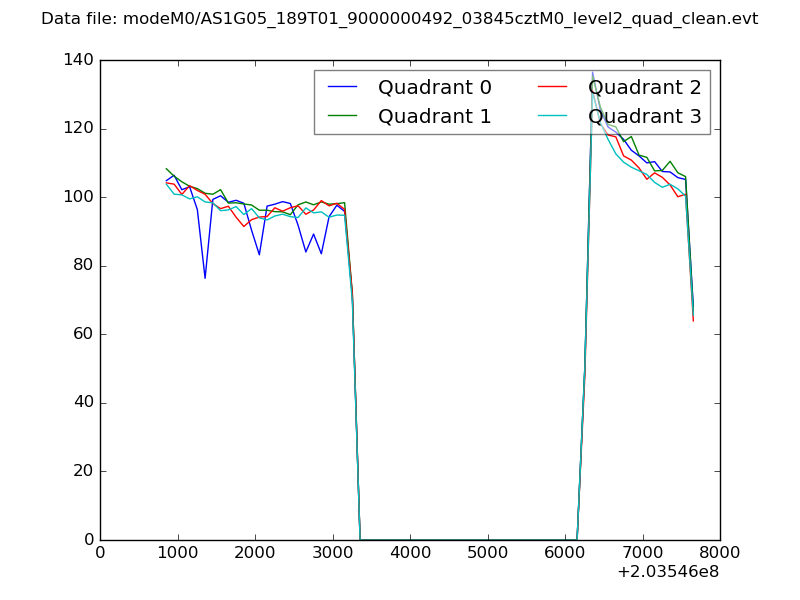 |
|
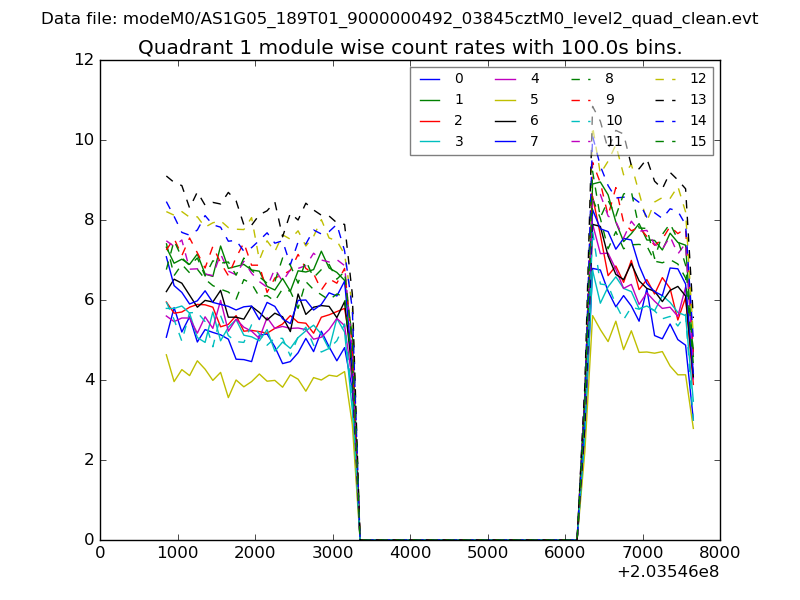
| Module-wise count rates for Quadrant A Data is divided into 100 sec bins |
 |
 |
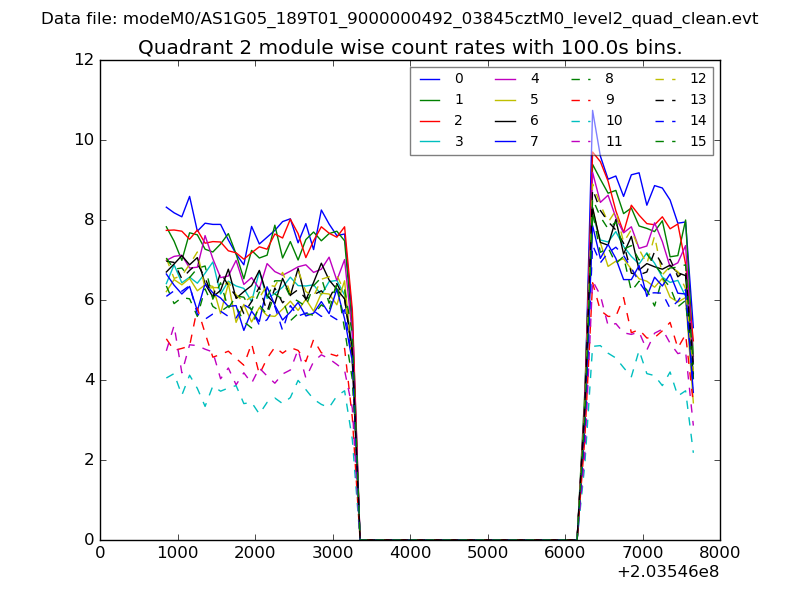
| Module-wise count rates for Quadrant B Data is divided into 100 sec bins |
 |
 |
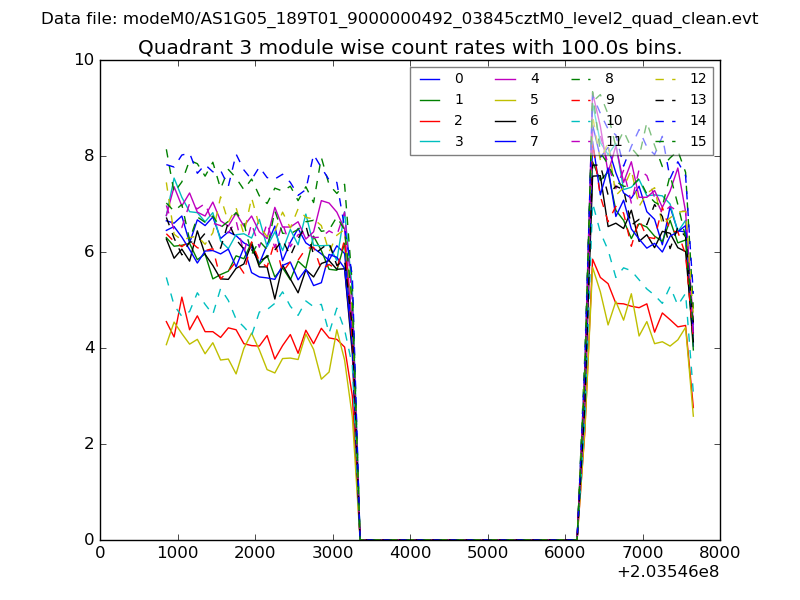
| Module-wise count rates for Quadrant C Data is divided into 100 sec bins |
 |
 |
| Module-wise count rates for Quadrant D Data is divided into 100 sec bins |
 |
 |
| Parameter | Plot |
|---|---|
| CZT HV Monitor | 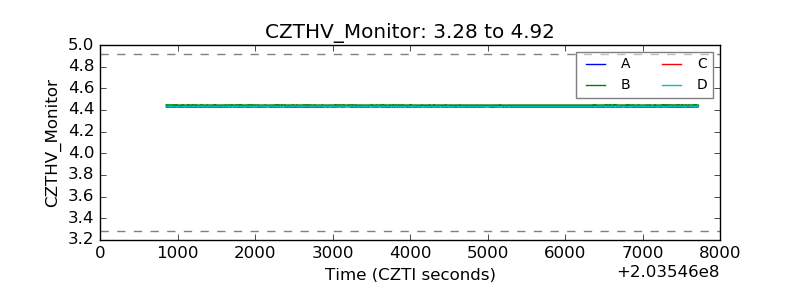 |
| D_VDD | 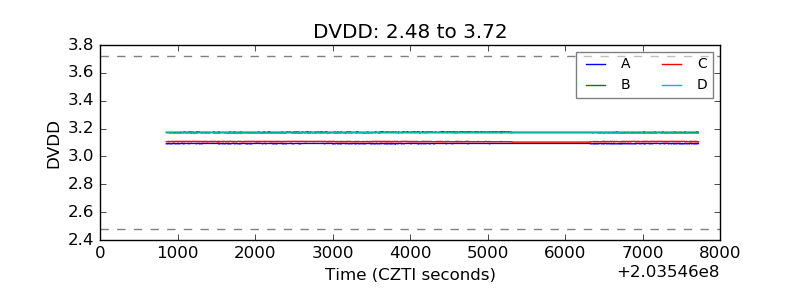 |
| Temperature 1 | 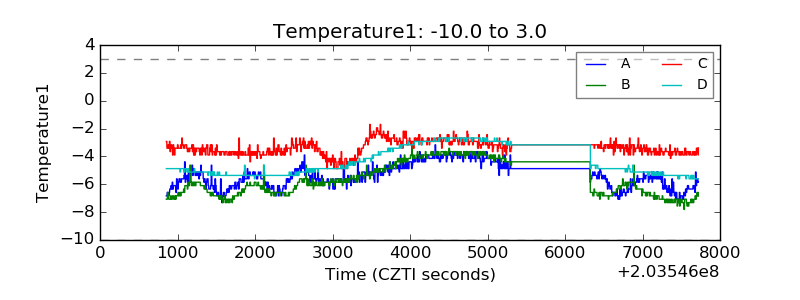 |
| Veto HV Monitor | 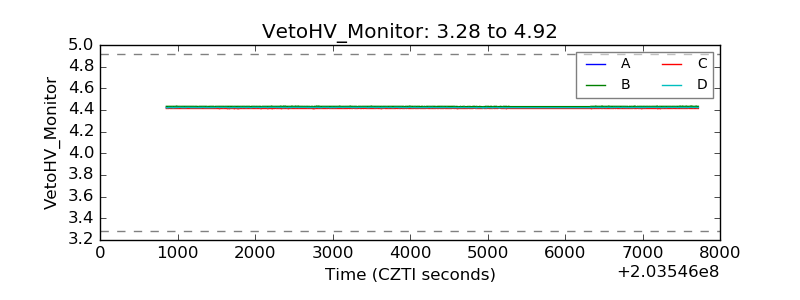 |
| Veto LLD | 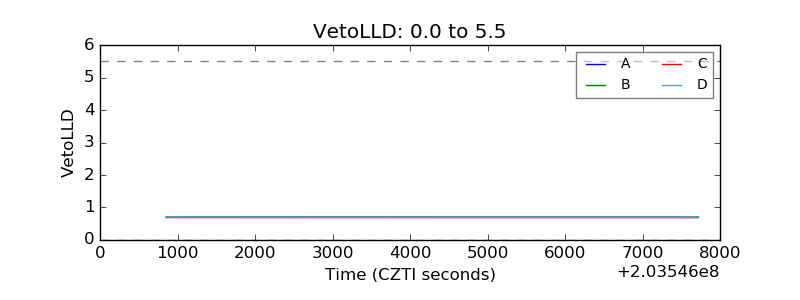 |
| Alpha Counter | 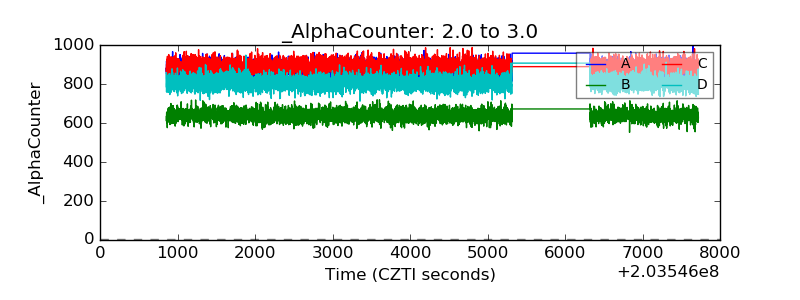 |
| _CPM_Rate | 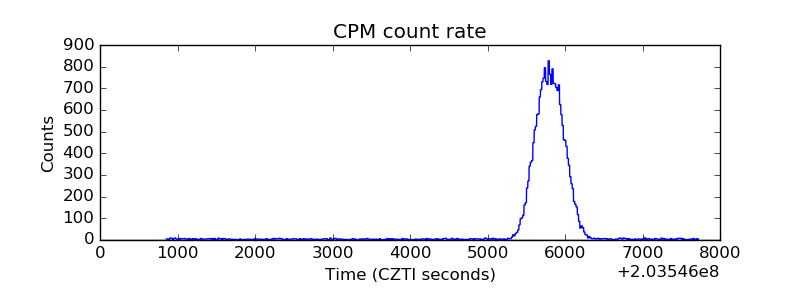 |
| CZT Counter |  |
| +2.5 Volts monitor |  |
| +5 Volts monitor |  |
| Veto Counter | 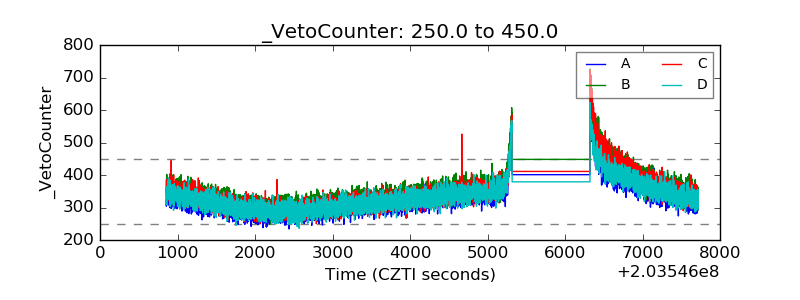 |