| Param | Original file | Final file |
|---|---|---|
| Filename | modeM0/AS1G05_189T01_9000000492_03847cztM0_level2.evt | modeM0/AS1G05_189T01_9000000492_03847cztM0_level2_quad_clean.evt |
| Size (bytes) | 445,582,080 | 62,634,240 |
| Size | 424.9 MB | 59.7 MB |
| Events in quadrant A | 2,816,187 | 381,685 |
| Events in quadrant B | 2,755,826 | 383,616 |
| Events in quadrant C | 4,918,823 | 364,651 |
| Events in quadrant D | 2,614,363 | 365,419 |
| Mode M0 | |||
|---|---|---|---|
| Quadrant | BADHDUFLAG | Total packets | Discarded packets |
| A | 0 | 12330 | 2 |
| B | 0 | 12094 | 1 |
| C | 0 | 18869 | 1 |
| D | 0 | 12071 | 1 |
| Mode M9 | |||
|---|---|---|---|
| Quadrant | BADHDUFLAG | Total packets | Discarded packets |
| A | 0 | 12 | 0 |
| B | 0 | 12 | 0 |
| C | 0 | 12 | 0 |
| D | 0 | 12 | 0 |
| Mode SS | |||
|---|---|---|---|
| Quadrant | BADHDUFLAG | Total packets | Discarded packets |
| A | 0 | 116 | 0 |
| B | 0 | 116 | 0 |
| C | 0 | 116 | 0 |
| D | 0 | 116 | 0 |
| Quadrant | Total seconds | Saturated seconds | Saturation percentage |
|---|---|---|---|
| A | 5736 | 28 | 0.488145% |
| B | 5736 | 31 | 0.540446% |
| C | 5736 | 106 | 1.847978% |
| D | 5736 | 36 | 0.627615% |
Noise dominated data is calculated using 1-second bins in cleaned event files. If a bin has >2000 counts, and if more than 50% of those come from <1% of pixels, then it is considered to be noise-dominated and hence unusable.
| Quadrant | # 1 sec bins | Bins with >0 counts | Bins with >2000 counts | High rate bins dominated by noise | Noise dominated (total time) | Noise dominated (detector-on time) | Marked lightcurve |
|---|---|---|---|---|---|---|---|
| A | 6881 | 5736 | 3 | 3 | 0.04% | 0.05% | 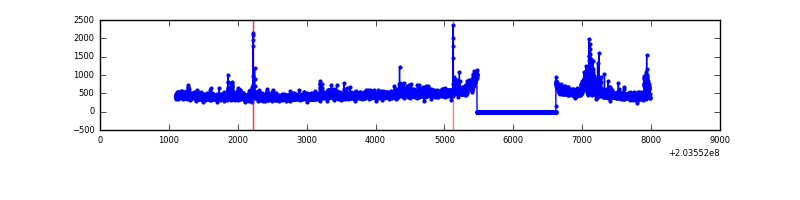 |
| B | 6881 | 5736 | 1 | 1 | 0.01% | 0.02% | 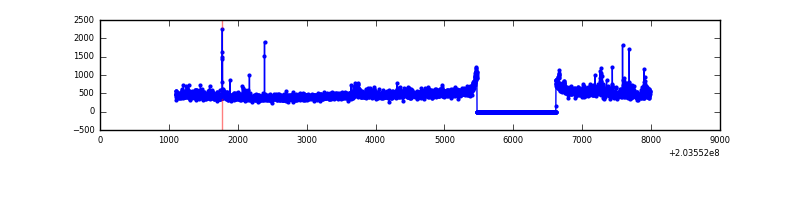 |
| C | 6881 | 5736 | 75 | 75 | 1.09% | 1.31% | 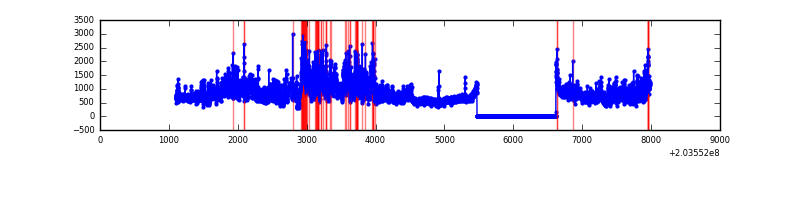 |
| D | 6881 | 5736 | 28 | 28 | 0.41% | 0.49% | 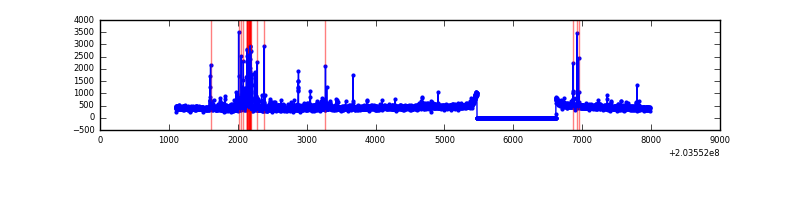 |
Top three noisy pixels from each quadrant. If the there are fewer than three noisy pixels in the level2.evt file, extra rows are filled as -1
| Pixel properties | Quadrant properties | ||||||
|---|---|---|---|---|---|---|---|
| Quadrant | DetID | PixID | Counts | Sigma | Mean | Median | Sigma |
| A | 15 | 234 | 240428 | 1778.34 | 655 | 642 | 134.8 |
| A | 8 | 15 | 30426 | 220.89 | 655 | 642 | 134.8 |
| A | 13 | 251 | 17685 | 126.39 | 655 | 642 | 134.8 |
| B | 15 | 204 | 131971 | 1021.36 | 663 | 648 | 128.6 |
| B | 4 | 81 | 41431 | 317.19 | 663 | 648 | 128.6 |
| B | 0 | 219 | 14316 | 106.3 | 663 | 648 | 128.6 |
| C | 2 | 53 | 2346036 | 15975.62 | 628 | 632 | 146.8 |
| C | 1 | 16 | 75397 | 509.26 | 628 | 632 | 146.8 |
| C | 9 | 247 | 14242 | 92.7 | 628 | 632 | 146.8 |
| D | 13 | 248 | 148950 | 903.73 | 626 | 611 | 164.1 |
| D | 2 | 63 | 63792 | 384.92 | 626 | 611 | 164.1 |
| D | 2 | 14 | 13461 | 78.29 | 626 | 611 | 164.1 |
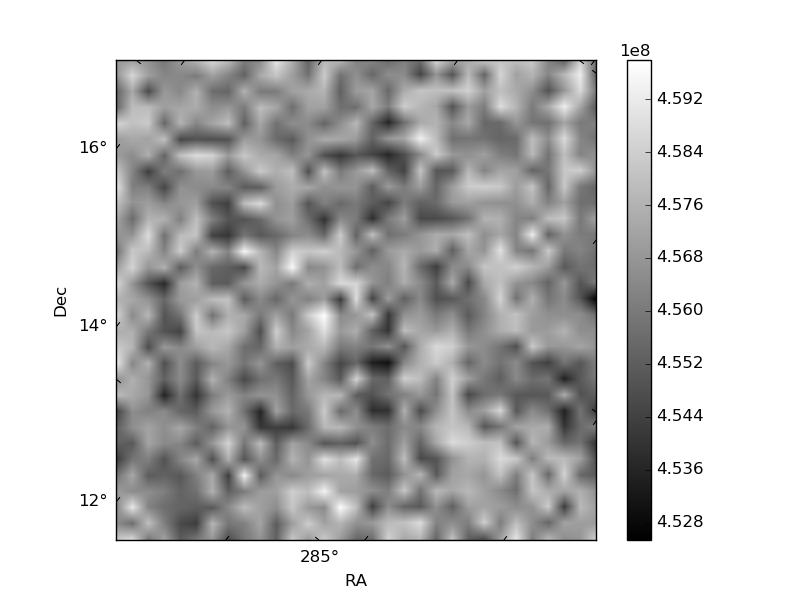
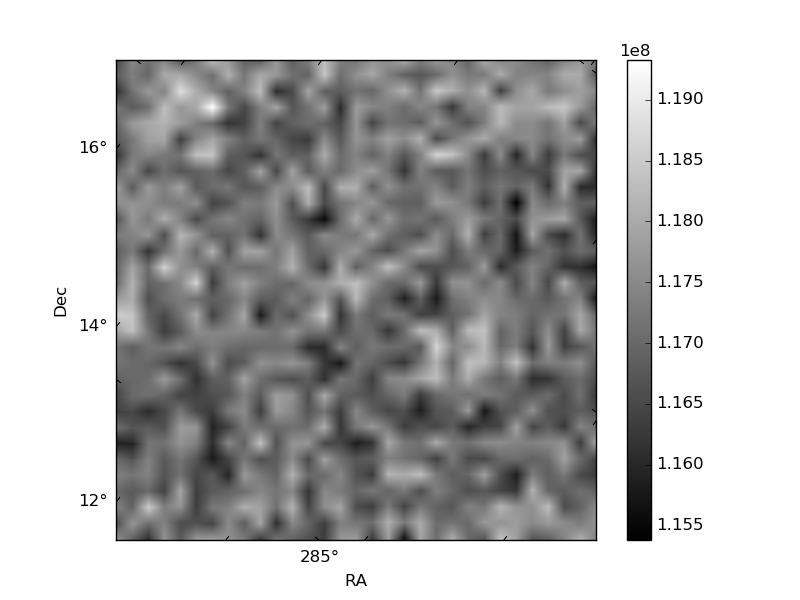
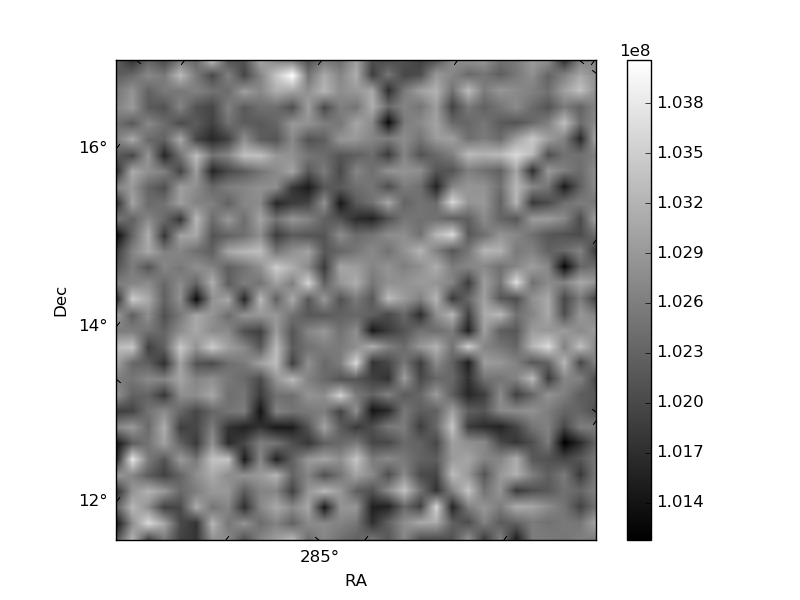
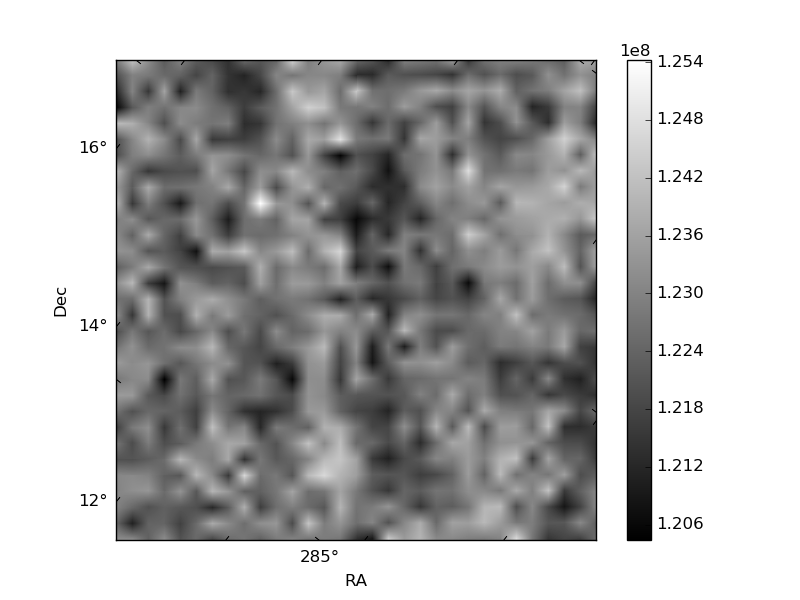
Histogram calculated using DETX and DETY for each event in the final _common_clean file
| Quadrant A | 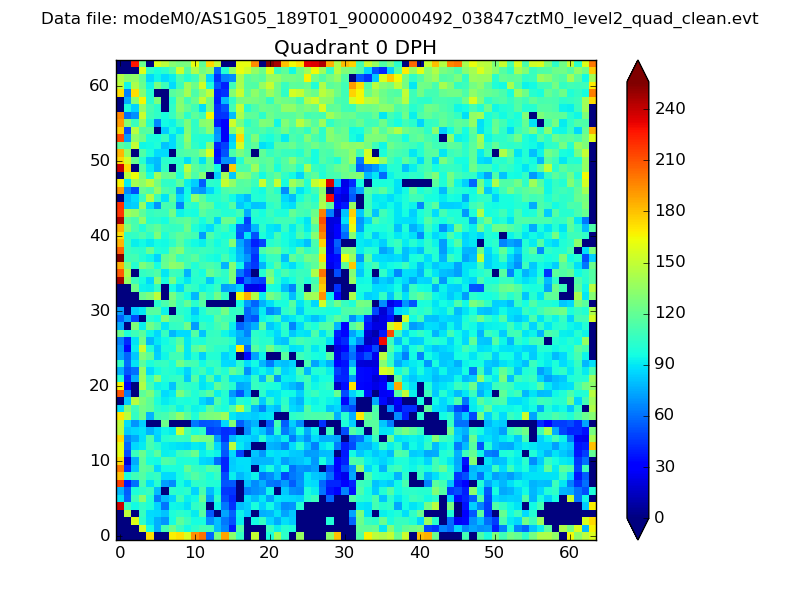 |
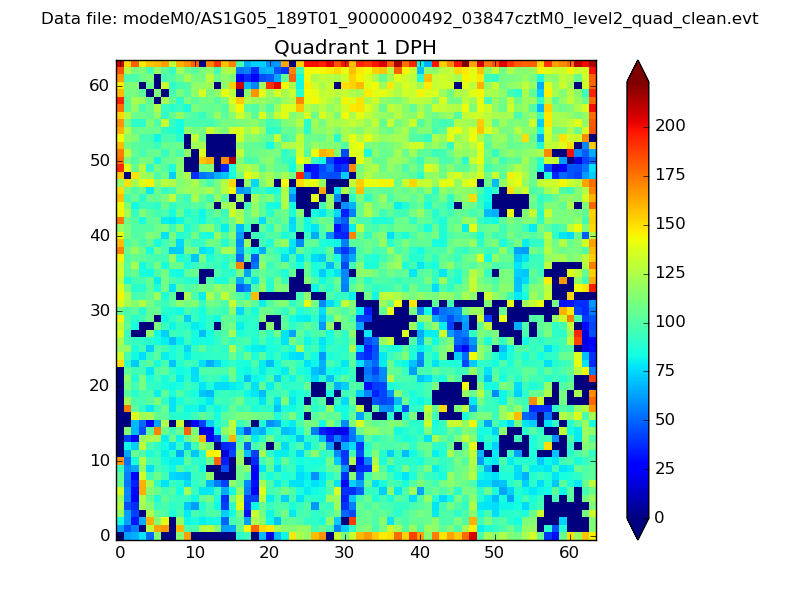 |
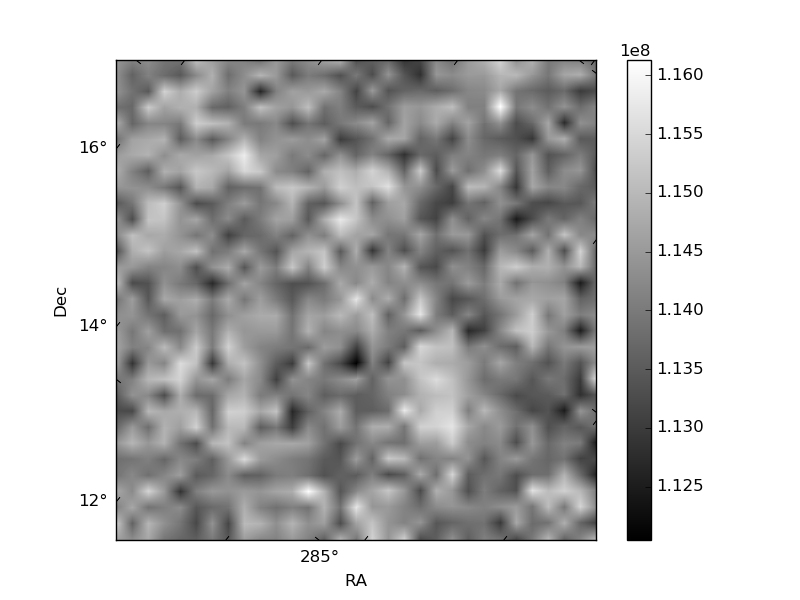
Quadrant B |
|---|---|---|---|
| Quadrant D | 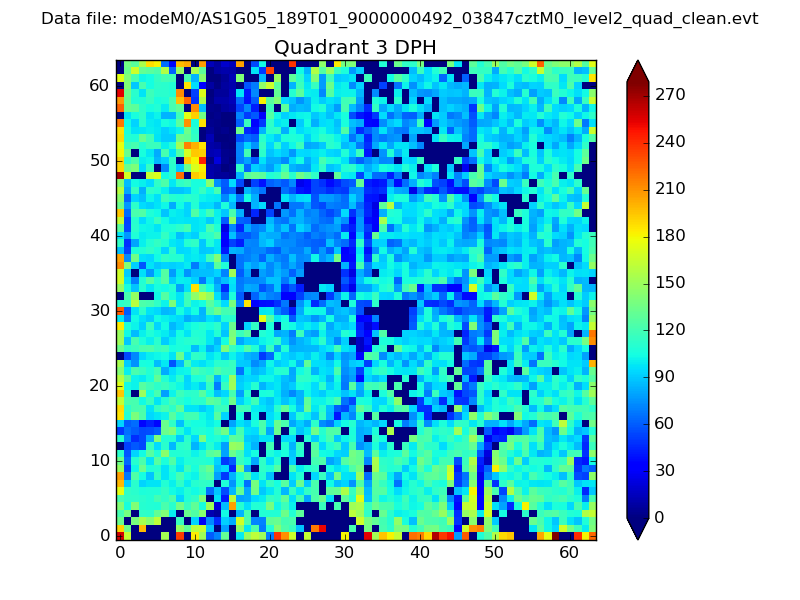 |
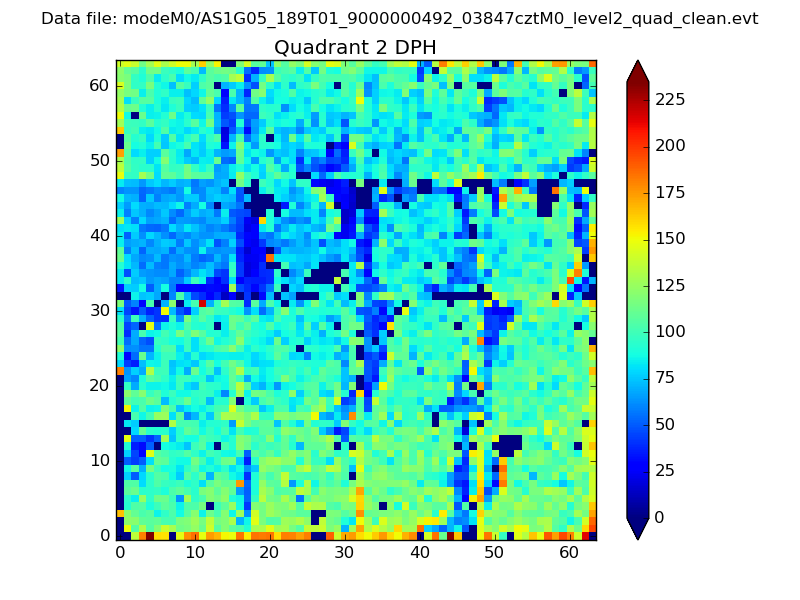 |
Quadrant C |
| Plot type | Count rate plots | Images |
|---|---|---|
| Comparison with Poisson distribution Blue bars denote a histogram of data divided into 1 sec bins. Red curve is a Poisson curve with rate = median count rate of data. |
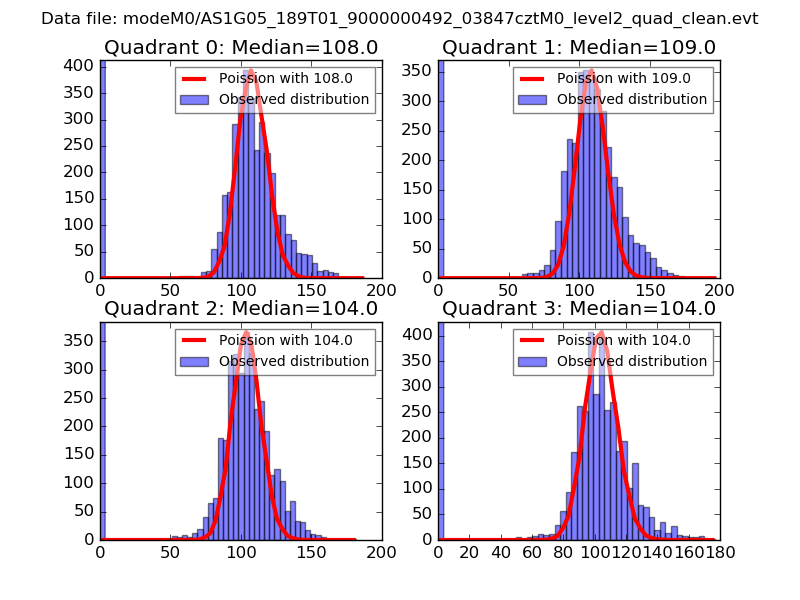 |
 |
| Quadrant-wise count rates Data is divided into 100 sec bins |
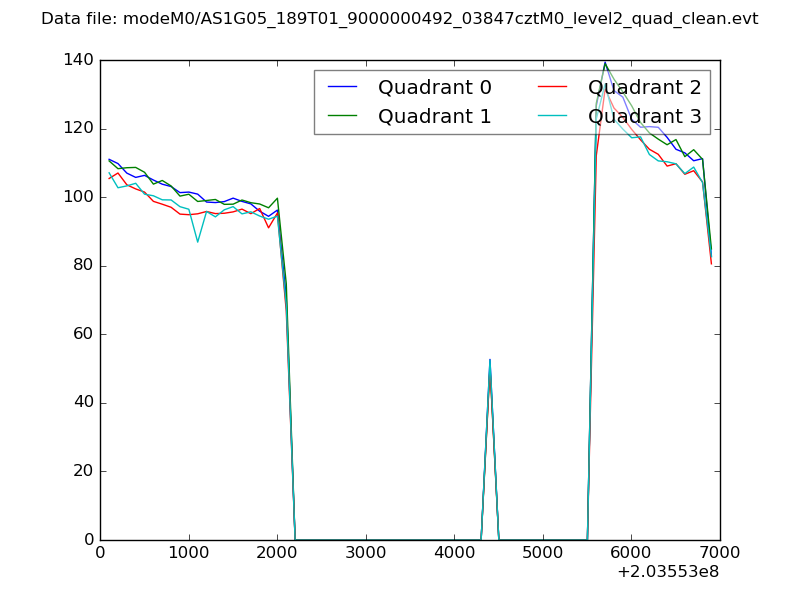 |
|
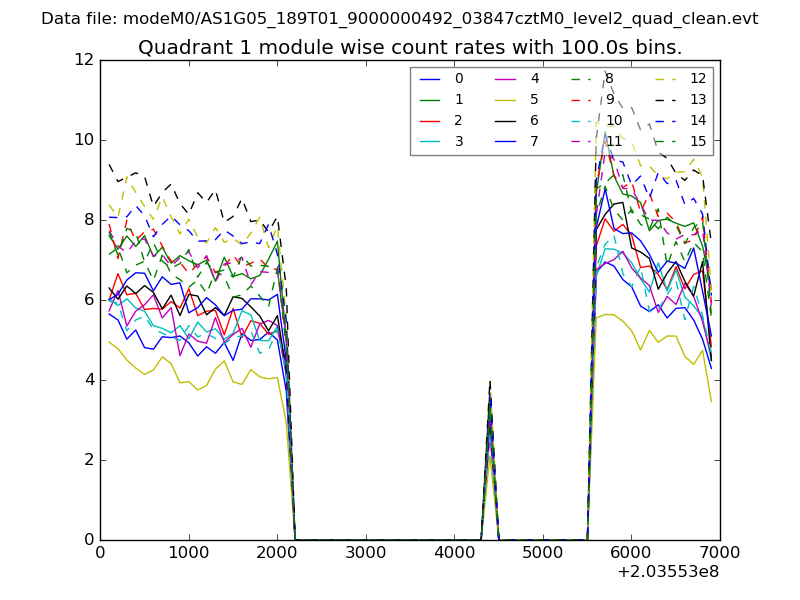
| Module-wise count rates for Quadrant A Data is divided into 100 sec bins |
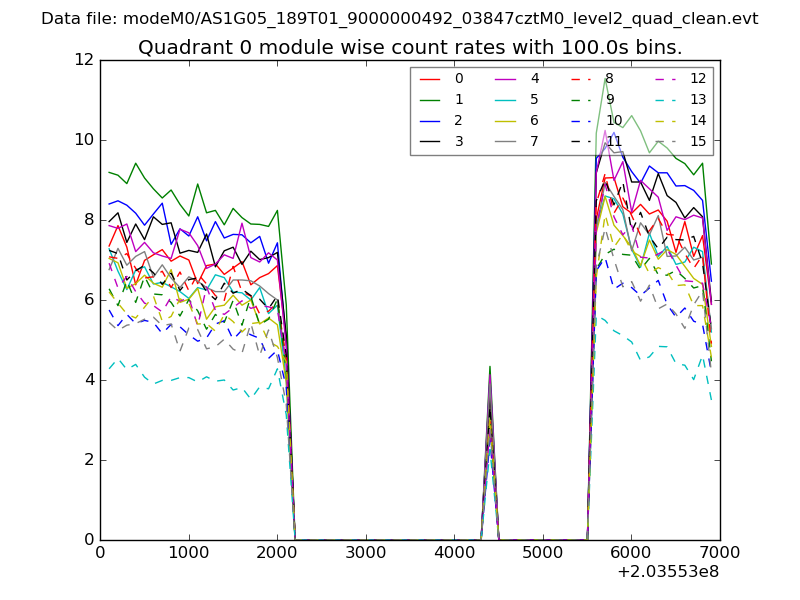 |
 |
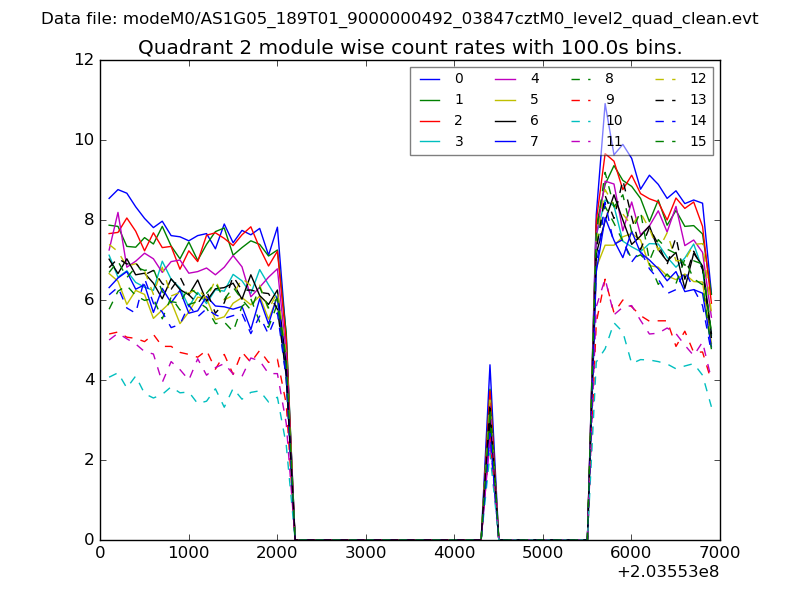
| Module-wise count rates for Quadrant B Data is divided into 100 sec bins |
 |
 |
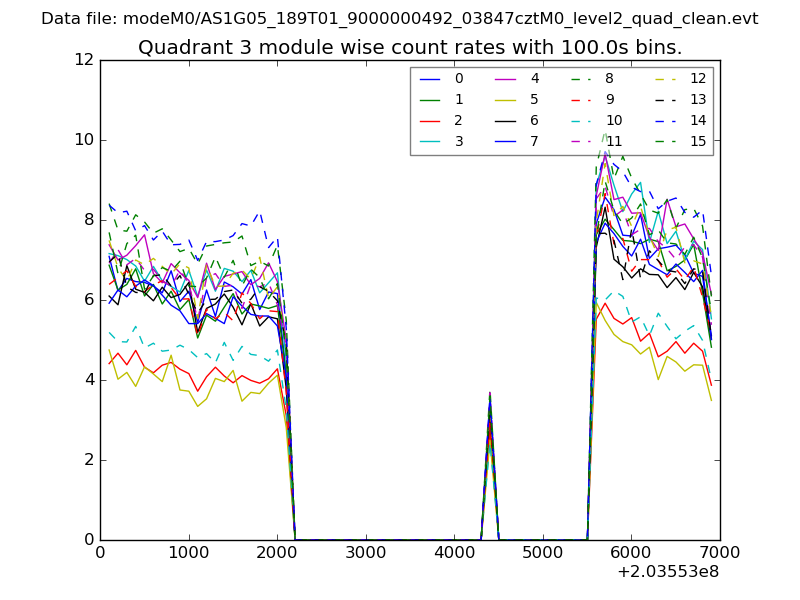
| Module-wise count rates for Quadrant C Data is divided into 100 sec bins |
 |
 |
| Module-wise count rates for Quadrant D Data is divided into 100 sec bins |
 |
 |
| Parameter | Plot |
|---|---|
| CZT HV Monitor | 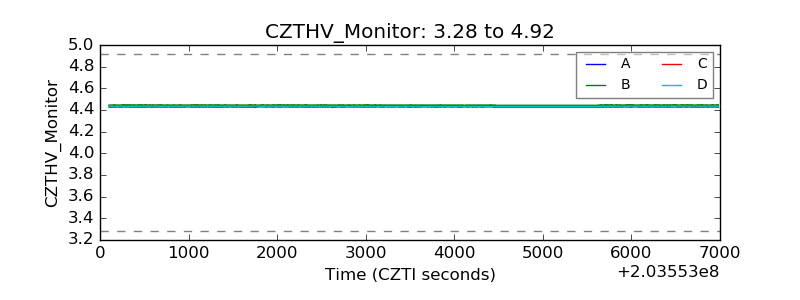 |
| D_VDD | 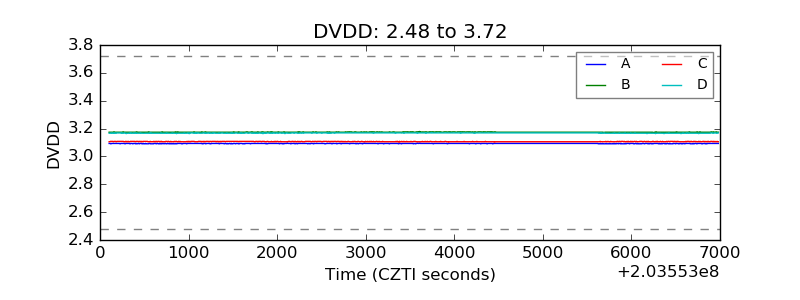 |
| Temperature 1 | 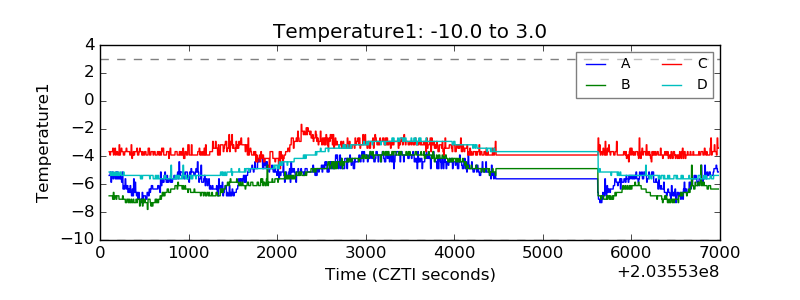 |
| Veto HV Monitor | 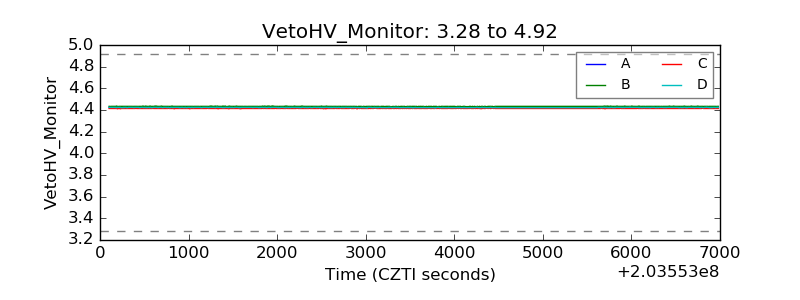 |
| Veto LLD | 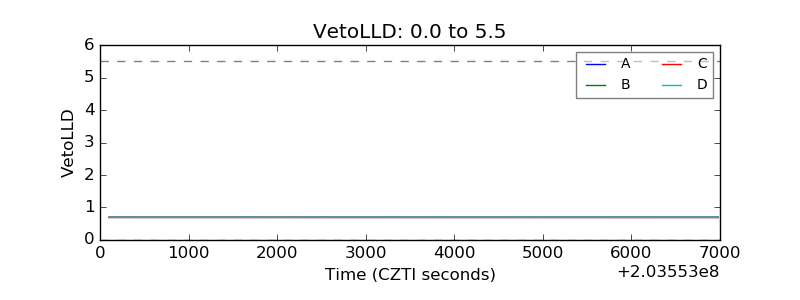 |
| Alpha Counter | 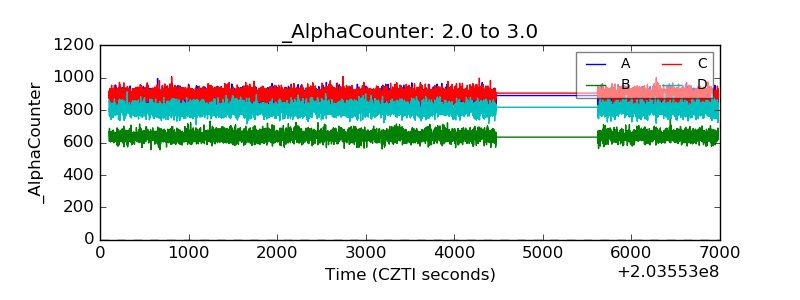 |
| _CPM_Rate | 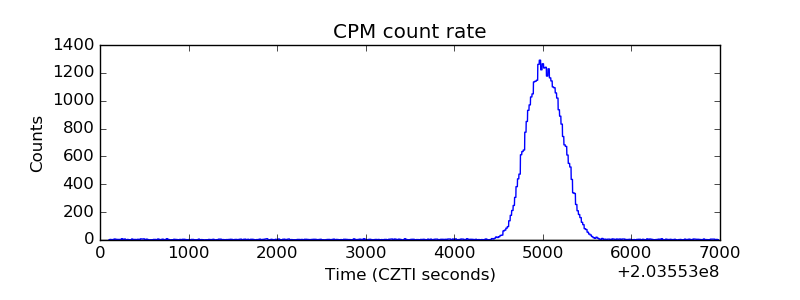 |
| CZT Counter | 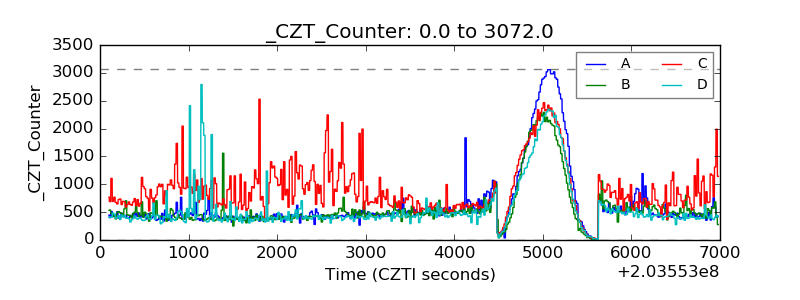 |
| +2.5 Volts monitor |  |
| +5 Volts monitor |  |
| _ROLL_ROT | 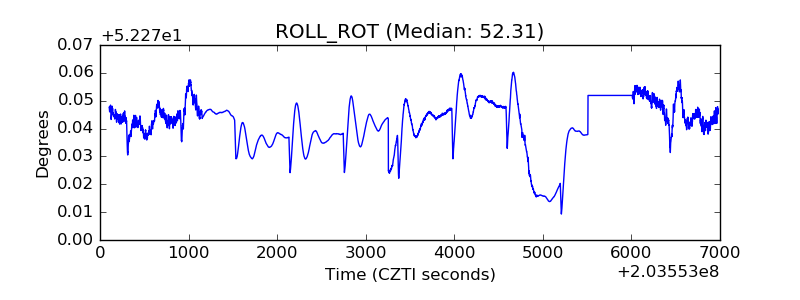 |
| _Roll_DEC | 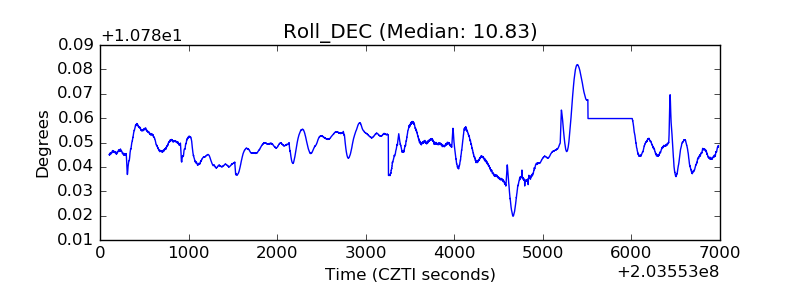 |
| _Roll_RA | 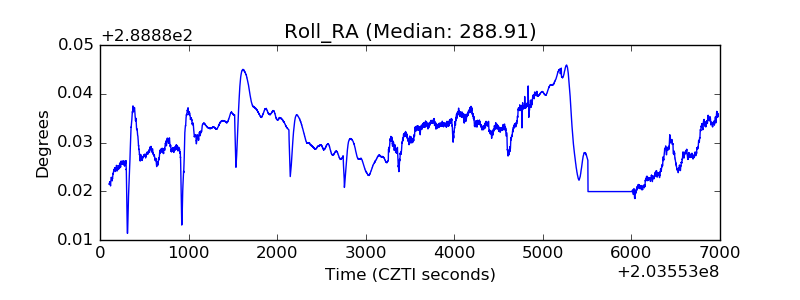 |
| Veto Counter | 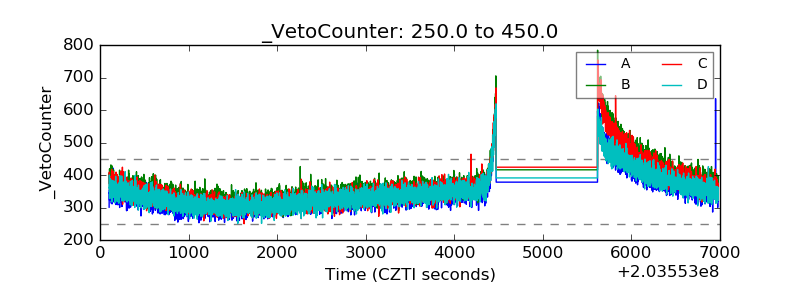 |