| Param | Original file | Final file |
|---|---|---|
| Filename | modeM0/AS1G05_189T01_9000000492_03848cztM0_level2.evt | modeM0/AS1G05_189T01_9000000492_03848cztM0_level2_quad_clean.evt |
| Size (bytes) | 468,434,880 | 70,303,680 |
| Size | 446.7 MB | 67.0 MB |
| Events in quadrant A | 3,272,515 | 436,596 |
| Events in quadrant B | 3,414,333 | 438,033 |
| Events in quadrant C | 4,438,300 | 418,607 |
| Events in quadrant D | 2,655,370 | 417,376 |
| Mode M0 | |||
|---|---|---|---|
| Quadrant | BADHDUFLAG | Total packets | Discarded packets |
| A | 0 | 13602 | 2 |
| B | 0 | 14208 | 1 |
| C | 0 | 17660 | 1 |
| D | 0 | 12344 | 1 |
| Mode M9 | |||
|---|---|---|---|
| Quadrant | BADHDUFLAG | Total packets | Discarded packets |
| A | 0 | 12 | 0 |
| B | 0 | 12 | 0 |
| C | 0 | 12 | 0 |
| D | 0 | 12 | 0 |
| Mode SS | |||
|---|---|---|---|
| Quadrant | BADHDUFLAG | Total packets | Discarded packets |
| A | 0 | 120 | 0 |
| B | 0 | 120 | 0 |
| C | 0 | 120 | 0 |
| D | 0 | 120 | 0 |
| Quadrant | Total seconds | Saturated seconds | Saturation percentage |
|---|---|---|---|
| A | 5991 | 75 | 1.251878% |
| B | 5991 | 93 | 1.552328% |
| C | 5991 | 80 | 1.335336% |
| D | 5991 | 33 | 0.550826% |
Noise dominated data is calculated using 1-second bins in cleaned event files. If a bin has >2000 counts, and if more than 50% of those come from <1% of pixels, then it is considered to be noise-dominated and hence unusable.
| Quadrant | # 1 sec bins | Bins with >0 counts | Bins with >2000 counts | High rate bins dominated by noise | Noise dominated (total time) | Noise dominated (detector-on time) | Marked lightcurve |
|---|---|---|---|---|---|---|---|
| A | 7187 | 5991 | 4 | 4 | 0.06% | 0.07% | 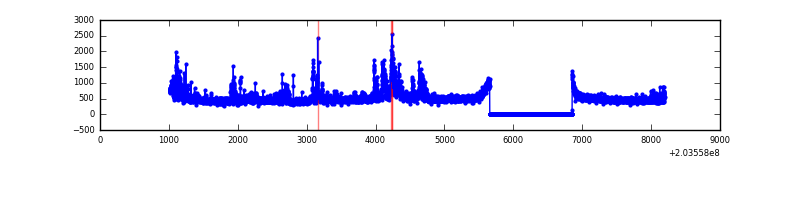 |
| B | 7187 | 5991 | 19 | 19 | 0.26% | 0.32% | 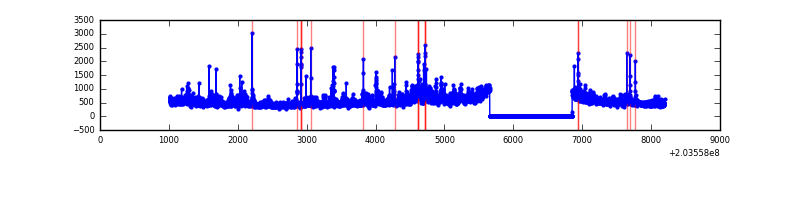 |
| C | 7187 | 5991 | 35 | 35 | 0.49% | 0.58% | 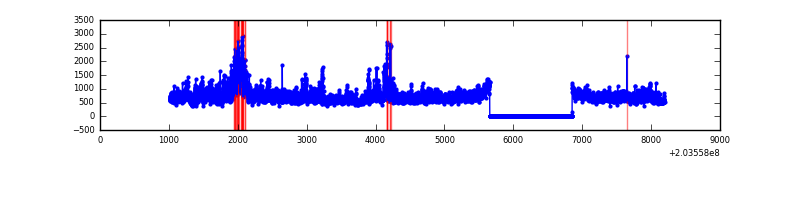 |
| D | 7187 | 5991 | 1 | 1 | 0.01% | 0.02% | 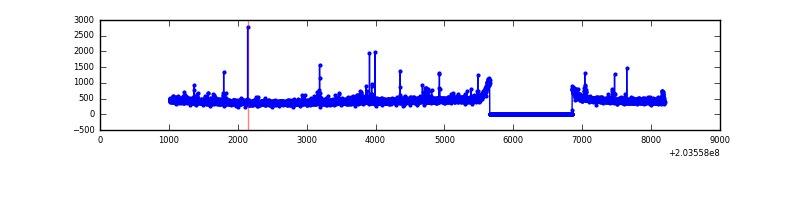 |
Top three noisy pixels from each quadrant. If the there are fewer than three noisy pixels in the level2.evt file, extra rows are filled as -1
| Pixel properties | Quadrant properties | ||||||
|---|---|---|---|---|---|---|---|
| Quadrant | DetID | PixID | Counts | Sigma | Mean | Median | Sigma |
| A | 15 | 234 | 477668 | 3287.08 | 709 | 696 | 145.1 |
| A | 0 | 50 | 22807 | 152.38 | 709 | 696 | 145.1 |
| A | 0 | 199 | 19848 | 131.99 | 709 | 696 | 145.1 |
| B | 15 | 204 | 409085 | 2946.87 | 716 | 701 | 138.6 |
| B | 4 | 81 | 148490 | 1066.43 | 716 | 701 | 138.6 |
| B | 0 | 244 | 35161 | 248.66 | 716 | 701 | 138.6 |
| C | 2 | 53 | 1679036 | 10557.48 | 681 | 686 | 159.0 |
| C | 1 | 241 | 68576 | 427.05 | 681 | 686 | 159.0 |
| C | 10 | 65 | 20086 | 122.03 | 681 | 686 | 159.0 |
| D | 2 | 63 | 25175 | 145.56 | 680 | 663 | 168.4 |
| D | 13 | 248 | 14976 | 85.0 | 680 | 663 | 168.4 |
| D | 2 | 14 | 14418 | 81.68 | 680 | 663 | 168.4 |
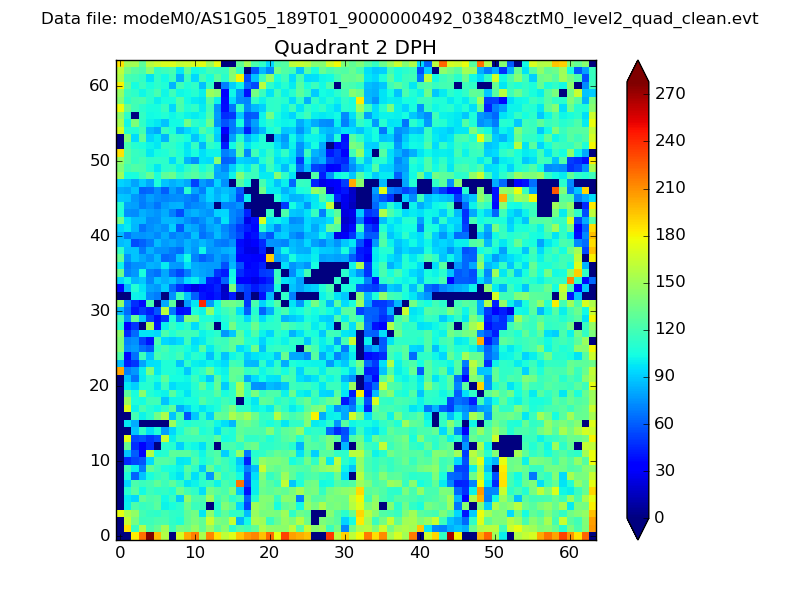
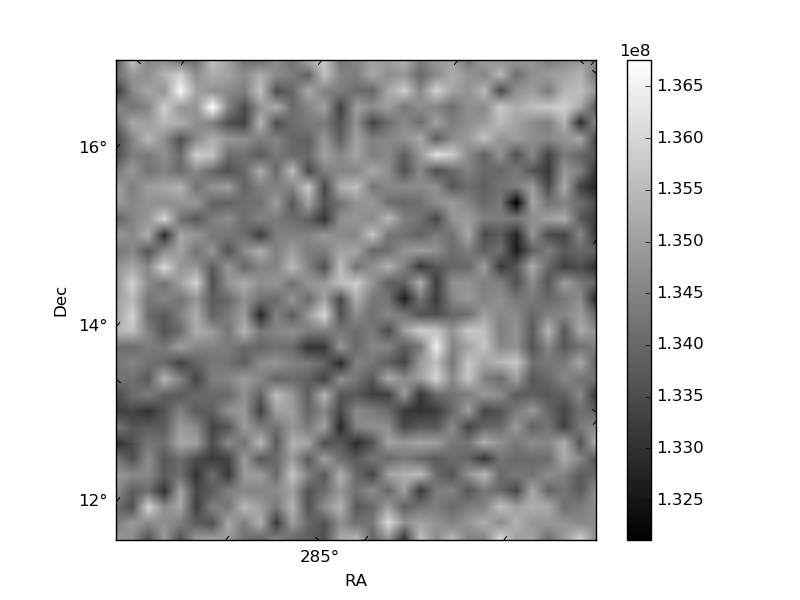
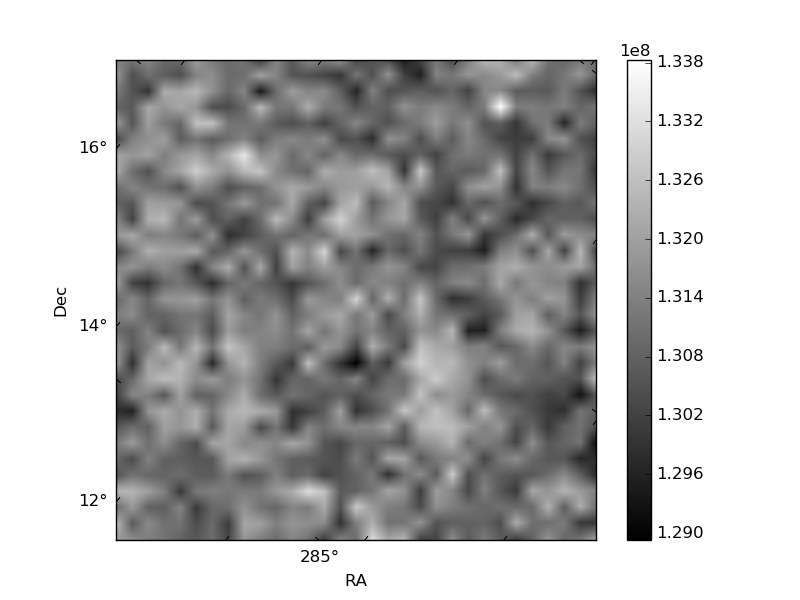
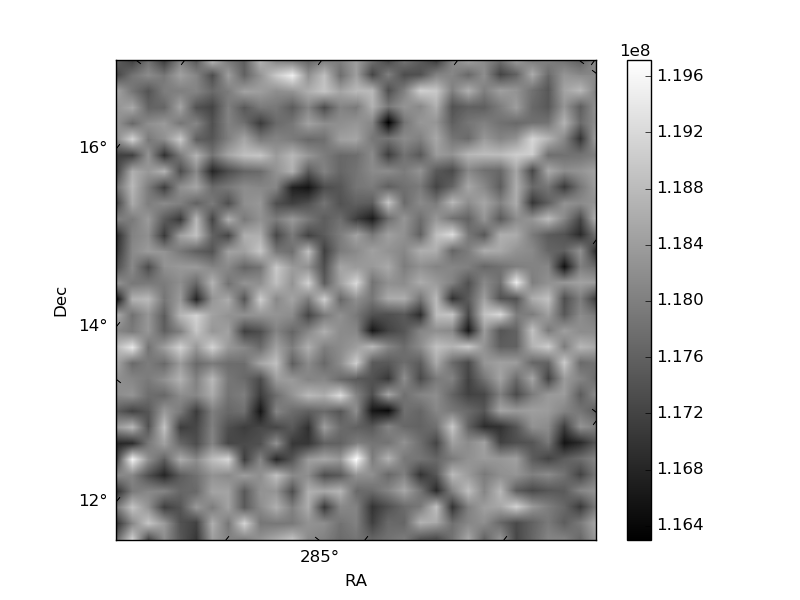
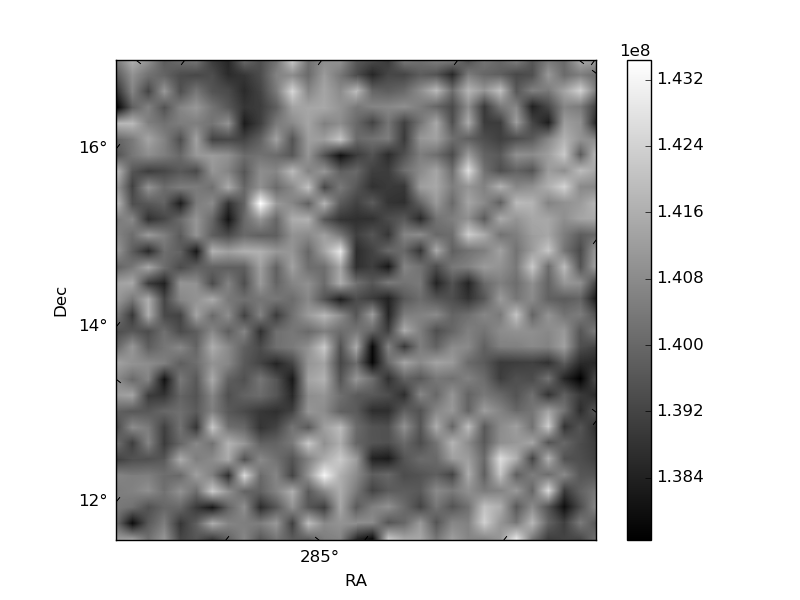
Histogram calculated using DETX and DETY for each event in the final _common_clean file
| Quadrant A | 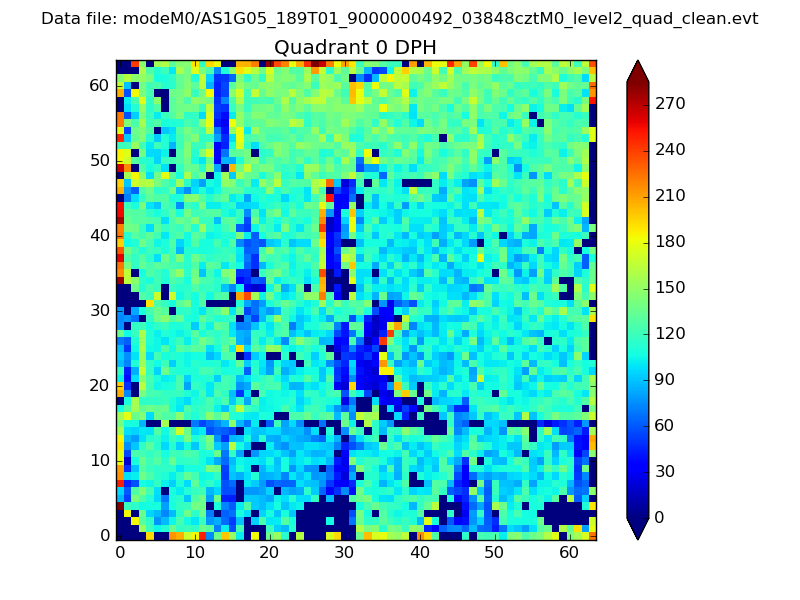 |
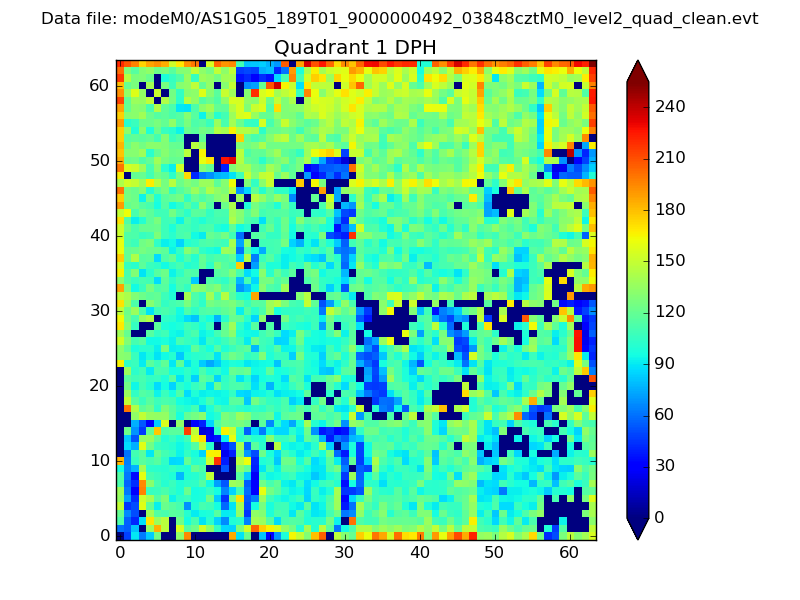 |
Quadrant B |
|---|---|---|---|
| Quadrant D | 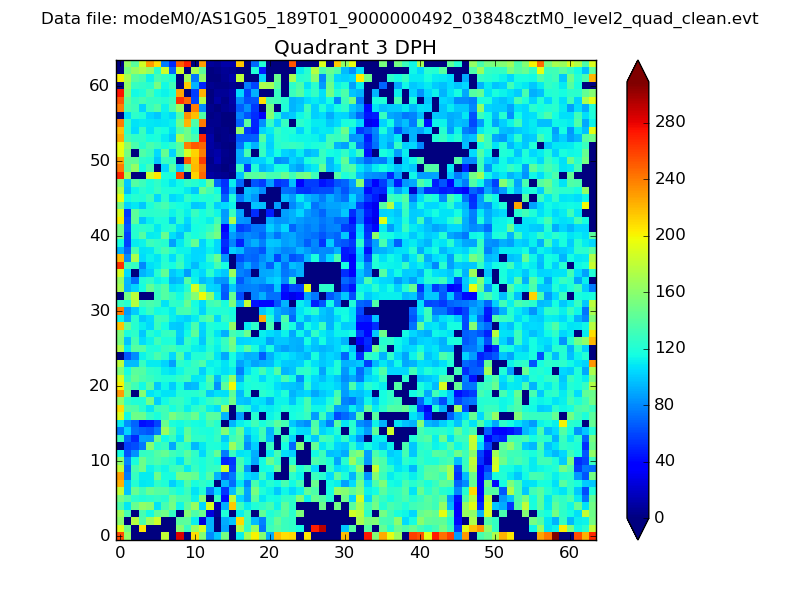 |
 |
Quadrant C |
| Plot type | Count rate plots | Images |
|---|---|---|
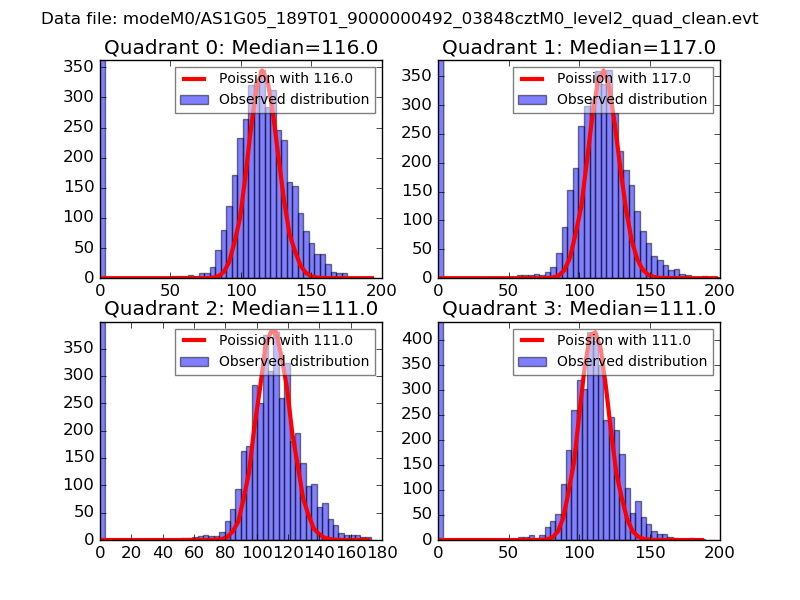
| Comparison with Poisson distribution Blue bars denote a histogram of data divided into 1 sec bins. Red curve is a Poisson curve with rate = median count rate of data. |
 |
 |
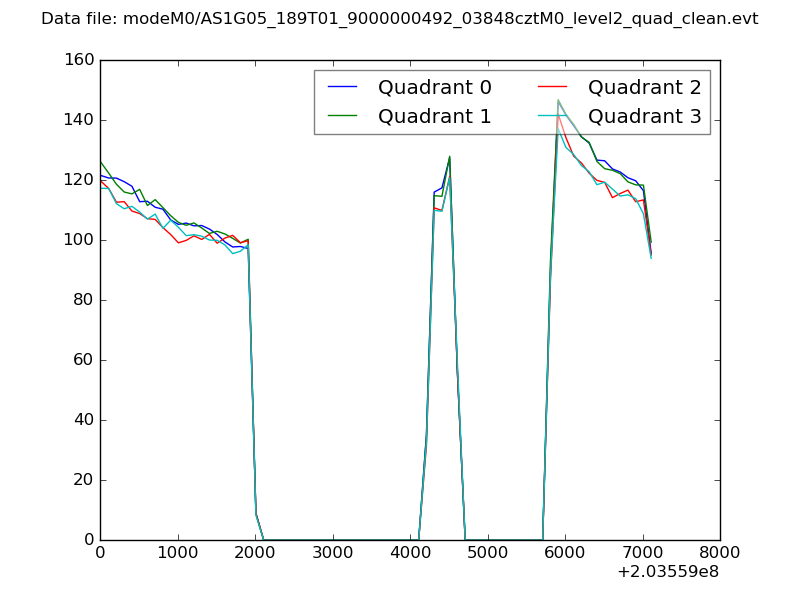
| Quadrant-wise count rates Data is divided into 100 sec bins |
 |
|
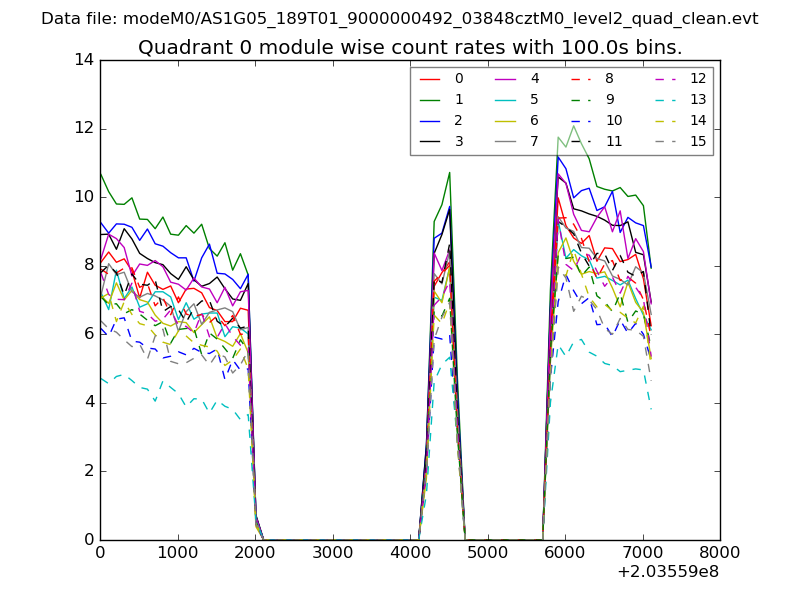
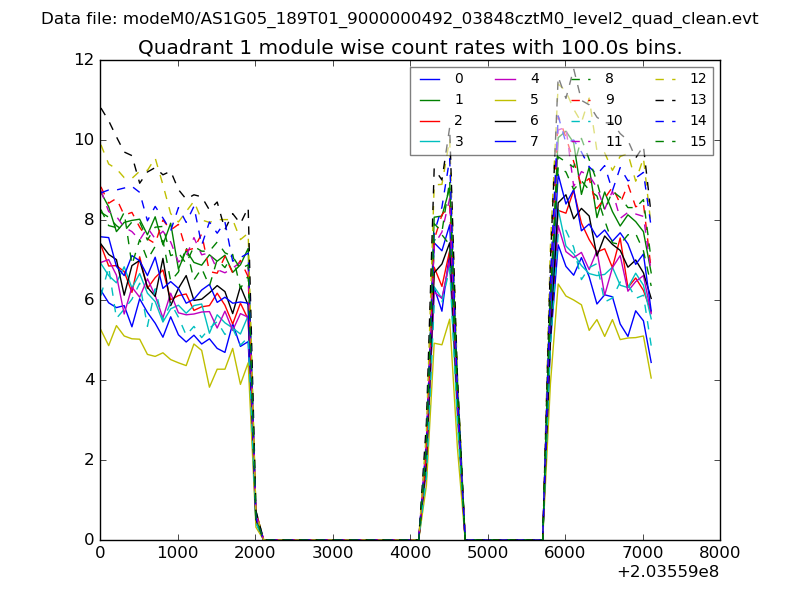
| Module-wise count rates for Quadrant A Data is divided into 100 sec bins |
 |
 |
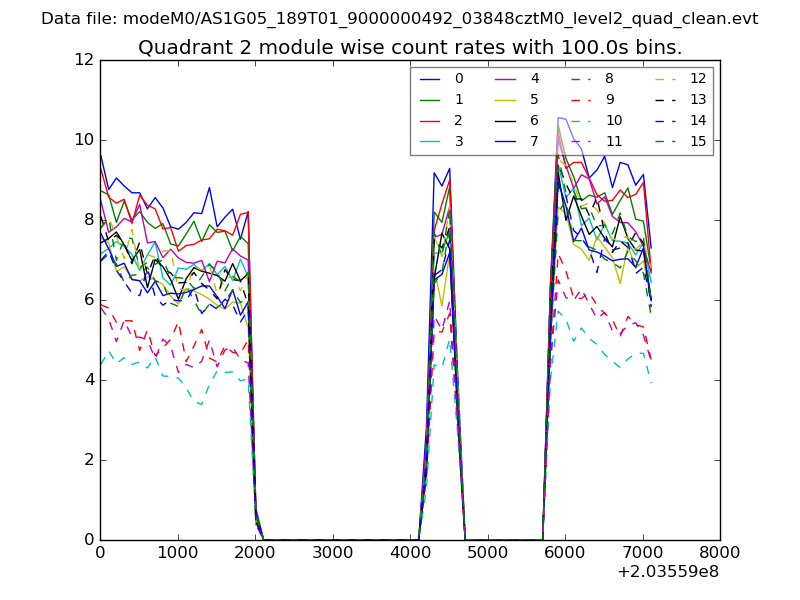
| Module-wise count rates for Quadrant B Data is divided into 100 sec bins |
 |
 |
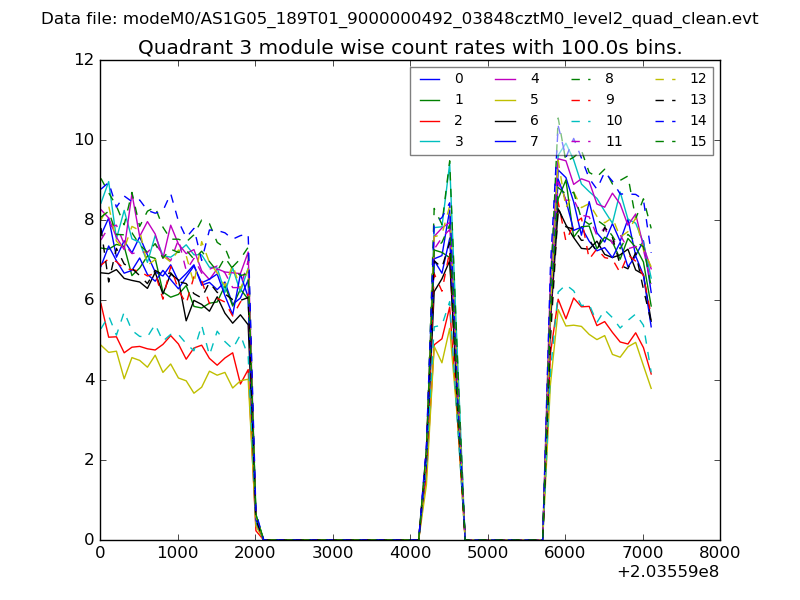
| Module-wise count rates for Quadrant C Data is divided into 100 sec bins |
 |
 |
| Module-wise count rates for Quadrant D Data is divided into 100 sec bins |
 |
 |
| Parameter | Plot |
|---|---|
| CZT HV Monitor | 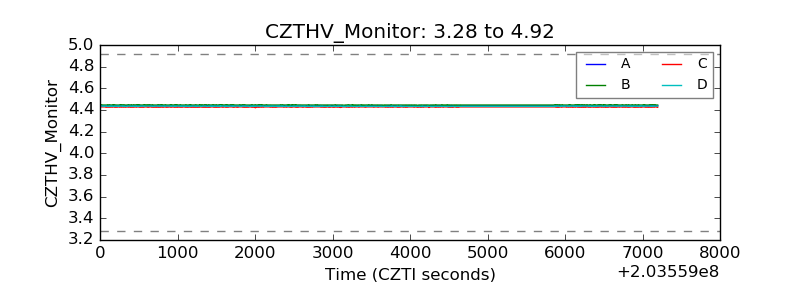 |
| D_VDD | 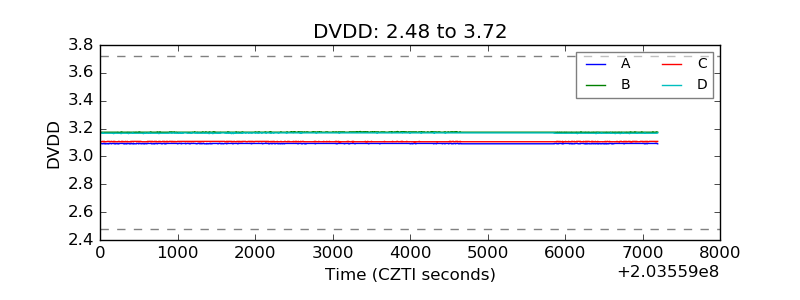 |
| Temperature 1 | 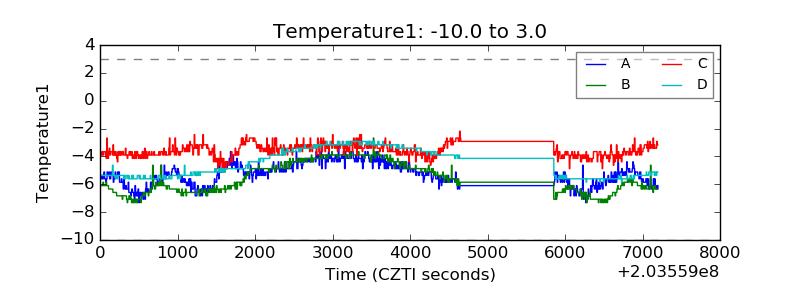 |
| Veto HV Monitor |  |
| Veto LLD | 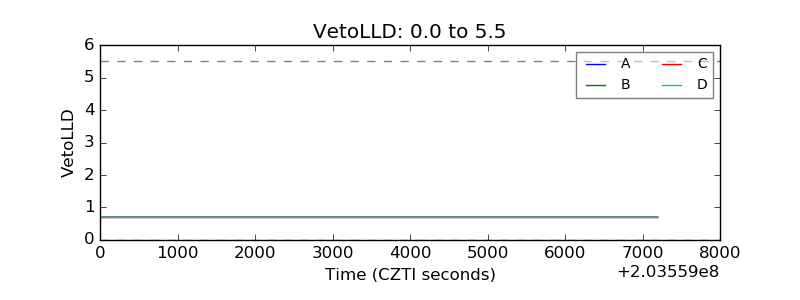 |
| Alpha Counter | 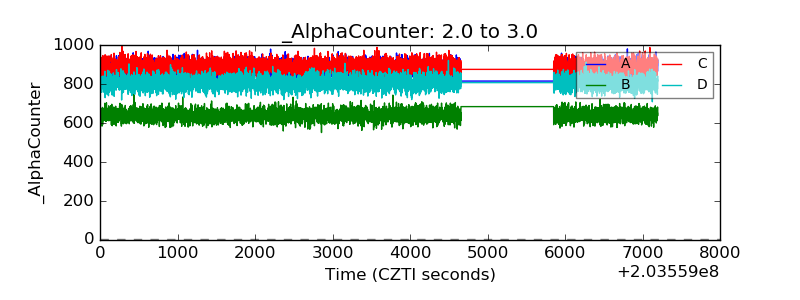 |
| _CPM_Rate | 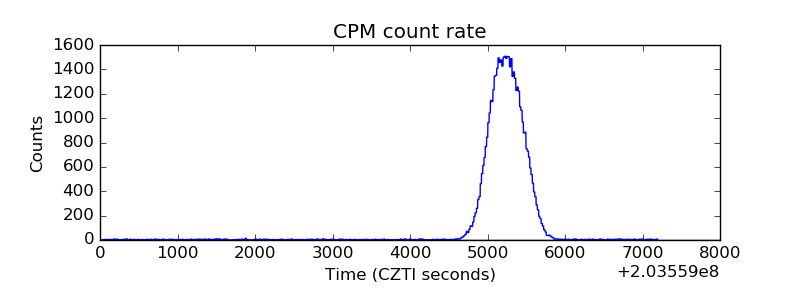 |
| CZT Counter | 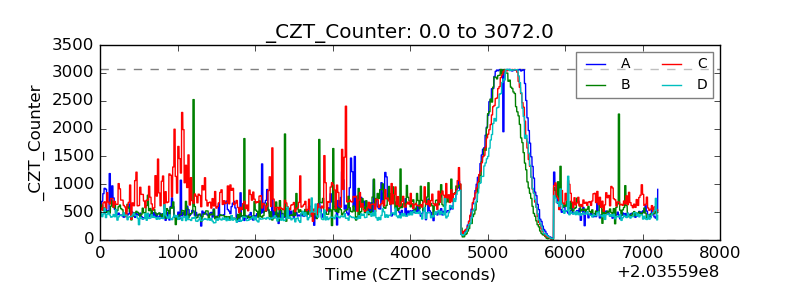 |
| +2.5 Volts monitor | 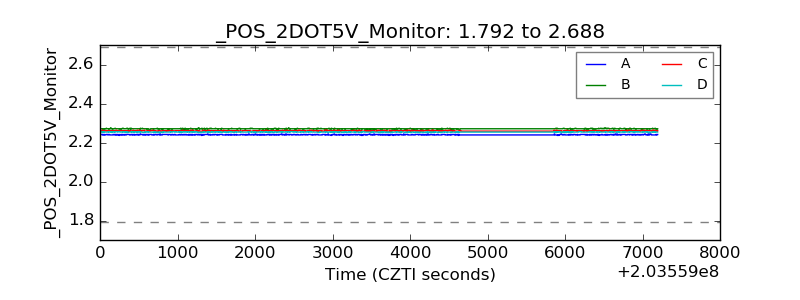 |
| +5 Volts monitor |  |
| Veto Counter | 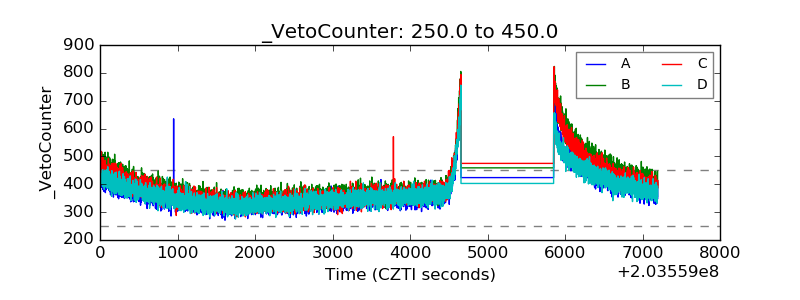 |