| Param | Original file | Final file |
|---|---|---|
| Filename | modeM0/AS1G05_189T01_9000000492_03849cztM0_level2.evt | modeM0/AS1G05_189T01_9000000492_03849cztM0_level2_quad_clean.evt |
| Size (bytes) | 441,322,560 | 74,321,280 |
| Size | 420.9 MB | 70.9 MB |
| Events in quadrant A | 3,006,326 | 467,165 |
| Events in quadrant B | 3,043,578 | 471,018 |
| Events in quadrant C | 3,819,318 | 447,373 |
| Events in quadrant D | 3,084,101 | 441,225 |
| Mode M0 | |||
|---|---|---|---|
| Quadrant | BADHDUFLAG | Total packets | Discarded packets |
| A | 0 | 12697 | 2 |
| B | 0 | 12786 | 1 |
| C | 0 | 15486 | 1 |
| D | 0 | 13451 | 1 |
| Mode M9 | |||
|---|---|---|---|
| Quadrant | BADHDUFLAG | Total packets | Discarded packets |
| A | 0 | 13 | 0 |
| B | 0 | 13 | 0 |
| C | 0 | 13 | 0 |
| D | 0 | 13 | 0 |
| Mode SS | |||
|---|---|---|---|
| Quadrant | BADHDUFLAG | Total packets | Discarded packets |
| A | 0 | 122 | 0 |
| B | 0 | 122 | 0 |
| C | 0 | 122 | 0 |
| D | 0 | 122 | 0 |
| Quadrant | Total seconds | Saturated seconds | Saturation percentage |
|---|---|---|---|
| A | 6071 | 53 | 0.873003% |
| B | 6071 | 67 | 1.103607% |
| C | 6071 | 71 | 1.169494% |
| D | 6071 | 97 | 1.597760% |
Noise dominated data is calculated using 1-second bins in cleaned event files. If a bin has >2000 counts, and if more than 50% of those come from <1% of pixels, then it is considered to be noise-dominated and hence unusable.
| Quadrant | # 1 sec bins | Bins with >0 counts | Bins with >2000 counts | High rate bins dominated by noise | Noise dominated (total time) | Noise dominated (detector-on time) | Marked lightcurve |
|---|---|---|---|---|---|---|---|
| A | 7341 | 6071 | 0 | 0 | 0.00% | 0.00% | 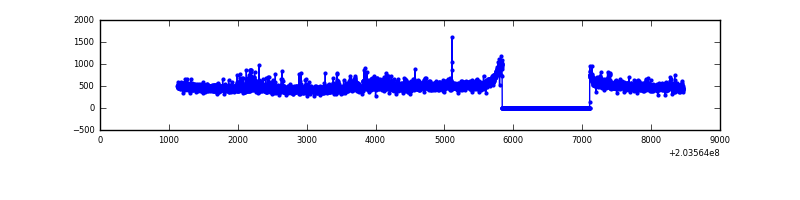 |
| B | 7341 | 6071 | 9 | 9 | 0.12% | 0.15% | 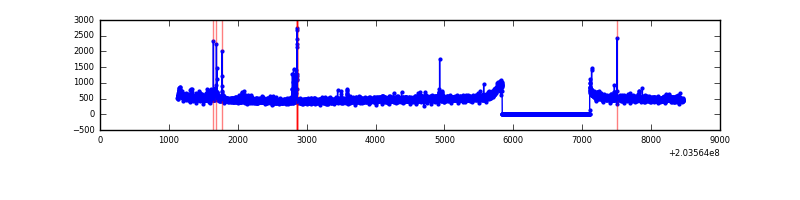 |
| C | 7341 | 6071 | 2 | 2 | 0.03% | 0.03% | 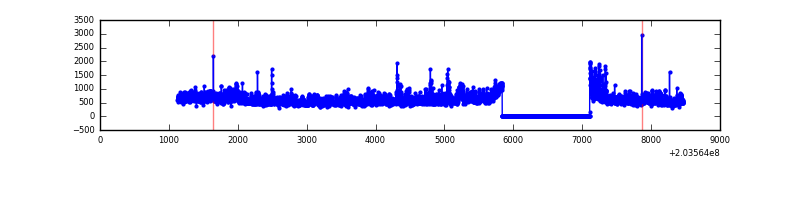 |
| D | 7341 | 6072 | 59 | 59 | 0.80% | 0.97% | 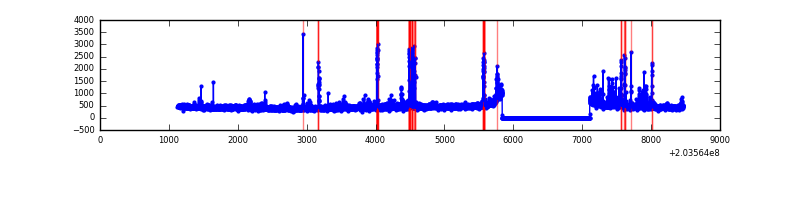 |
Top three noisy pixels from each quadrant. If the there are fewer than three noisy pixels in the level2.evt file, extra rows are filled as -1
| Pixel properties | Quadrant properties | ||||||
|---|---|---|---|---|---|---|---|
| Quadrant | DetID | PixID | Counts | Sigma | Mean | Median | Sigma |
| A | 0 | 199 | 92303 | 610.06 | 743 | 730 | 150.1 |
| A | 15 | 234 | 26597 | 172.33 | 743 | 730 | 150.1 |
| A | 8 | 15 | 22436 | 144.61 | 743 | 730 | 150.1 |
| B | 15 | 204 | 76782 | 527.46 | 750 | 734 | 144.2 |
| B | 10 | 249 | 28235 | 190.74 | 750 | 734 | 144.2 |
| B | 4 | 81 | 22426 | 150.45 | 750 | 734 | 144.2 |
| C | 2 | 53 | 1033764 | 6304.76 | 705 | 710 | 163.9 |
| C | 14 | 67 | 14087 | 81.64 | 705 | 710 | 163.9 |
| C | 10 | 65 | 12774 | 73.63 | 705 | 710 | 163.9 |
| D | 8 | 112 | 215804 | 1274.21 | 705 | 685 | 168.8 |
| D | 2 | 32 | 44808 | 261.35 | 705 | 685 | 168.8 |
| D | 13 | 223 | 39287 | 228.65 | 705 | 685 | 168.8 |
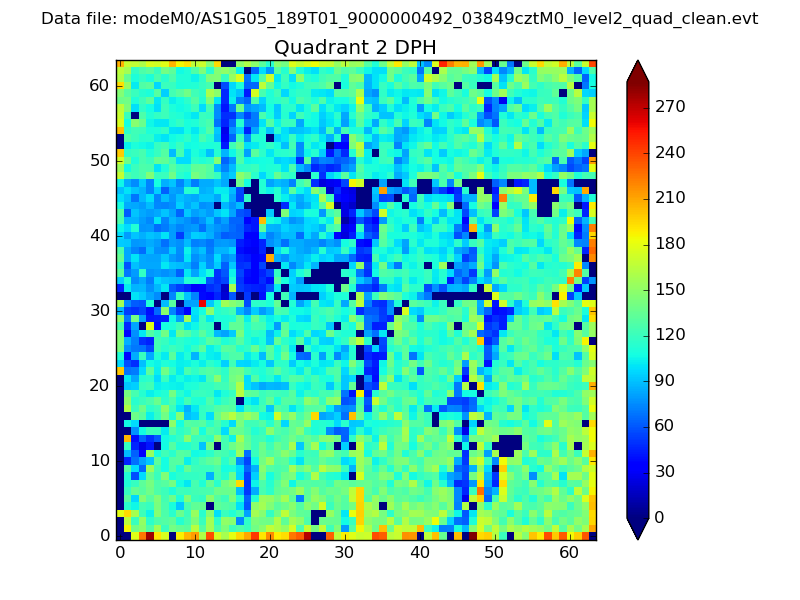
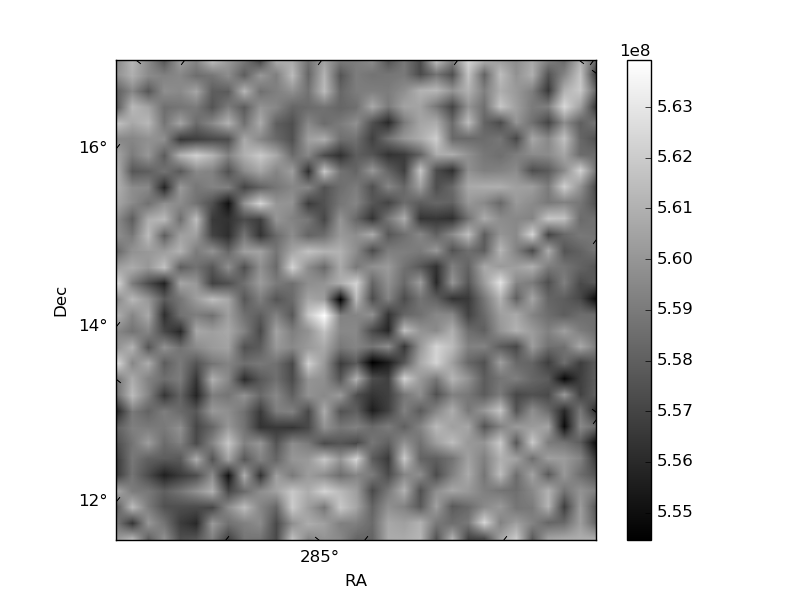
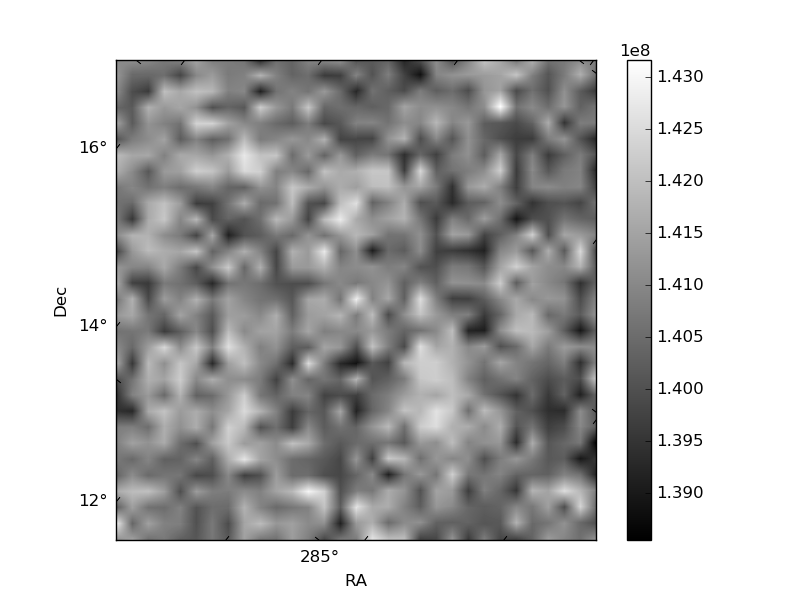
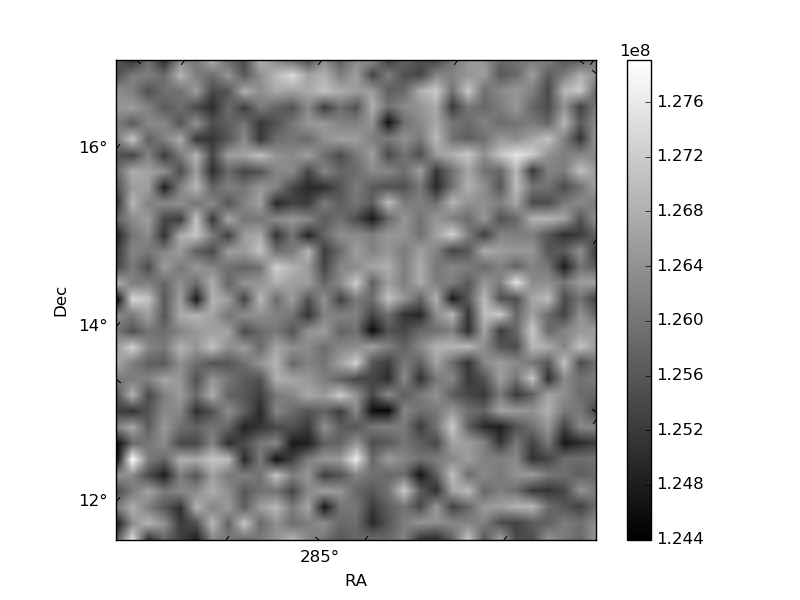
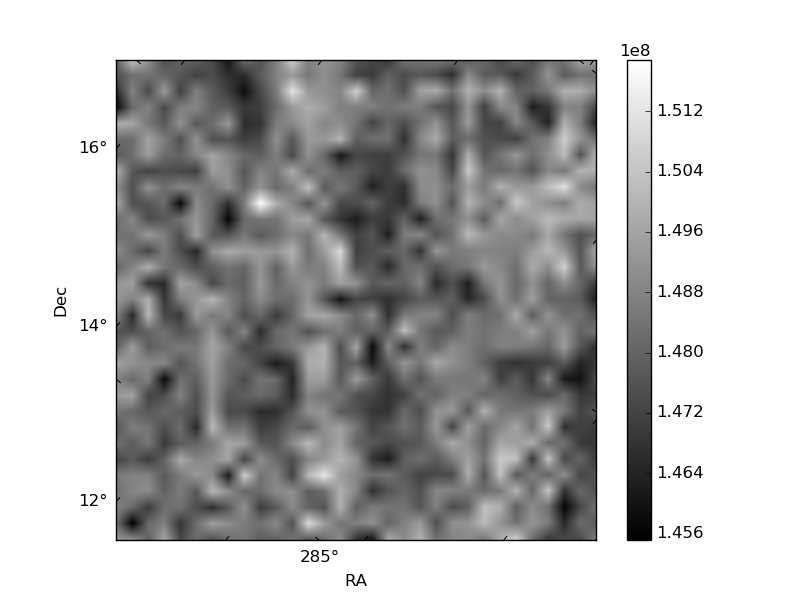
Histogram calculated using DETX and DETY for each event in the final _common_clean file
| Quadrant A | 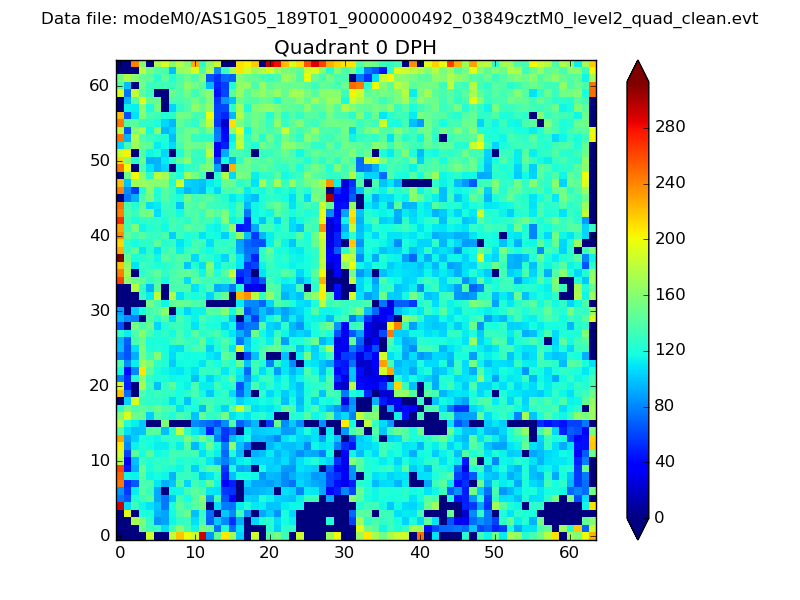 |
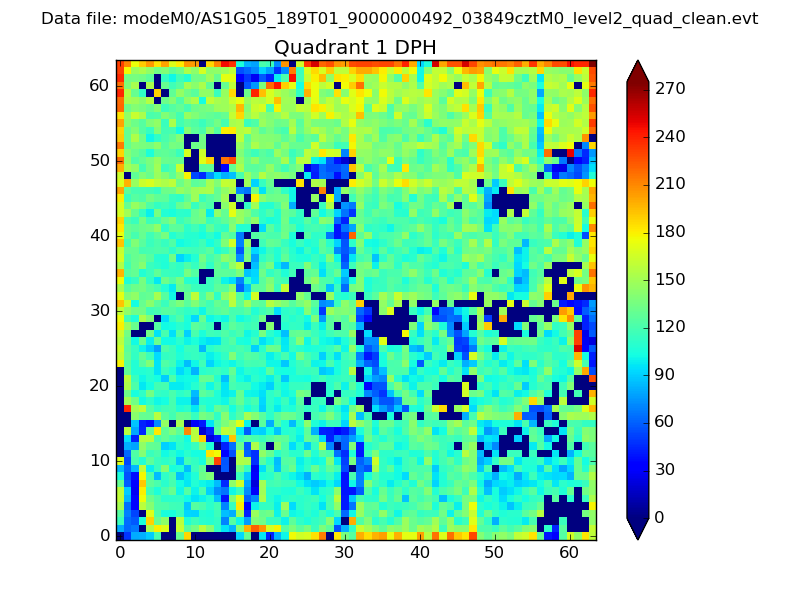 |
Quadrant B |
|---|---|---|---|
| Quadrant D | 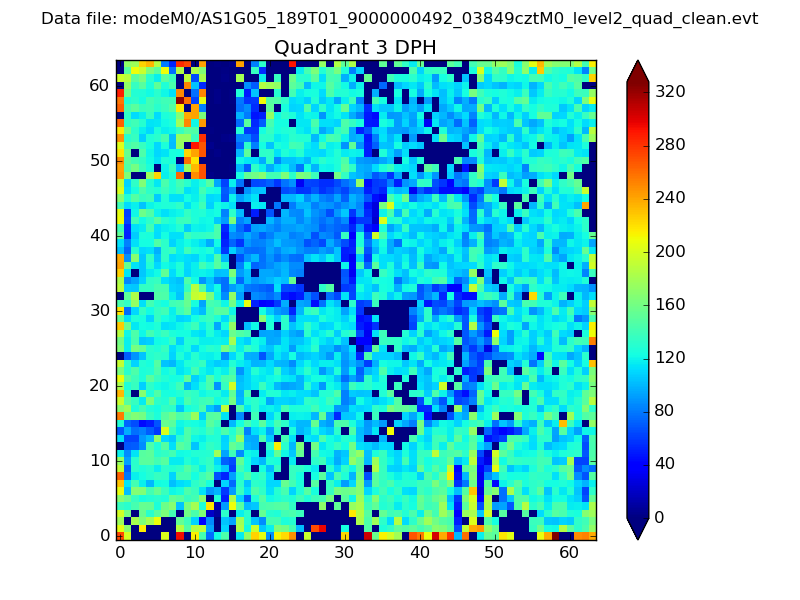 |
 |
Quadrant C |
| Plot type | Count rate plots | Images |
|---|---|---|
| Comparison with Poisson distribution Blue bars denote a histogram of data divided into 1 sec bins. Red curve is a Poisson curve with rate = median count rate of data. |
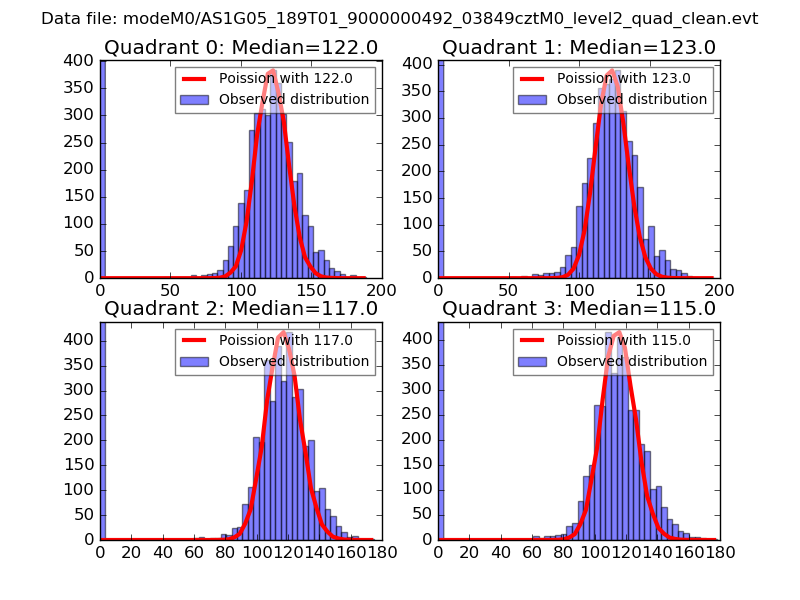 |
 |
| Quadrant-wise count rates Data is divided into 100 sec bins |
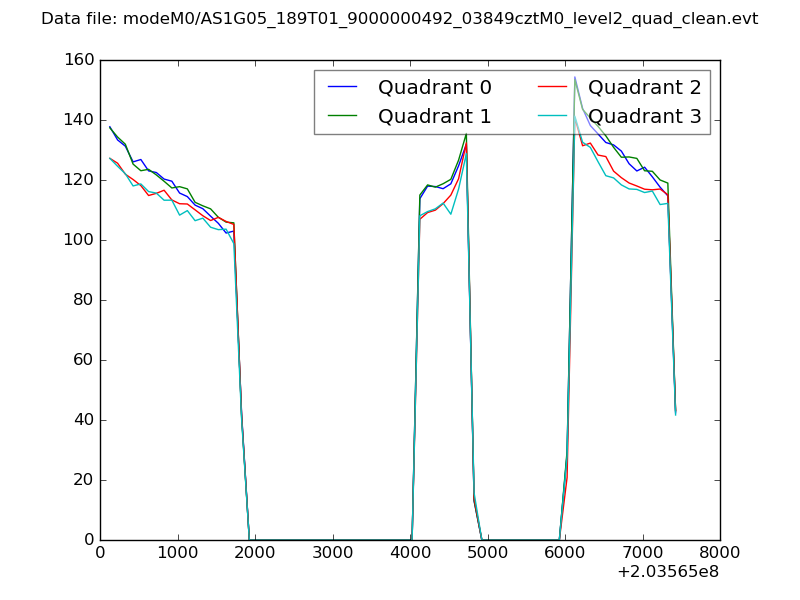 |
|
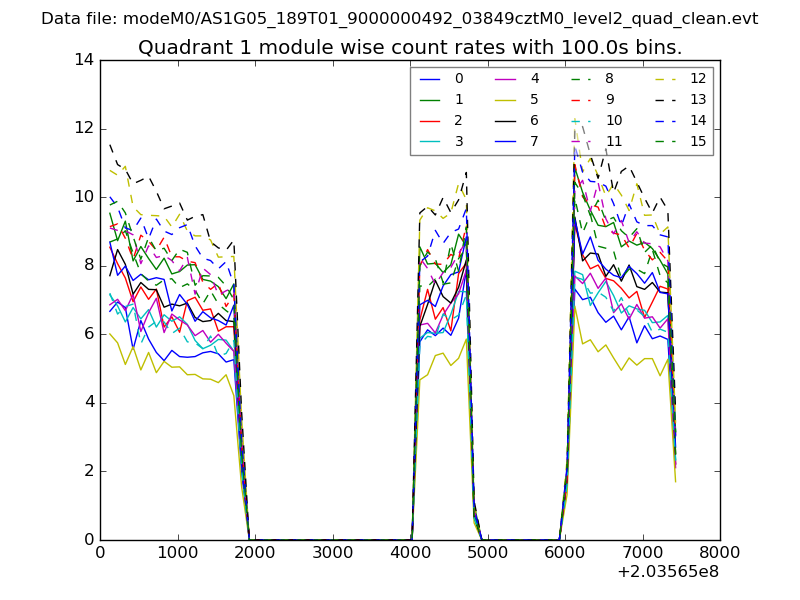
| Module-wise count rates for Quadrant A Data is divided into 100 sec bins |
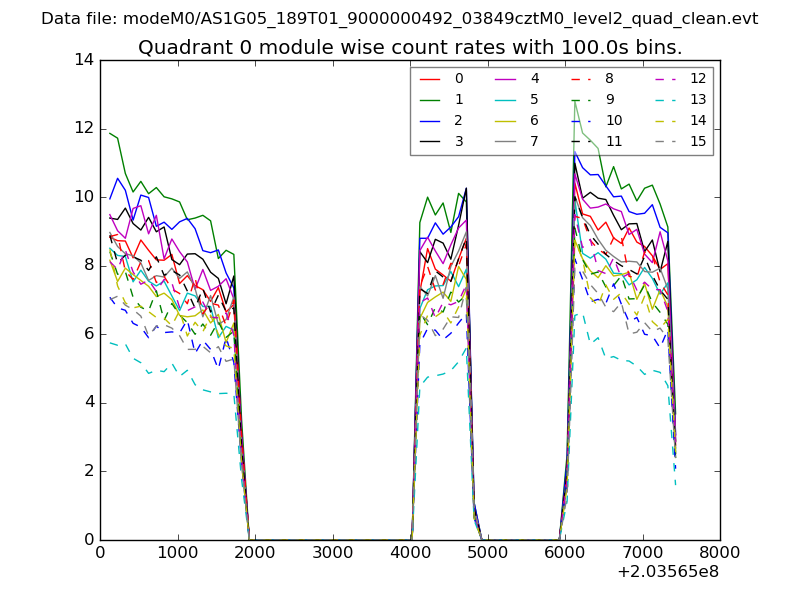 |
 |
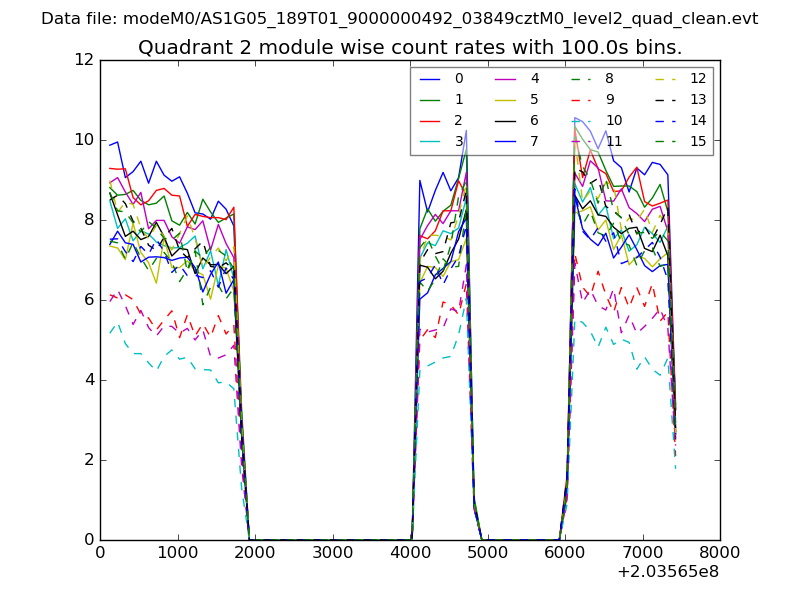
| Module-wise count rates for Quadrant B Data is divided into 100 sec bins |
 |
 |
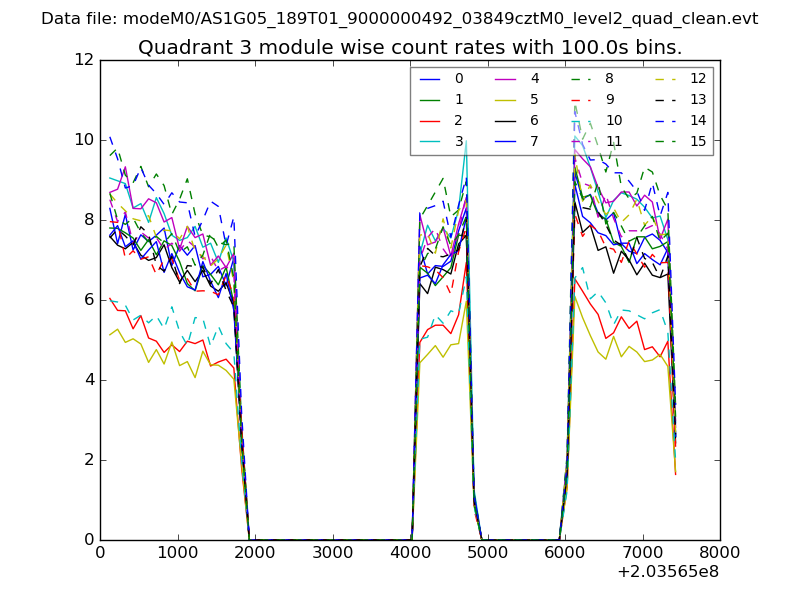
| Module-wise count rates for Quadrant C Data is divided into 100 sec bins |
 |
 |
| Module-wise count rates for Quadrant D Data is divided into 100 sec bins |
 |
 |
| Parameter | Plot |
|---|---|
| CZT HV Monitor | 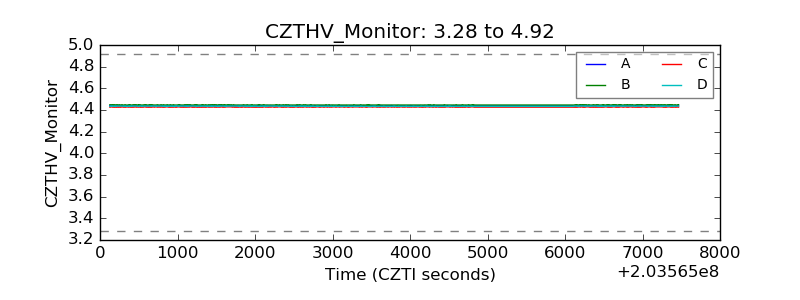 |
| D_VDD | 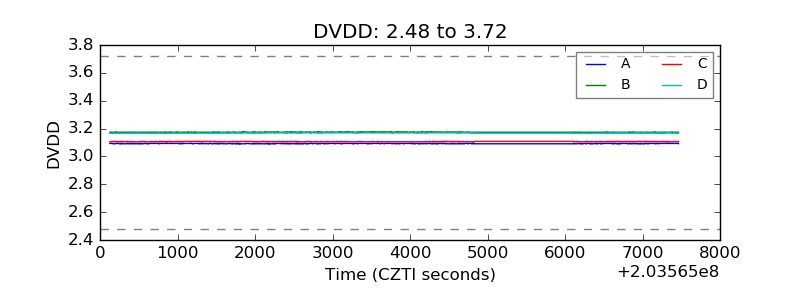 |
| Temperature 1 | 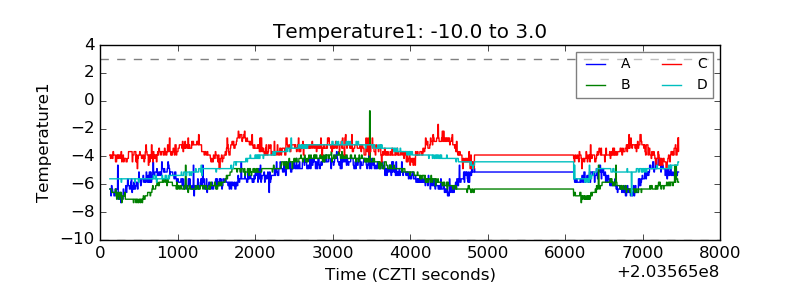 |
| Veto HV Monitor | 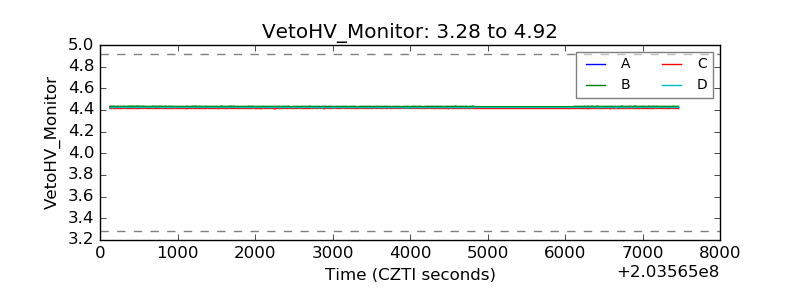 |
| Veto LLD | 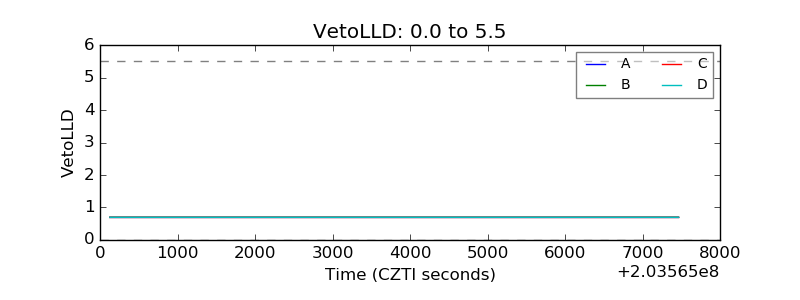 |
| Alpha Counter | 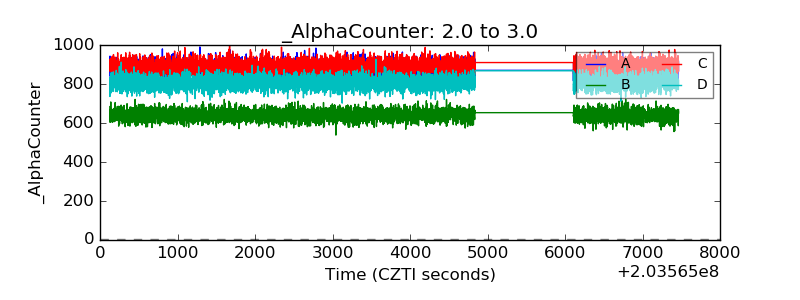 |
| _CPM_Rate | 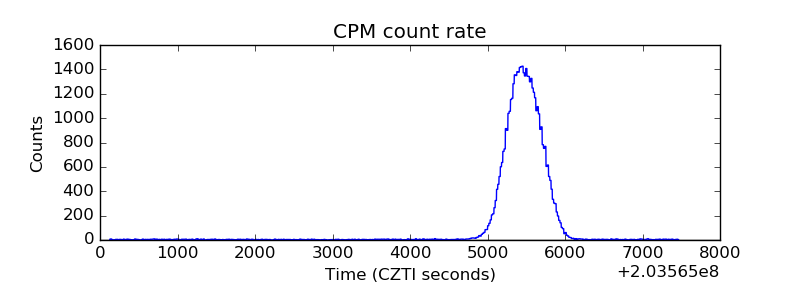 |
| CZT Counter | 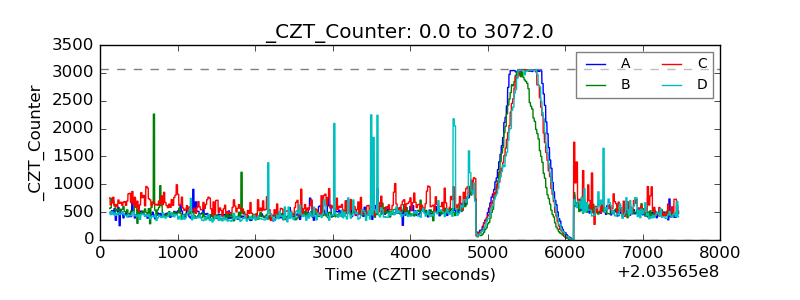 |
| +2.5 Volts monitor |  |
| +5 Volts monitor |  |
| Veto Counter | 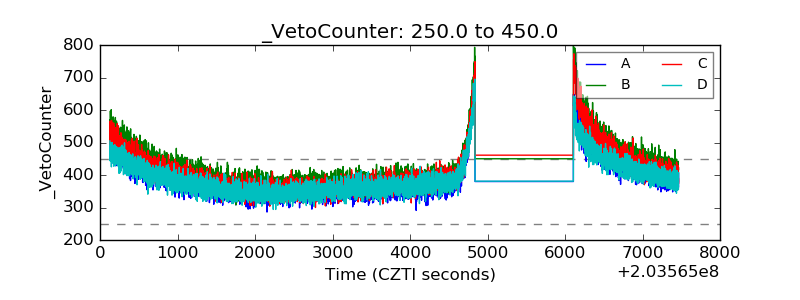 |