| Param | Original file | Final file |
|---|---|---|
| Filename | modeM0/AS1G05_189T01_9000000492_03850cztM0_level2.evt | modeM0/AS1G05_189T01_9000000492_03850cztM0_level2_quad_clean.evt |
| Size (bytes) | 426,948,480 | 72,181,440 |
| Size | 407.2 MB | 68.8 MB |
| Events in quadrant A | 3,118,218 | 447,795 |
| Events in quadrant B | 3,247,988 | 452,704 |
| Events in quadrant C | 3,160,566 | 432,686 |
| Events in quadrant D | 2,984,856 | 422,545 |
| Mode M0 | |||
|---|---|---|---|
| Quadrant | BADHDUFLAG | Total packets | Discarded packets |
| A | 0 | 12955 | 2 |
| B | 0 | 13373 | 1 |
| C | 0 | 13543 | 1 |
| D | 0 | 13133 | 1 |
| Mode M9 | |||
|---|---|---|---|
| Quadrant | BADHDUFLAG | Total packets | Discarded packets |
| A | 0 | 13 | 0 |
| B | 0 | 13 | 0 |
| C | 0 | 13 | 0 |
| D | 0 | 13 | 0 |
| Mode SS | |||
|---|---|---|---|
| Quadrant | BADHDUFLAG | Total packets | Discarded packets |
| A | 0 | 126 | 0 |
| B | 0 | 126 | 0 |
| C | 0 | 126 | 0 |
| D | 0 | 126 | 0 |
| Quadrant | Total seconds | Saturated seconds | Saturation percentage |
|---|---|---|---|
| A | 6156 | 58 | 0.942170% |
| B | 6156 | 63 | 1.023392% |
| C | 6156 | 40 | 0.649773% |
| D | 6156 | 25 | 0.406108% |
Noise dominated data is calculated using 1-second bins in cleaned event files. If a bin has >2000 counts, and if more than 50% of those come from <1% of pixels, then it is considered to be noise-dominated and hence unusable.
| Quadrant | # 1 sec bins | Bins with >0 counts | Bins with >2000 counts | High rate bins dominated by noise | Noise dominated (total time) | Noise dominated (detector-on time) | Marked lightcurve |
|---|---|---|---|---|---|---|---|
| A | 7441 | 6156 | 1 | 1 | 0.01% | 0.02% | 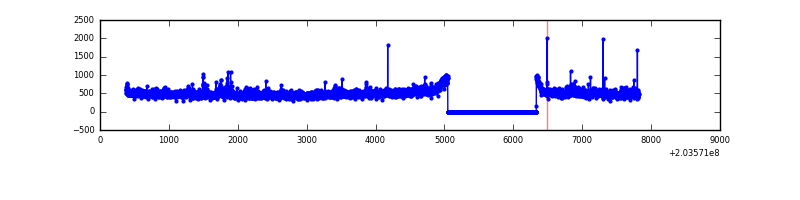 |
| B | 7441 | 6156 | 1 | 1 | 0.01% | 0.02% | 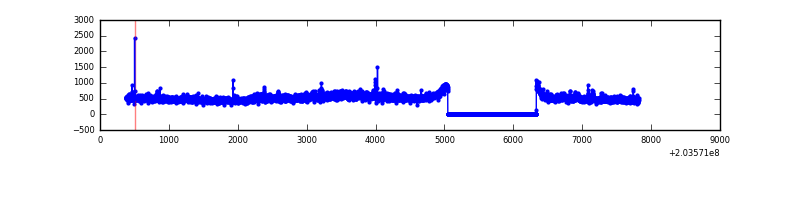 |
| C | 7441 | 6156 | 2 | 2 | 0.03% | 0.03% | 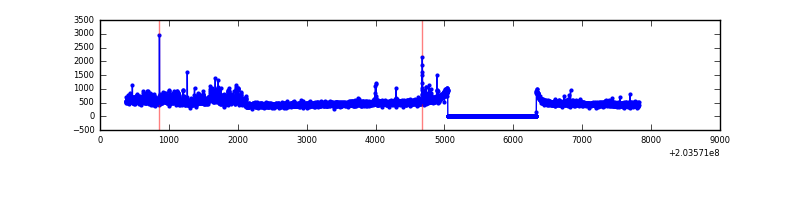 |
| D | 7441 | 6157 | 10 | 10 | 0.13% | 0.16% | 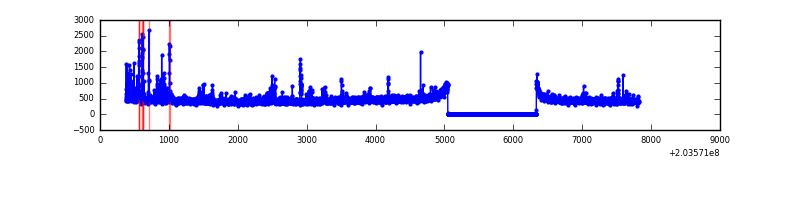 |
Top three noisy pixels from each quadrant. If the there are fewer than three noisy pixels in the level2.evt file, extra rows are filled as -1
| Pixel properties | Quadrant properties | ||||||
|---|---|---|---|---|---|---|---|
| Quadrant | DetID | PixID | Counts | Sigma | Mean | Median | Sigma |
| A | 5 | 143 | 61833 | 397.09 | 761 | 747 | 153.8 |
| A | 8 | 15 | 54037 | 346.41 | 761 | 747 | 153.8 |
| A | 15 | 234 | 32858 | 208.74 | 761 | 747 | 153.8 |
| B | 0 | 244 | 145383 | 979.77 | 766 | 750 | 147.6 |
| B | 15 | 204 | 96024 | 645.4 | 766 | 750 | 147.6 |
| B | 14 | 167 | 21770 | 142.39 | 766 | 750 | 147.6 |
| C | 2 | 53 | 293383 | 1741.07 | 722 | 725 | 168.1 |
| C | 9 | 247 | 25673 | 148.42 | 722 | 725 | 168.1 |
| C | 10 | 65 | 11253 | 62.63 | 722 | 725 | 168.1 |
| D | 8 | 112 | 143637 | 810.75 | 725 | 704 | 176.3 |
| D | 2 | 32 | 43610 | 243.37 | 725 | 704 | 176.3 |
| D | 13 | 248 | 32389 | 179.73 | 725 | 704 | 176.3 |
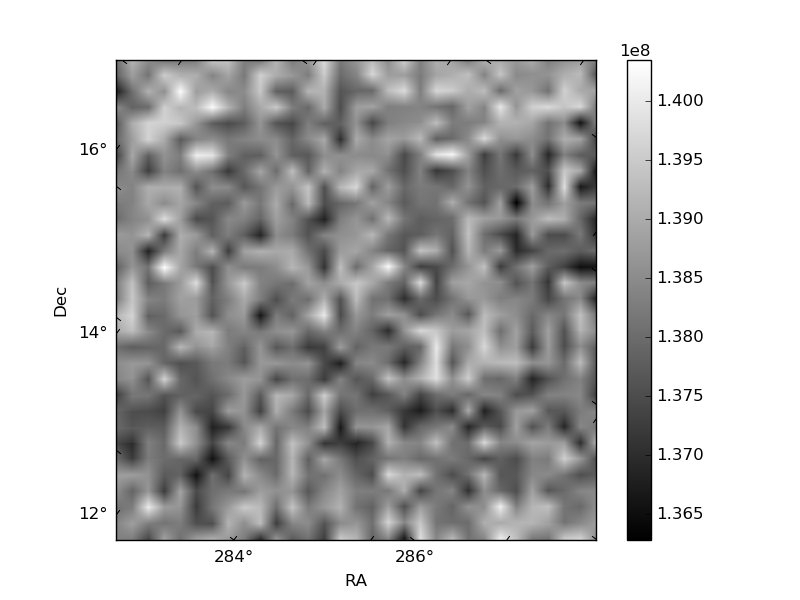
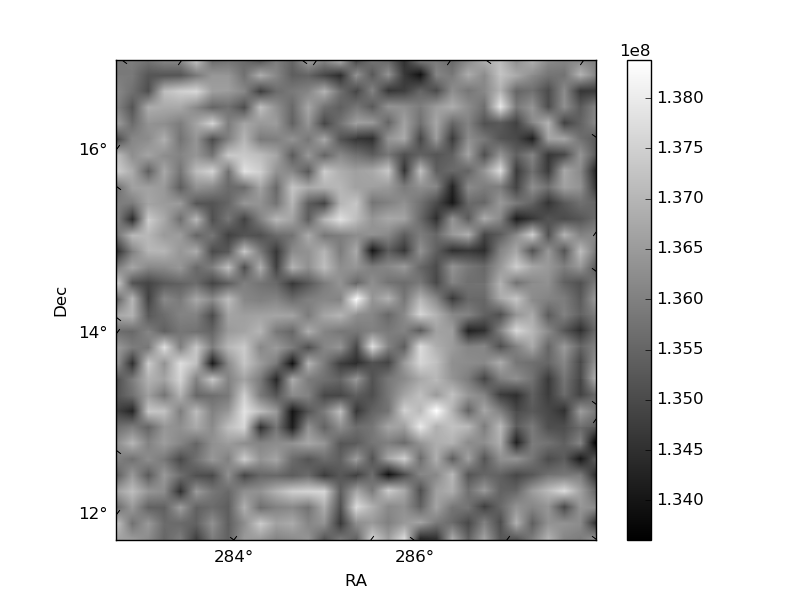
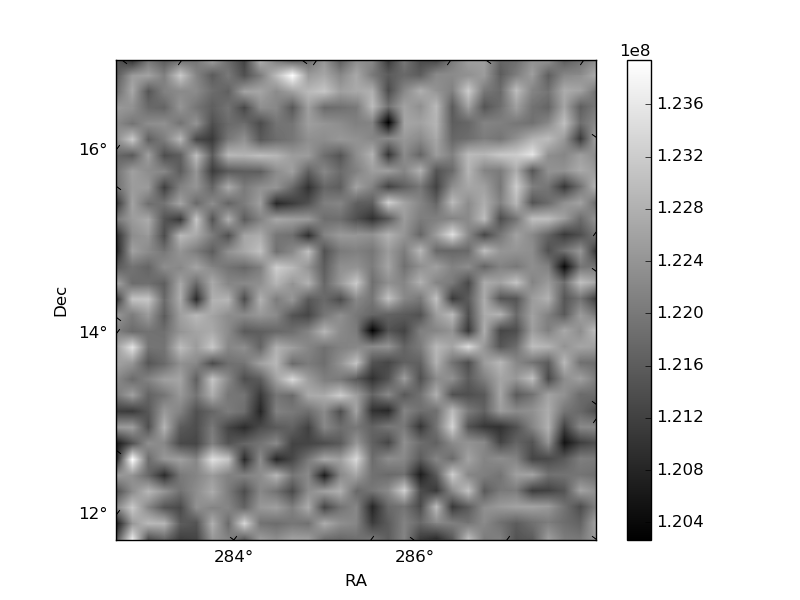
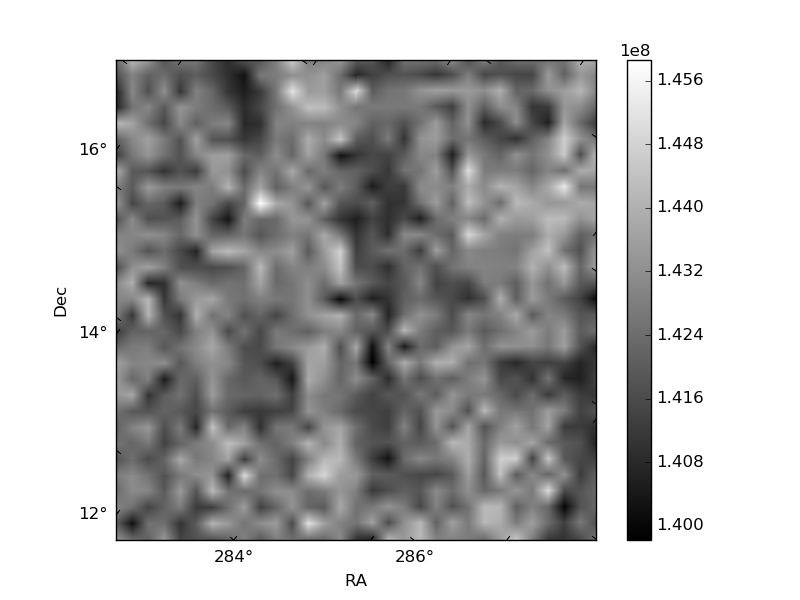
Histogram calculated using DETX and DETY for each event in the final _common_clean file
| Quadrant A | 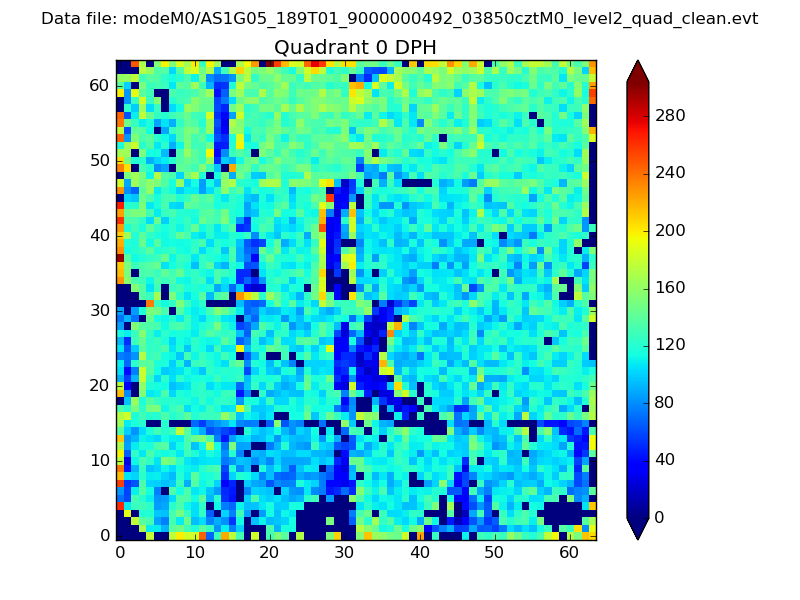 |
 |
Quadrant B |
|---|---|---|---|
| Quadrant D |  |
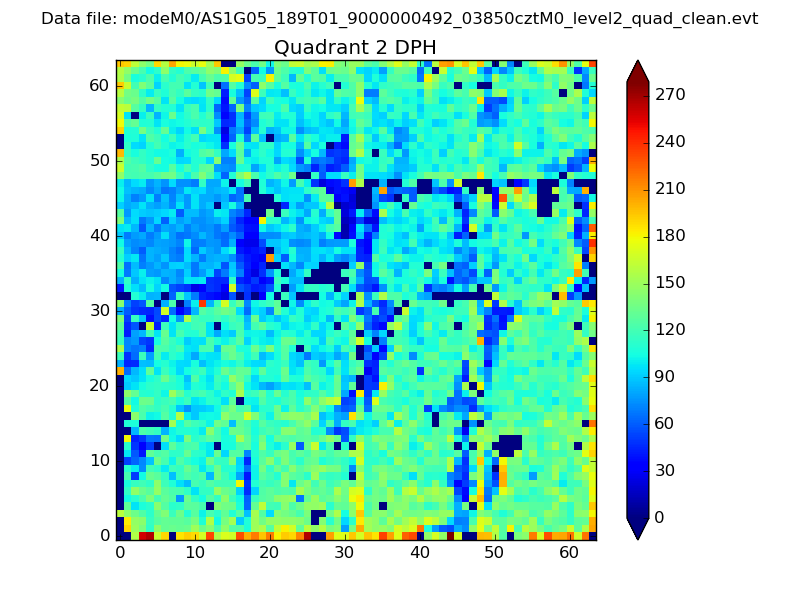 |
Quadrant C |
| Plot type | Count rate plots | Images |
|---|---|---|
| Comparison with Poisson distribution Blue bars denote a histogram of data divided into 1 sec bins. Red curve is a Poisson curve with rate = median count rate of data. |
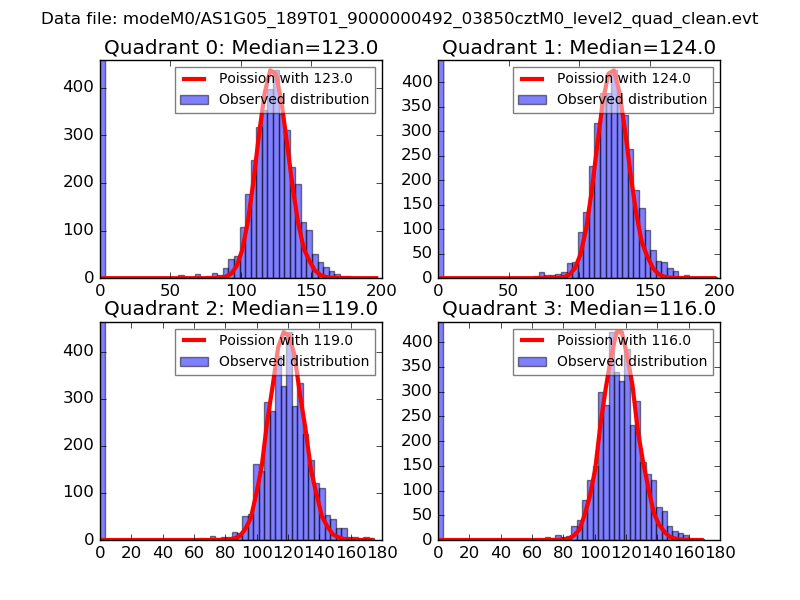 |
 |
| Quadrant-wise count rates Data is divided into 100 sec bins |
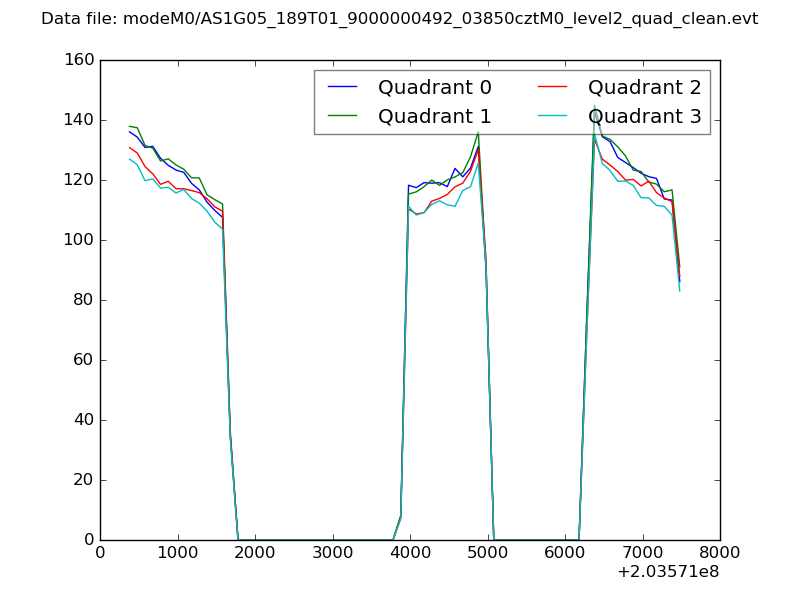 |
|
| Module-wise count rates for Quadrant A Data is divided into 100 sec bins |
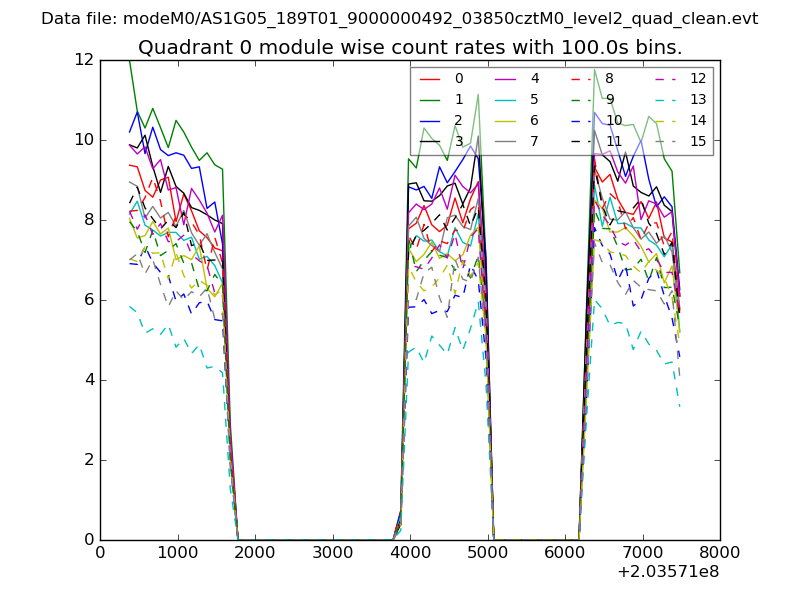 |
 |
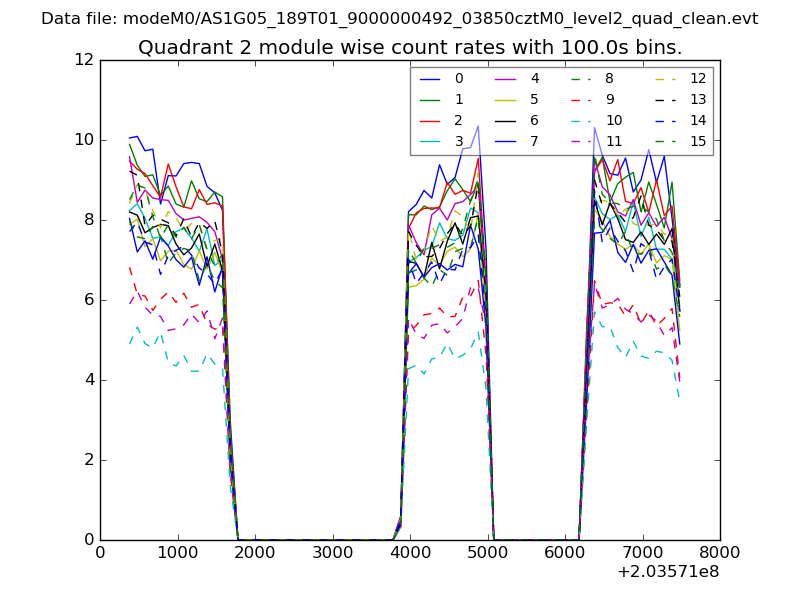
| Module-wise count rates for Quadrant B Data is divided into 100 sec bins |
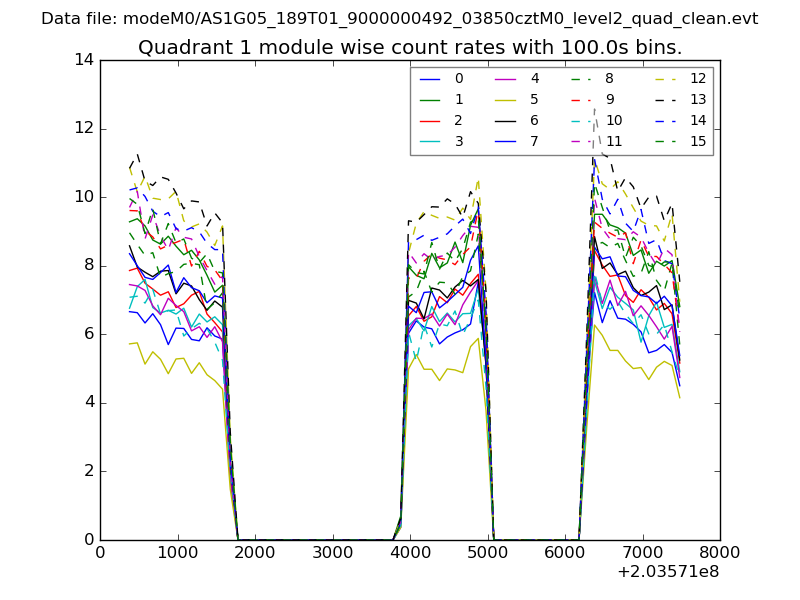 |
 |
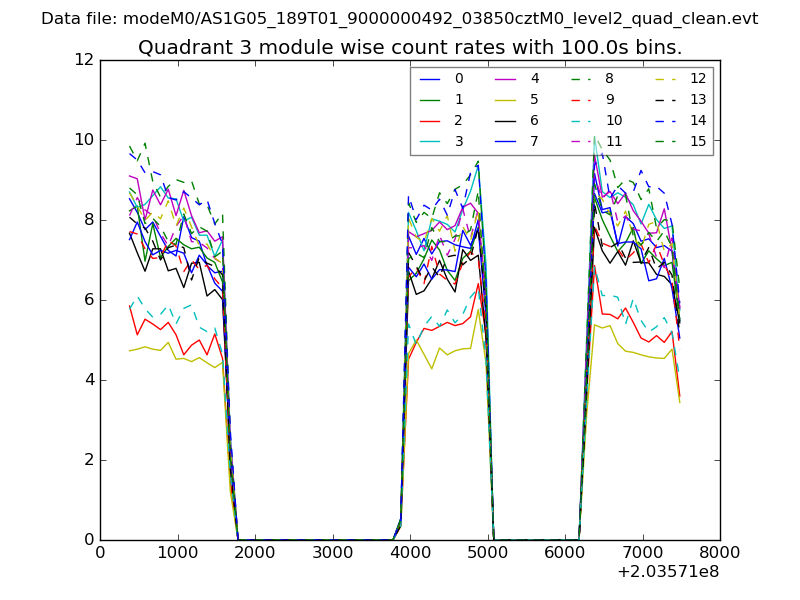
| Module-wise count rates for Quadrant C Data is divided into 100 sec bins |
 |
 |
| Module-wise count rates for Quadrant D Data is divided into 100 sec bins |
 |
 |
| Parameter | Plot |
|---|---|
| CZT HV Monitor | 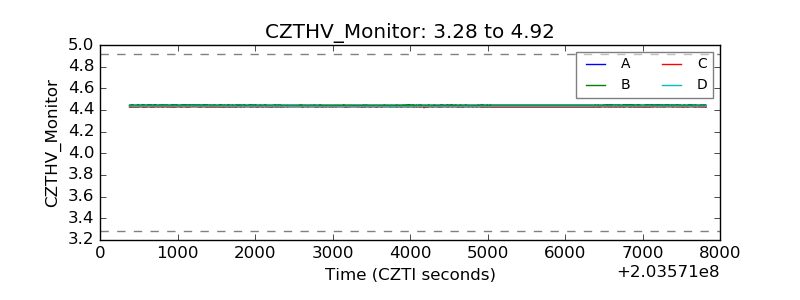 |
| D_VDD | 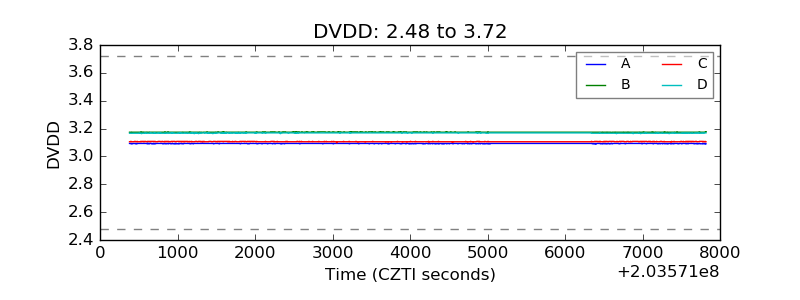 |
| Temperature 1 | 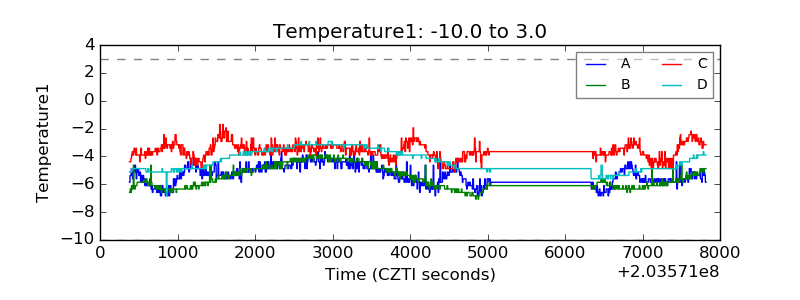 |
| Veto HV Monitor | 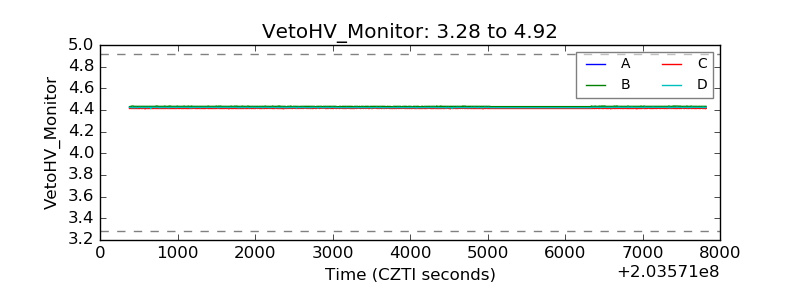 |
| Veto LLD | 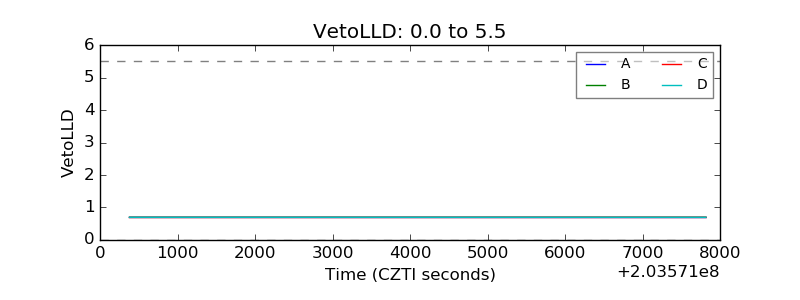 |
| Alpha Counter | 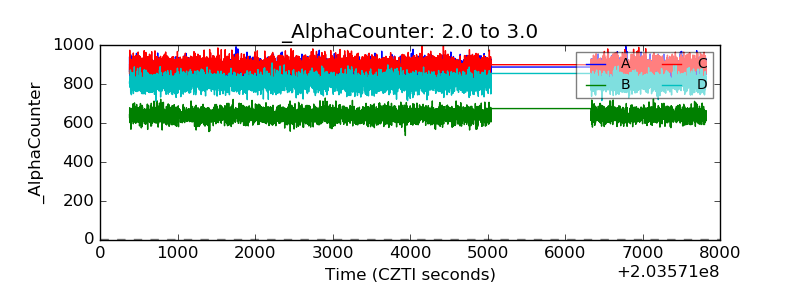 |
| _CPM_Rate | 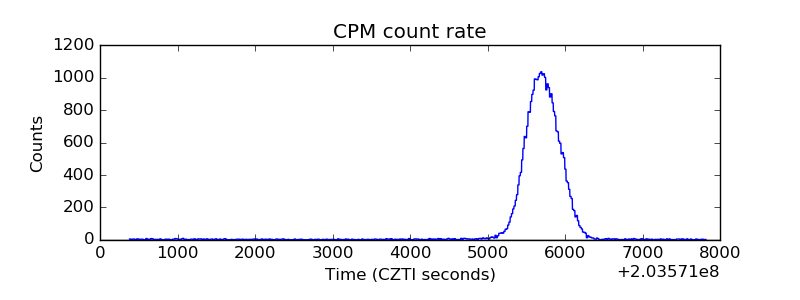 |
| CZT Counter | 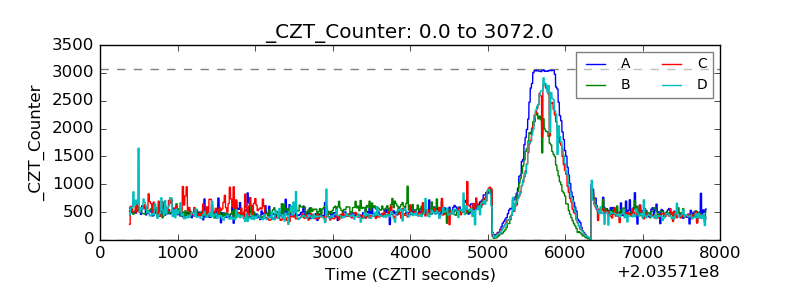 |
| +2.5 Volts monitor |  |
| +5 Volts monitor |  |
| Veto Counter | 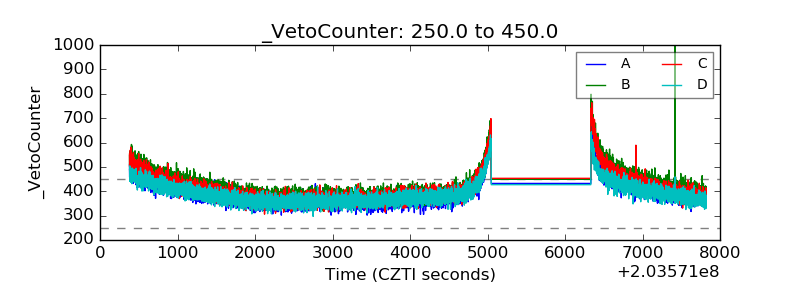 |