| Param | Original file | Final file |
|---|---|---|
| Filename | modeM0/AS1G05_189T01_9000000492_03851cztM0_level2.evt | modeM0/AS1G05_189T01_9000000492_03851cztM0_level2_quad_clean.evt |
| Size (bytes) | 409,129,920 | 64,198,080 |
| Size | 390.2 MB | 61.2 MB |
| Events in quadrant A | 3,153,641 | 383,031 |
| Events in quadrant B | 3,094,130 | 387,105 |
| Events in quadrant C | 2,841,446 | 374,200 |
| Events in quadrant D | 2,878,400 | 365,449 |
| Mode M0 | |||
|---|---|---|---|
| Quadrant | BADHDUFLAG | Total packets | Discarded packets |
| A | 0 | 13284 | 2 |
| B | 0 | 13004 | 1 |
| C | 0 | 12767 | 1 |
| D | 0 | 13028 | 1 |
| Mode M9 | |||
|---|---|---|---|
| Quadrant | BADHDUFLAG | Total packets | Discarded packets |
| A | 0 | 12 | 0 |
| B | 0 | 12 | 0 |
| C | 0 | 12 | 0 |
| D | 0 | 12 | 0 |
| Mode SS | |||
|---|---|---|---|
| Quadrant | BADHDUFLAG | Total packets | Discarded packets |
| A | 0 | 128 | 0 |
| B | 0 | 128 | 0 |
| C | 0 | 128 | 0 |
| D | 0 | 128 | 0 |
| Quadrant | Total seconds | Saturated seconds | Saturation percentage |
|---|---|---|---|
| A | 6210 | 65 | 1.046699% |
| B | 6210 | 76 | 1.223833% |
| C | 6210 | 30 | 0.483092% |
| D | 6210 | 33 | 0.531401% |
Noise dominated data is calculated using 1-second bins in cleaned event files. If a bin has >2000 counts, and if more than 50% of those come from <1% of pixels, then it is considered to be noise-dominated and hence unusable.
| Quadrant | # 1 sec bins | Bins with >0 counts | Bins with >2000 counts | High rate bins dominated by noise | Noise dominated (total time) | Noise dominated (detector-on time) | Marked lightcurve |
|---|---|---|---|---|---|---|---|
| A | 7425 | 6210 | 1 | 1 | 0.01% | 0.02% | 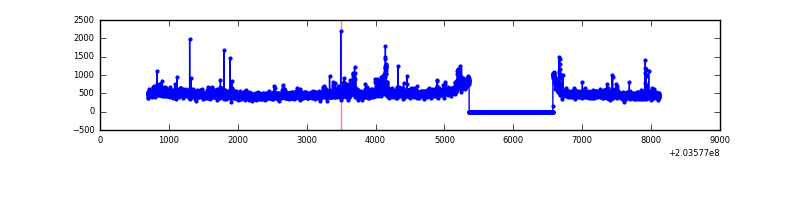 |
| B | 7425 | 6210 | 0 | 0 | 0.00% | 0.00% | 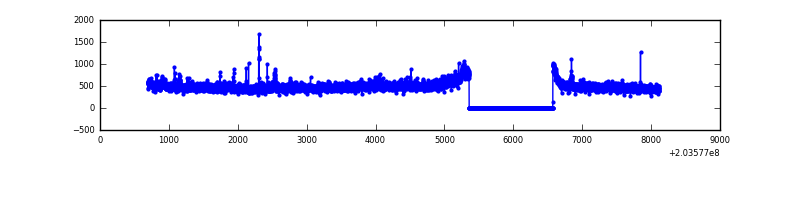 |
| C | 7425 | 6210 | 0 | 0 | 0.00% | 0.00% |  |
| D | 7425 | 6211 | 7 | 7 | 0.09% | 0.11% | 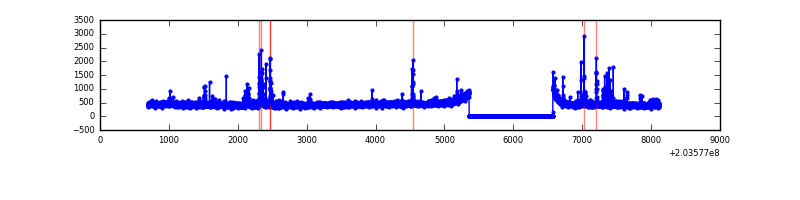 |
Top three noisy pixels from each quadrant. If the there are fewer than three noisy pixels in the level2.evt file, extra rows are filled as -1
| Pixel properties | Quadrant properties | ||||||
|---|---|---|---|---|---|---|---|
| Quadrant | DetID | PixID | Counts | Sigma | Mean | Median | Sigma |
| A | 15 | 234 | 126671 | 826.4 | 755 | 741 | 152.4 |
| A | 5 | 143 | 50681 | 327.72 | 755 | 741 | 152.4 |
| A | 8 | 15 | 39172 | 252.2 | 755 | 741 | 152.4 |
| B | 15 | 204 | 121497 | 814.22 | 760 | 742 | 148.3 |
| B | 4 | 81 | 24063 | 157.25 | 760 | 742 | 148.3 |
| B | 12 | 111 | 13100 | 83.32 | 760 | 742 | 148.3 |
| C | 9 | 247 | 13408 | 75.23 | 719 | 722 | 168.6 |
| C | 10 | 65 | 7556 | 40.53 | 719 | 722 | 168.6 |
| C | 13 | 61 | 6090 | 31.83 | 719 | 722 | 168.6 |
| D | 13 | 223 | 58286 | 324.57 | 721 | 702 | 177.4 |
| D | 13 | 248 | 40867 | 226.39 | 721 | 702 | 177.4 |
| D | 2 | 32 | 26607 | 146.01 | 721 | 702 | 177.4 |
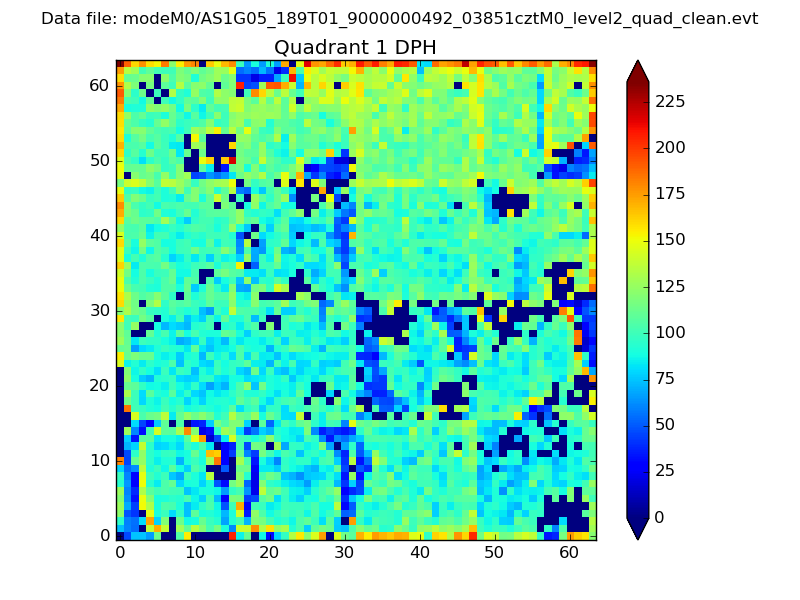
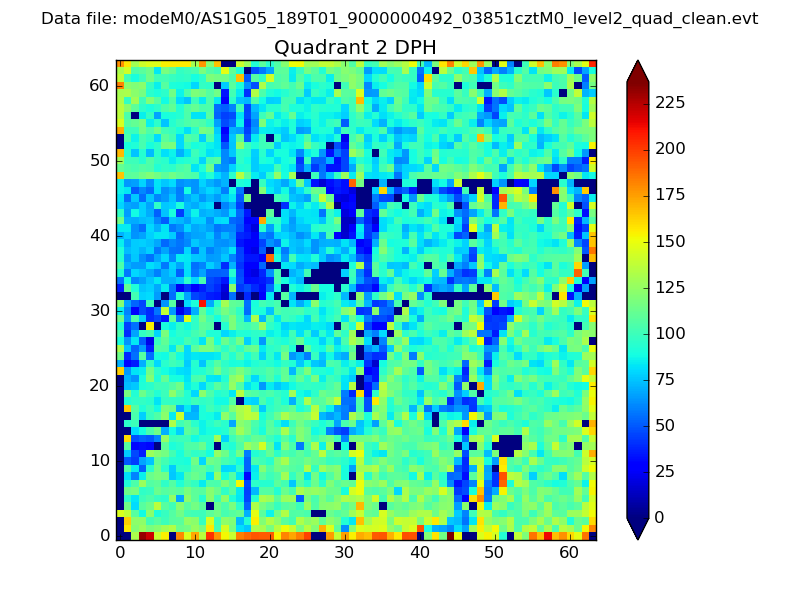
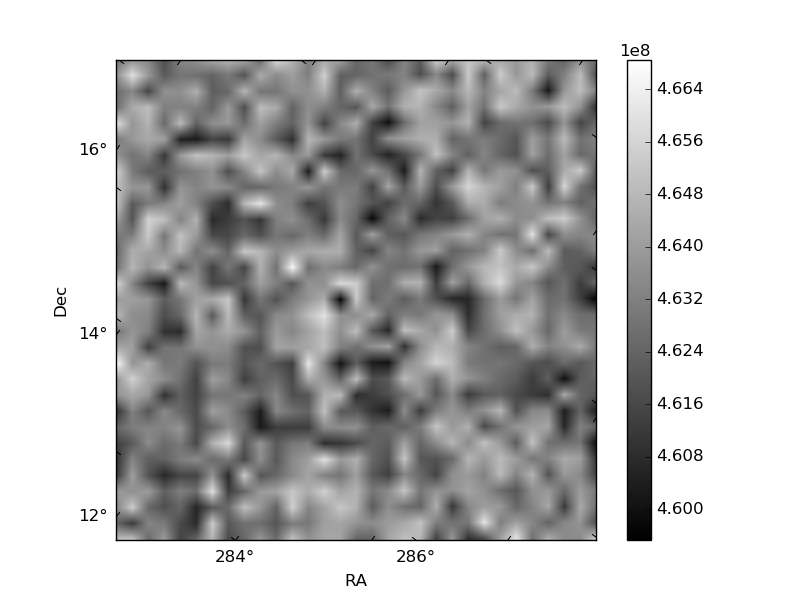
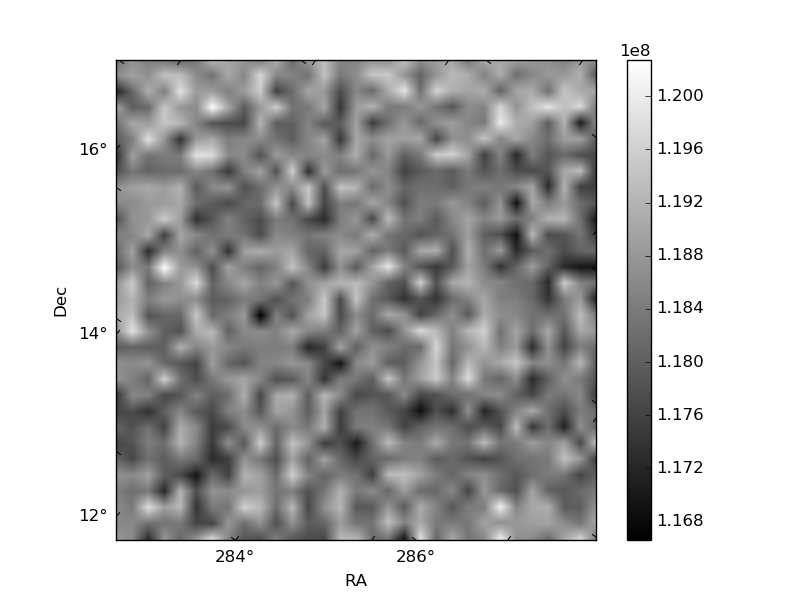
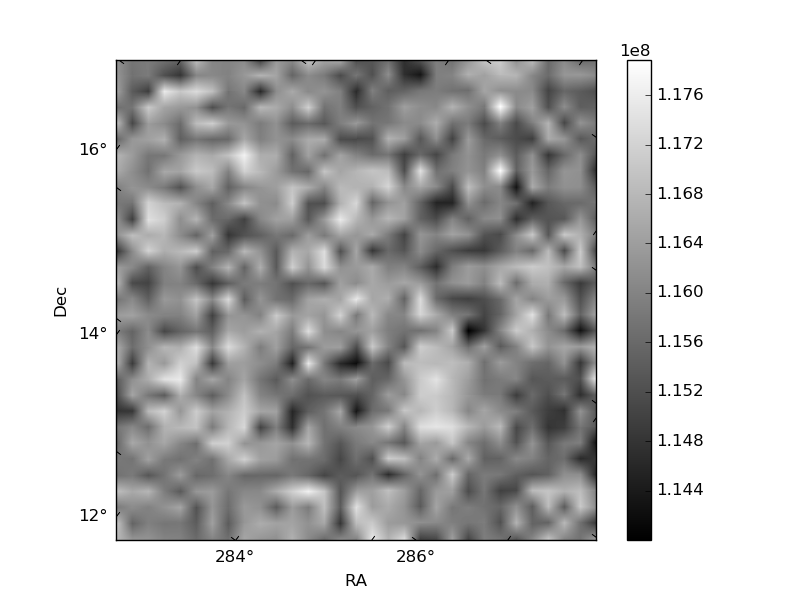
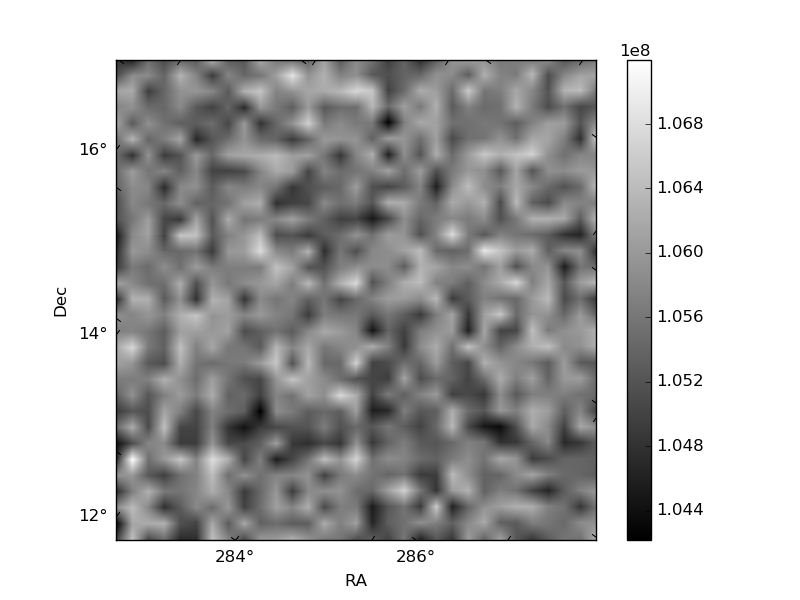
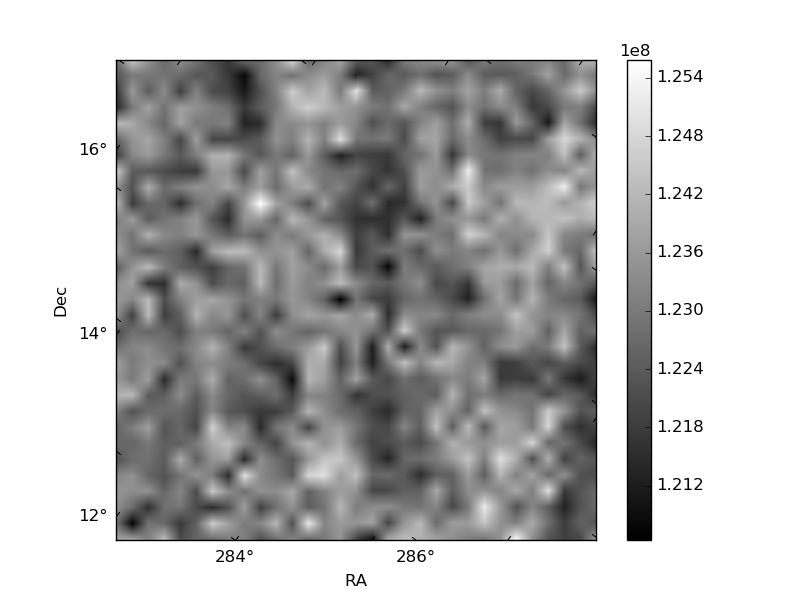
Histogram calculated using DETX and DETY for each event in the final _common_clean file
| Quadrant A | 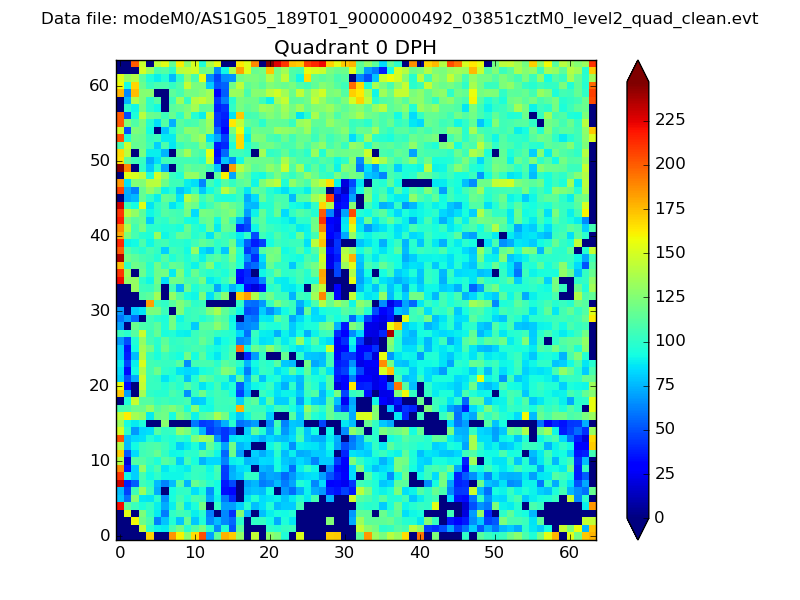 |
 |
Quadrant B |
|---|---|---|---|
| Quadrant D | 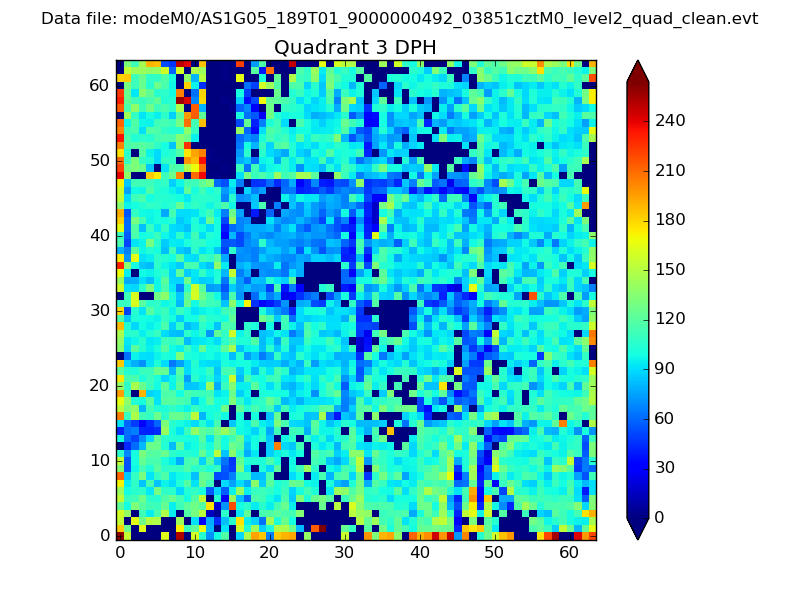 |
 |
Quadrant C |
| Plot type | Count rate plots | Images |
|---|---|---|
| Comparison with Poisson distribution Blue bars denote a histogram of data divided into 1 sec bins. Red curve is a Poisson curve with rate = median count rate of data. |
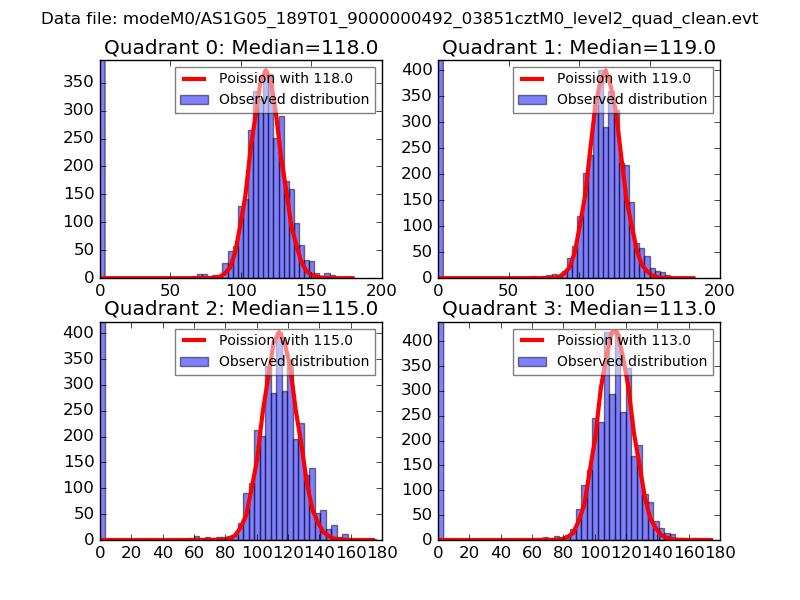 |
 |
| Quadrant-wise count rates Data is divided into 100 sec bins |
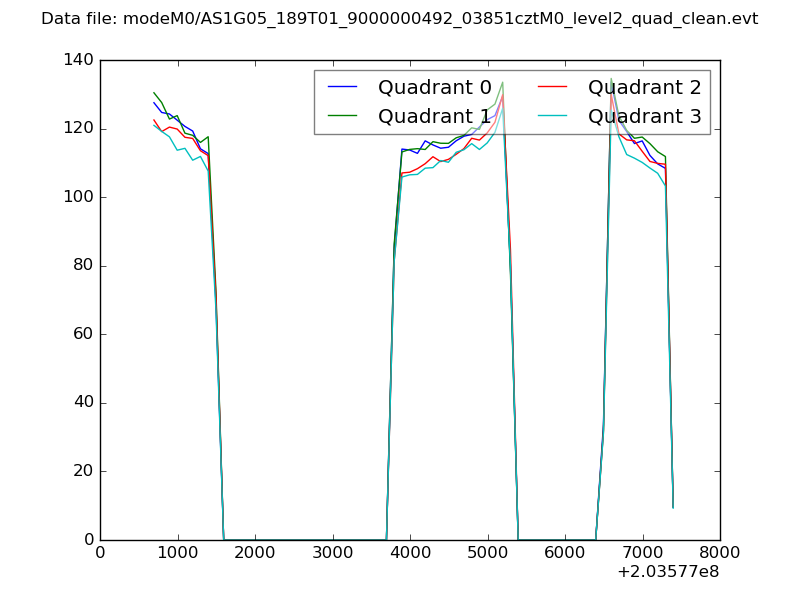 |
|
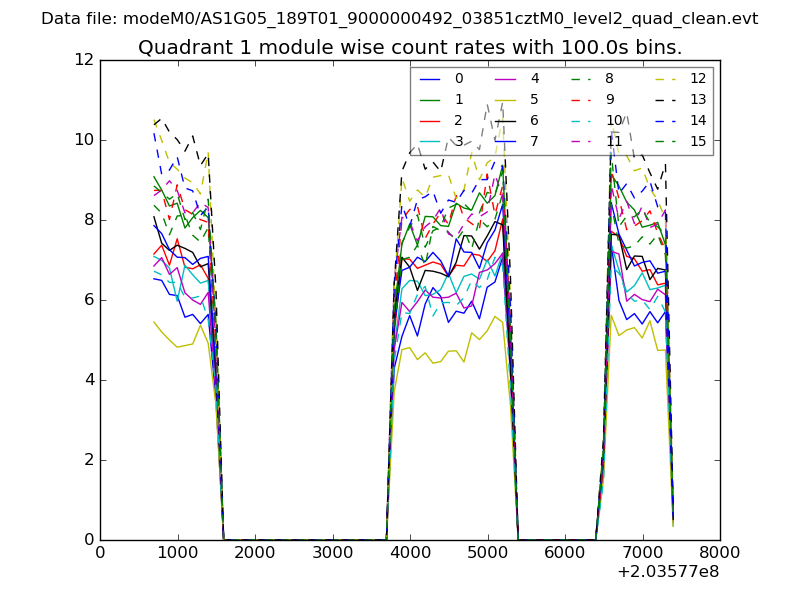
| Module-wise count rates for Quadrant A Data is divided into 100 sec bins |
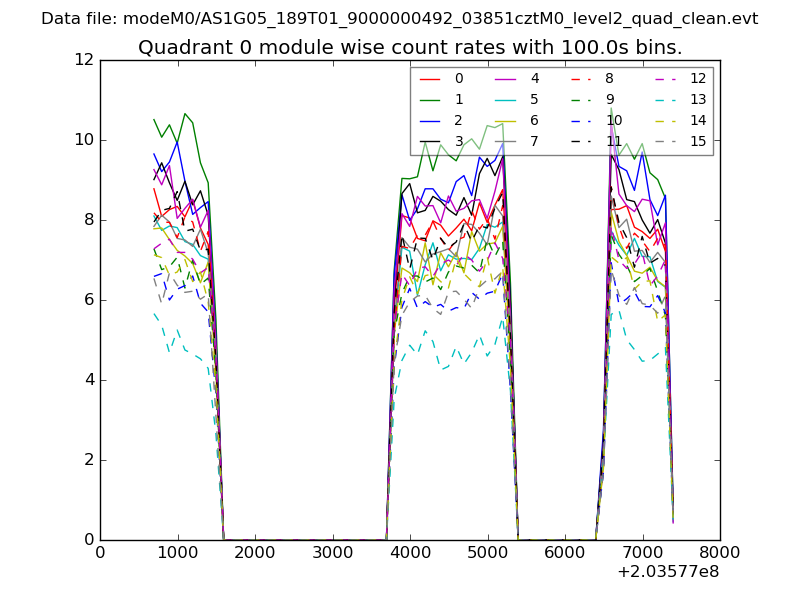 |
 |
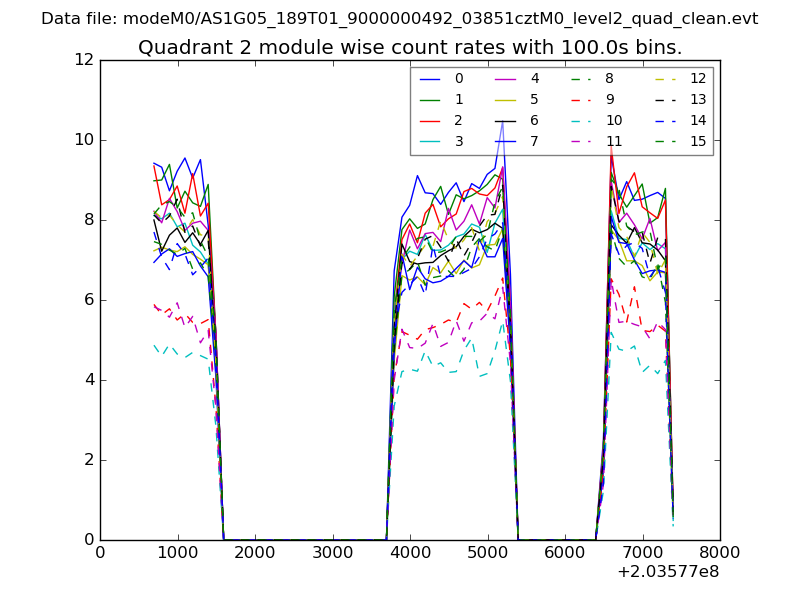
| Module-wise count rates for Quadrant B Data is divided into 100 sec bins |
 |
 |
| Module-wise count rates for Quadrant C Data is divided into 100 sec bins |
 |
 |
| Module-wise count rates for Quadrant D Data is divided into 100 sec bins |
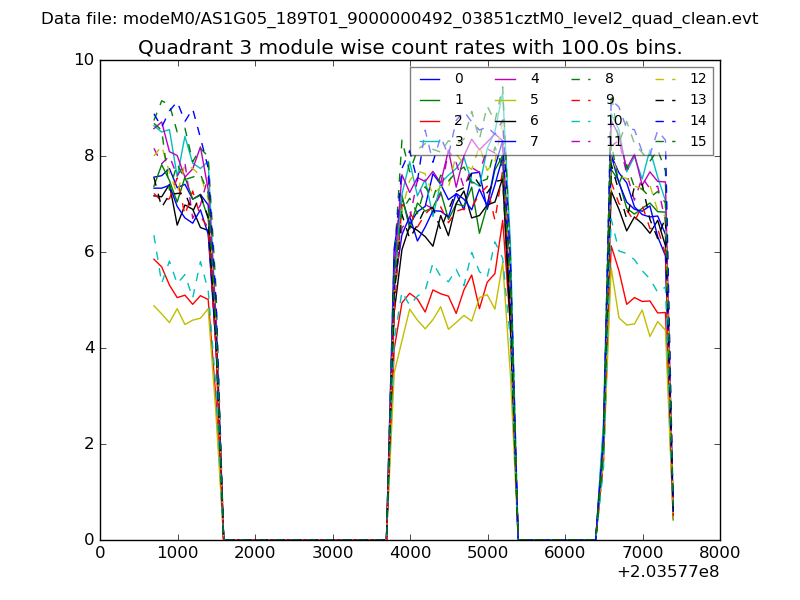 |
 |
| Parameter | Plot |
|---|---|
| CZT HV Monitor | 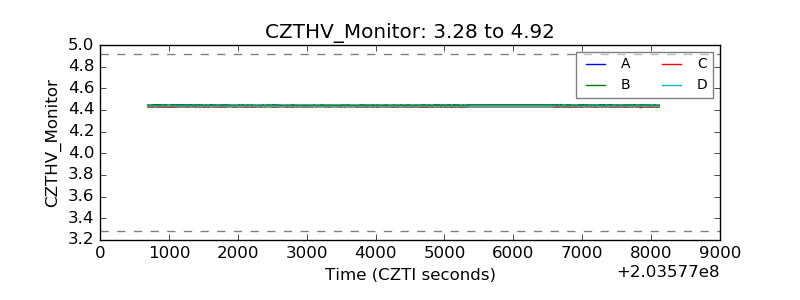 |
| D_VDD | 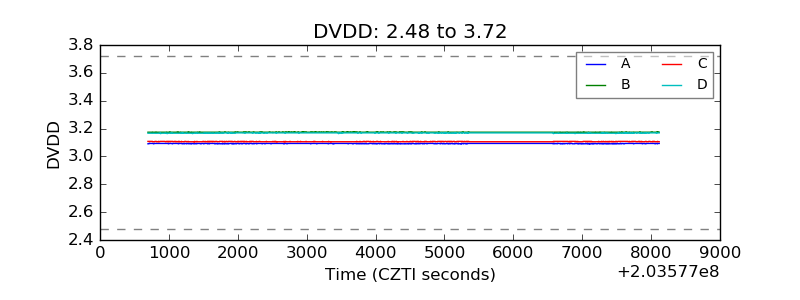 |
| Temperature 1 | 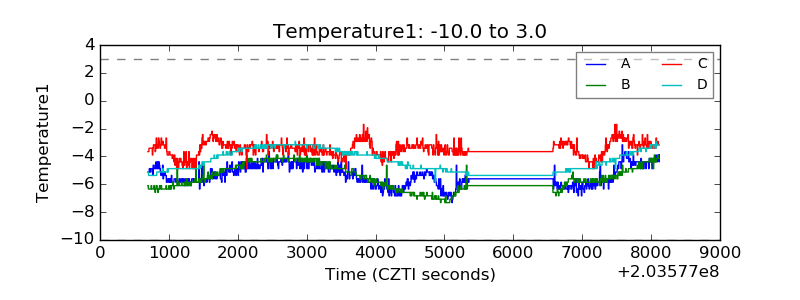 |
| Veto HV Monitor | 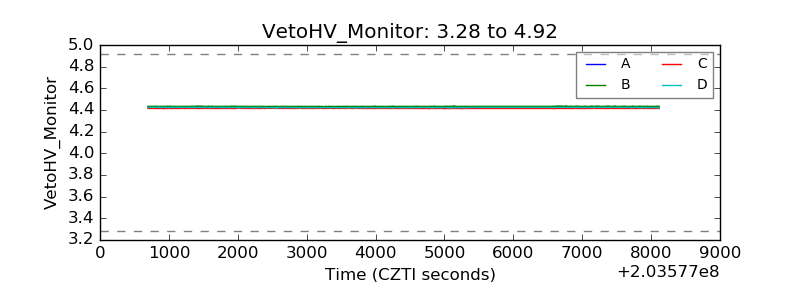 |
| Veto LLD | 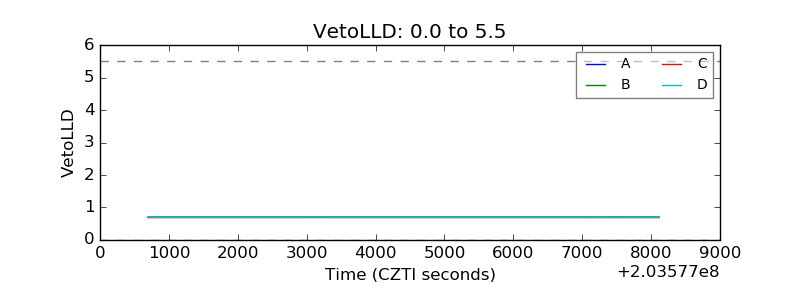 |
| Alpha Counter | 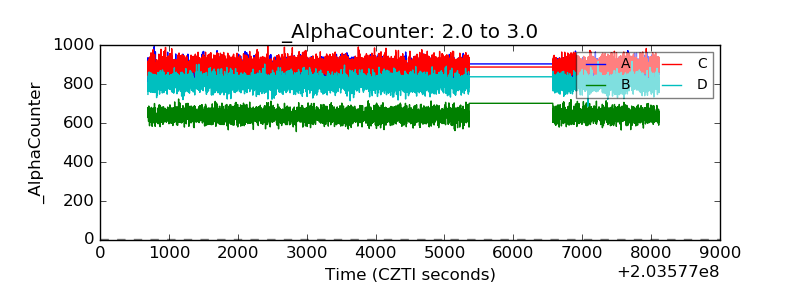 |
| _CPM_Rate |  |
| CZT Counter | 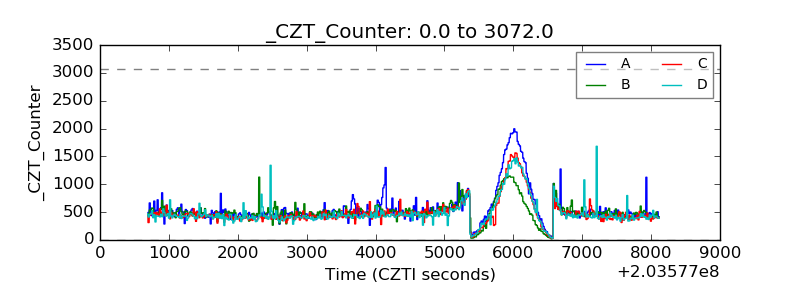 |
| +2.5 Volts monitor |  |
| +5 Volts monitor | 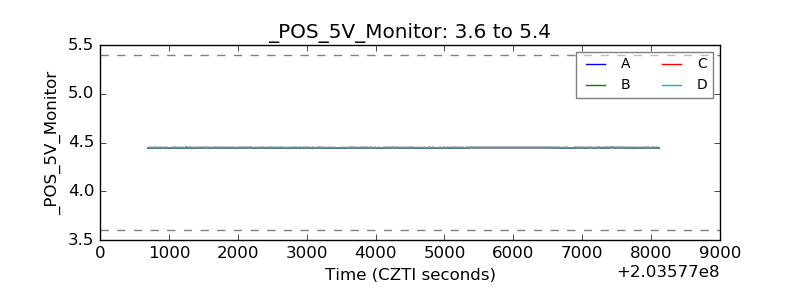 |
| Veto Counter | 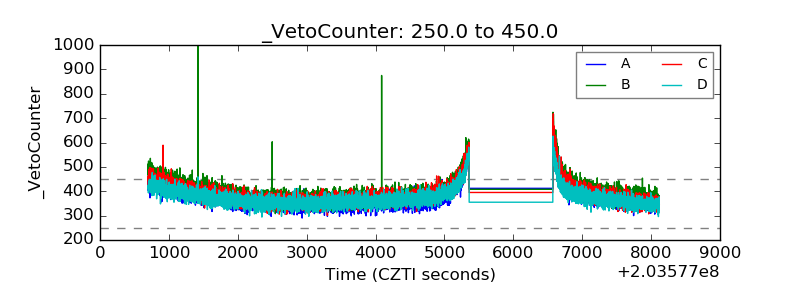 |