| Param | Original file | Final file |
|---|---|---|
| Filename | modeM0/AS1G05_189T01_9000000492_03852cztM0_level2.evt | modeM0/AS1G05_189T01_9000000492_03852cztM0_level2_quad_clean.evt |
| Size (bytes) | 405,414,720 | 58,533,120 |
| Size | 386.6 MB | 55.8 MB |
| Events in quadrant A | 3,080,268 | 339,492 |
| Events in quadrant B | 2,996,811 | 341,653 |
| Events in quadrant C | 2,806,697 | 333,425 |
| Events in quadrant D | 2,969,653 | 321,985 |
| Mode M0 | |||
|---|---|---|---|
| Quadrant | BADHDUFLAG | Total packets | Discarded packets |
| A | 0 | 13194 | 2 |
| B | 0 | 12873 | 1 |
| C | 0 | 12789 | 1 |
| D | 0 | 13405 | 1 |
| Mode M9 | |||
|---|---|---|---|
| Quadrant | BADHDUFLAG | Total packets | Discarded packets |
| A | 0 | 10 | 0 |
| B | 0 | 10 | 0 |
| C | 0 | 10 | 0 |
| D | 0 | 10 | 0 |
| Mode SS | |||
|---|---|---|---|
| Quadrant | BADHDUFLAG | Total packets | Discarded packets |
| A | 0 | 126 | 0 |
| B | 0 | 126 | 0 |
| C | 0 | 126 | 0 |
| D | 0 | 126 | 0 |
| Quadrant | Total seconds | Saturated seconds | Saturation percentage |
|---|---|---|---|
| A | 6241 | 114 | 1.826630% |
| B | 6241 | 107 | 1.714469% |
| C | 6241 | 74 | 1.185707% |
| D | 6241 | 105 | 1.682423% |
Noise dominated data is calculated using 1-second bins in cleaned event files. If a bin has >2000 counts, and if more than 50% of those come from <1% of pixels, then it is considered to be noise-dominated and hence unusable.
| Quadrant | # 1 sec bins | Bins with >0 counts | Bins with >2000 counts | High rate bins dominated by noise | Noise dominated (total time) | Noise dominated (detector-on time) | Marked lightcurve |
|---|---|---|---|---|---|---|---|
| A | 7206 | 6241 | 8 | 8 | 0.11% | 0.13% | 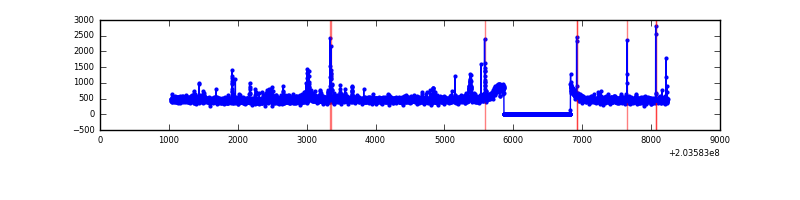 |
| B | 7206 | 6241 | 2 | 2 | 0.03% | 0.03% | 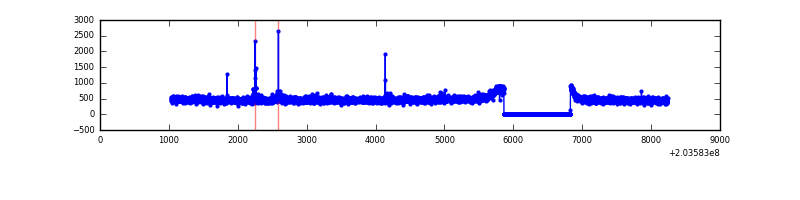 |
| C | 7206 | 6241 | 0 | 0 | 0.00% | 0.00% | 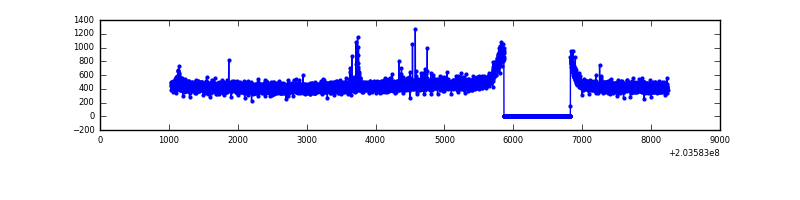 |
| D | 7206 | 6241 | 20 | 20 | 0.28% | 0.32% | 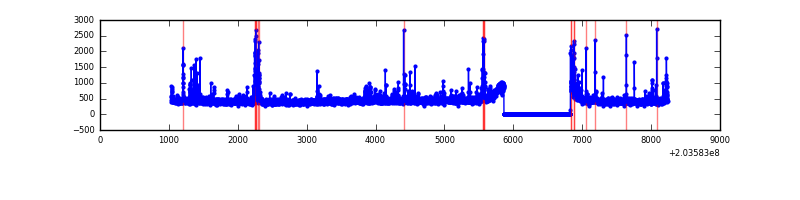 |
Top three noisy pixels from each quadrant. If the there are fewer than three noisy pixels in the level2.evt file, extra rows are filled as -1
| Pixel properties | Quadrant properties | ||||||
|---|---|---|---|---|---|---|---|
| Quadrant | DetID | PixID | Counts | Sigma | Mean | Median | Sigma |
| A | 15 | 234 | 144100 | 953.07 | 741 | 725 | 150.4 |
| A | 8 | 15 | 44228 | 289.18 | 741 | 725 | 150.4 |
| A | 13 | 251 | 36560 | 238.21 | 741 | 725 | 150.4 |
| B | 15 | 204 | 79383 | 538.82 | 747 | 731 | 146.0 |
| B | 0 | 244 | 20341 | 134.34 | 747 | 731 | 146.0 |
| B | 12 | 111 | 13084 | 84.63 | 747 | 731 | 146.0 |
| C | 9 | 247 | 16978 | 97.41 | 711 | 714 | 167.0 |
| C | 2 | 53 | 8488 | 46.56 | 711 | 714 | 167.0 |
| C | 13 | 61 | 6207 | 32.9 | 711 | 714 | 167.0 |
| D | 2 | 32 | 98243 | 555.17 | 714 | 693 | 175.7 |
| D | 13 | 223 | 51756 | 290.6 | 714 | 693 | 175.7 |
| D | 13 | 248 | 50919 | 285.84 | 714 | 693 | 175.7 |
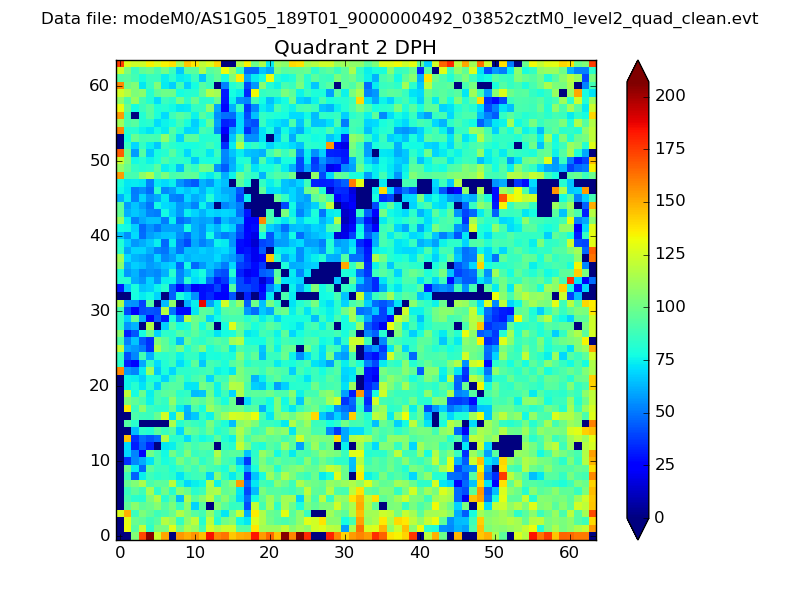
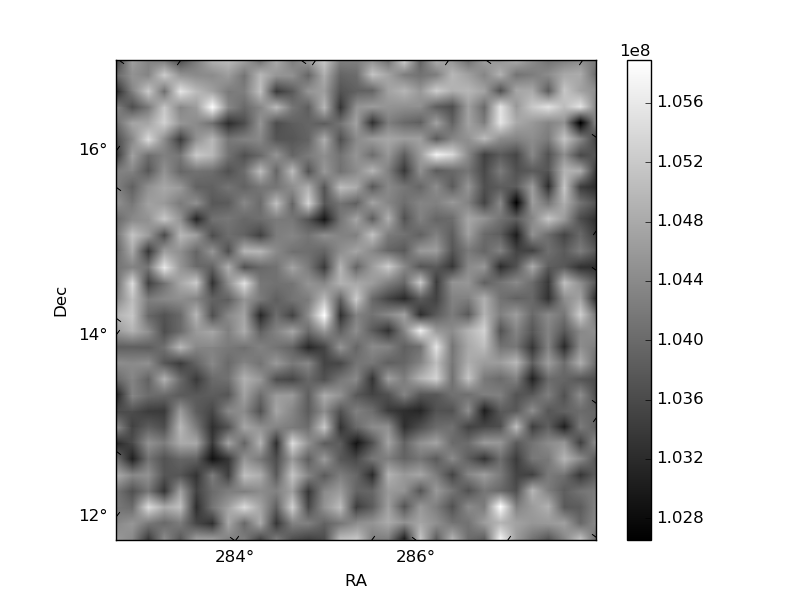
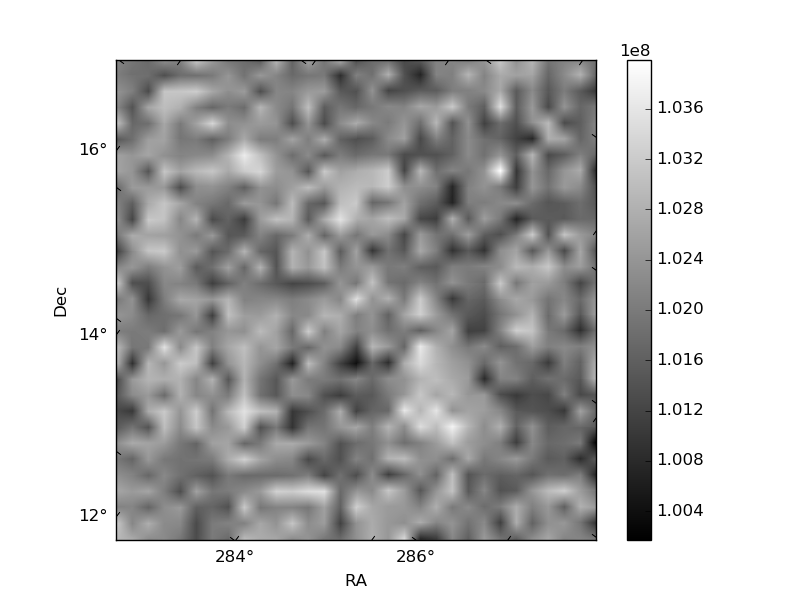
Histogram calculated using DETX and DETY for each event in the final _common_clean file
| Quadrant A | 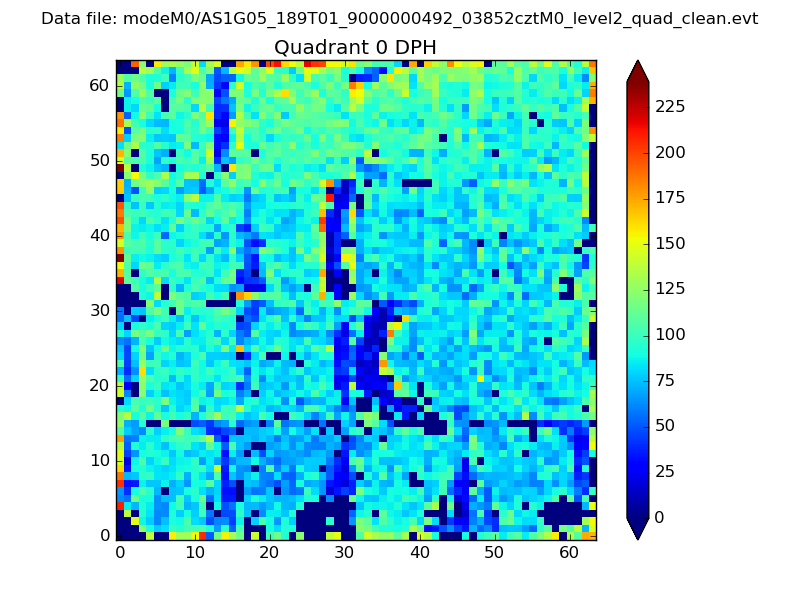 |
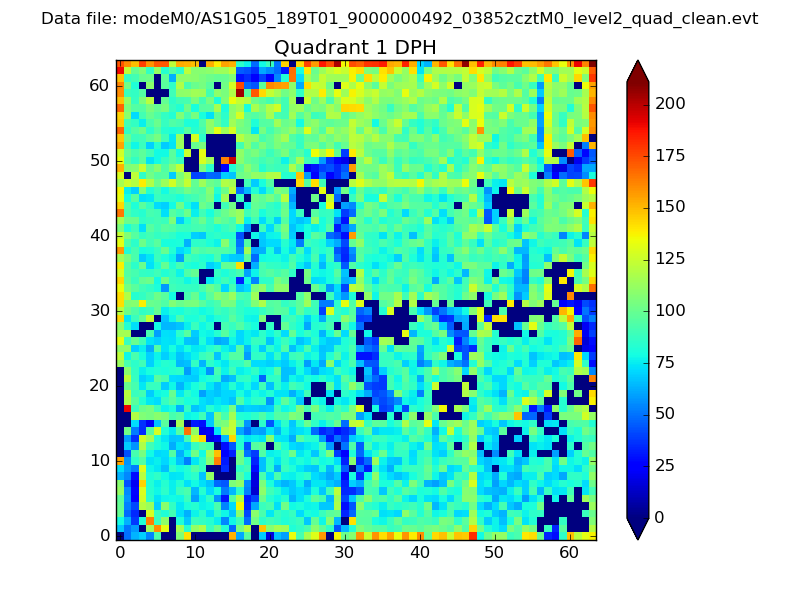 |
Quadrant B |
|---|---|---|---|
| Quadrant D | 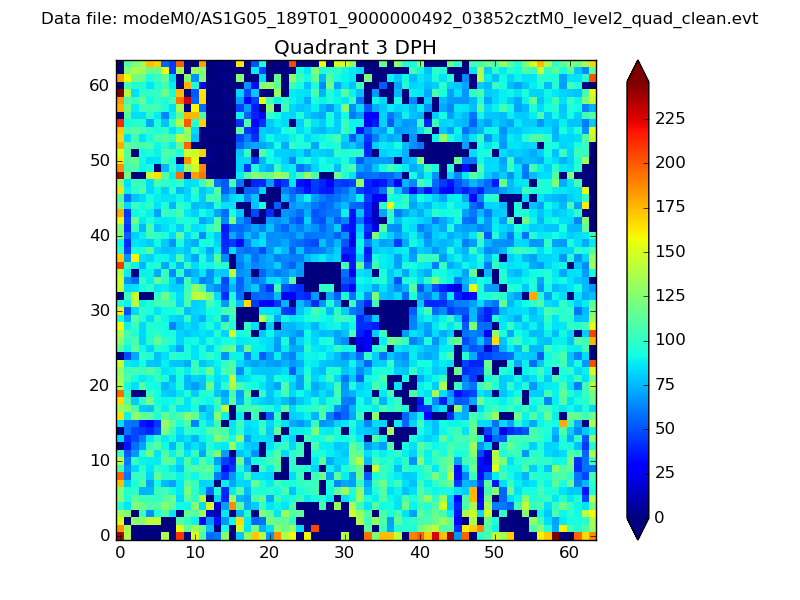 |
 |
Quadrant C |
| Plot type | Count rate plots | Images |
|---|---|---|
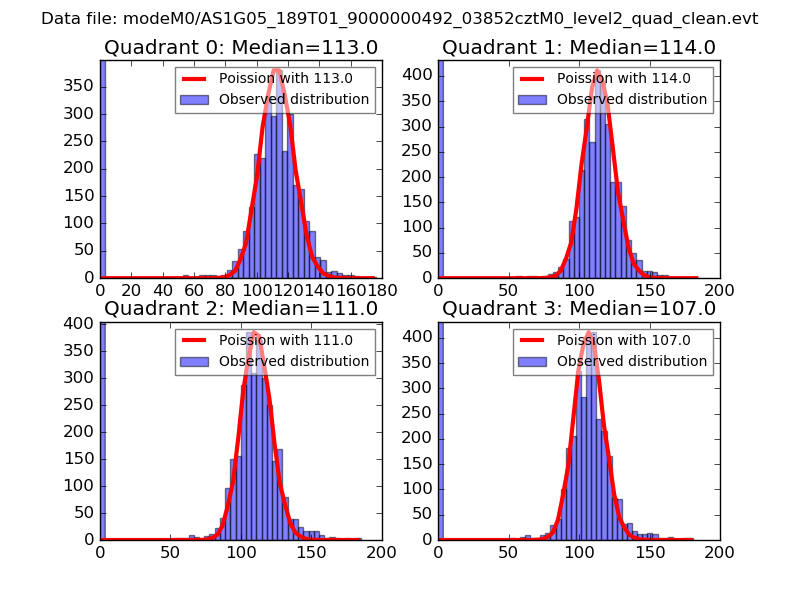
| Comparison with Poisson distribution Blue bars denote a histogram of data divided into 1 sec bins. Red curve is a Poisson curve with rate = median count rate of data. |
 |
 |
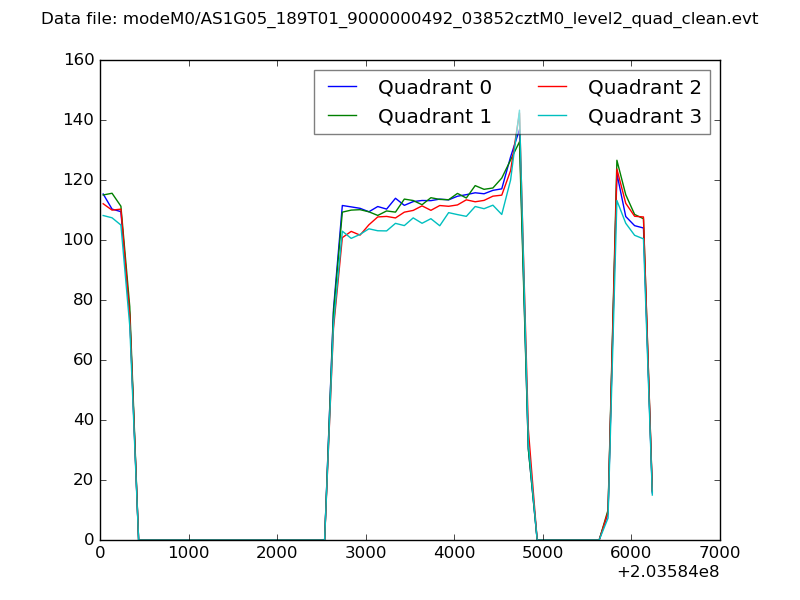
| Quadrant-wise count rates Data is divided into 100 sec bins |
 |
|
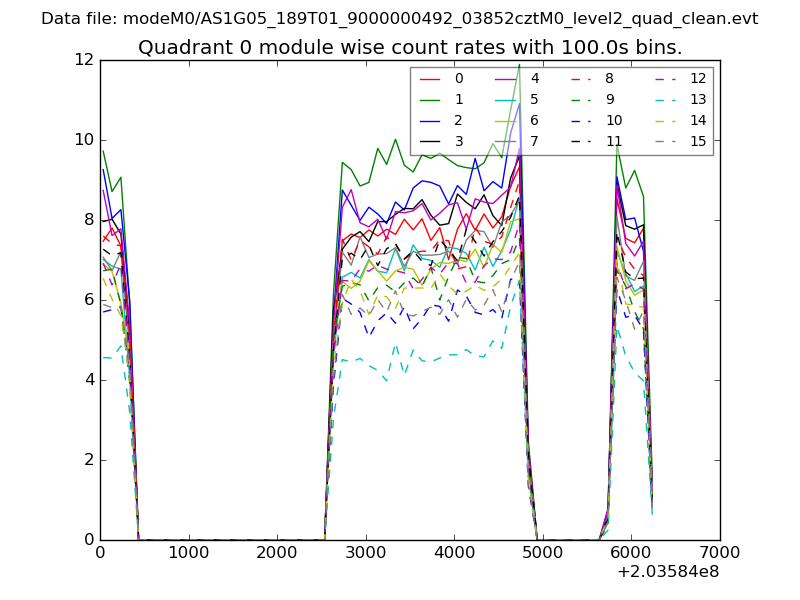
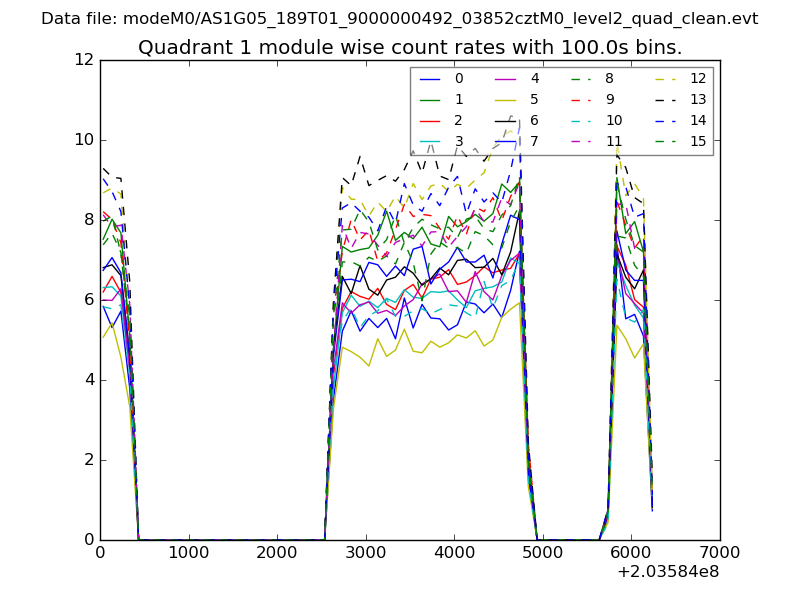
| Module-wise count rates for Quadrant A Data is divided into 100 sec bins |
 |
 |
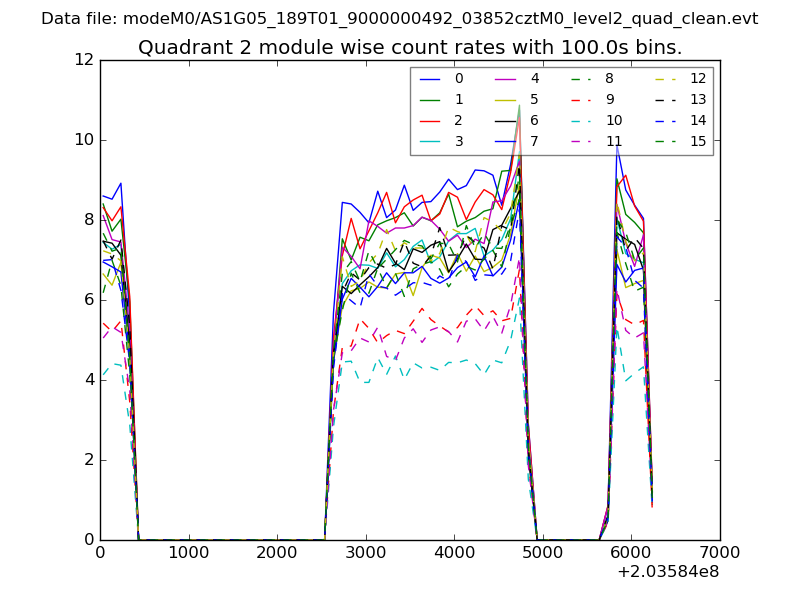
| Module-wise count rates for Quadrant B Data is divided into 100 sec bins |
 |
 |
| Module-wise count rates for Quadrant C Data is divided into 100 sec bins |
 |
 |
| Module-wise count rates for Quadrant D Data is divided into 100 sec bins |
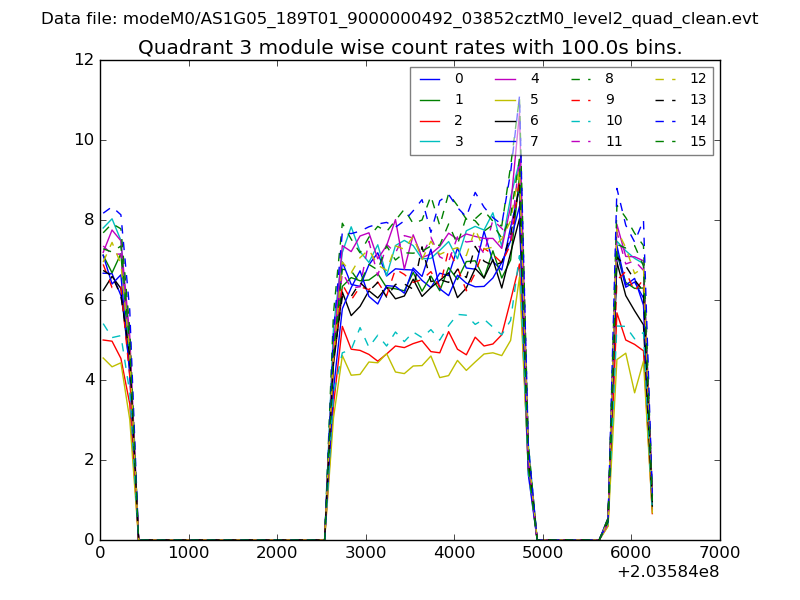 |
 |
| Parameter | Plot |
|---|---|
| CZT HV Monitor | 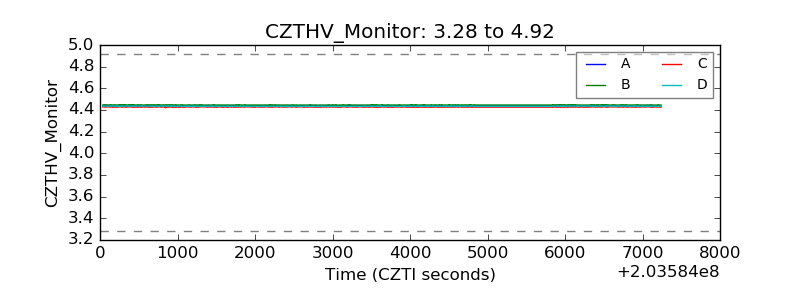 |
| D_VDD | 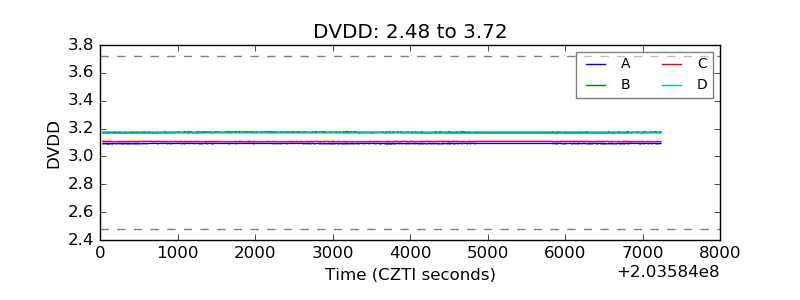 |
| Temperature 1 | 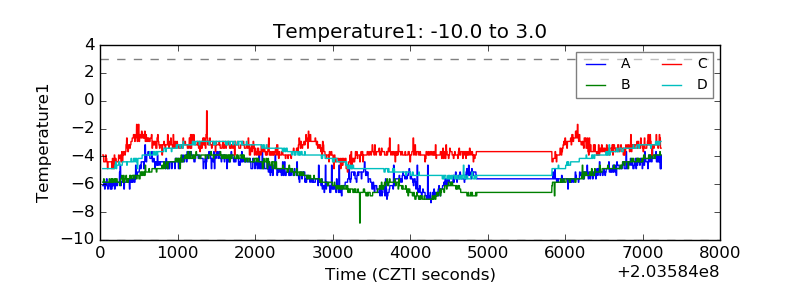 |
| Veto HV Monitor | 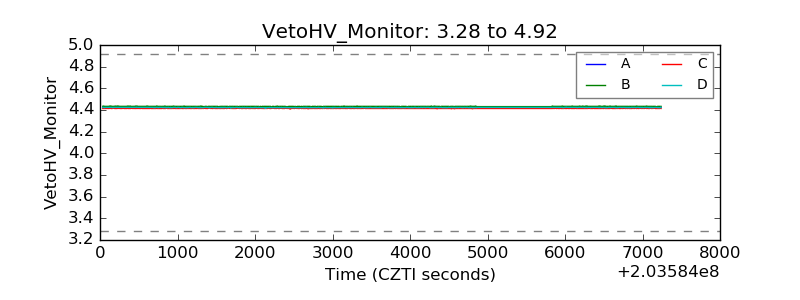 |
| Veto LLD | 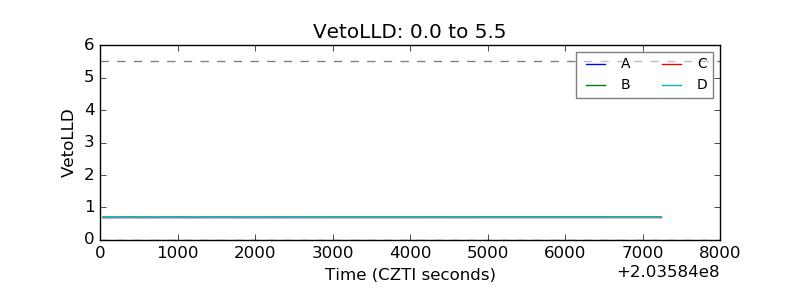 |
| Alpha Counter | 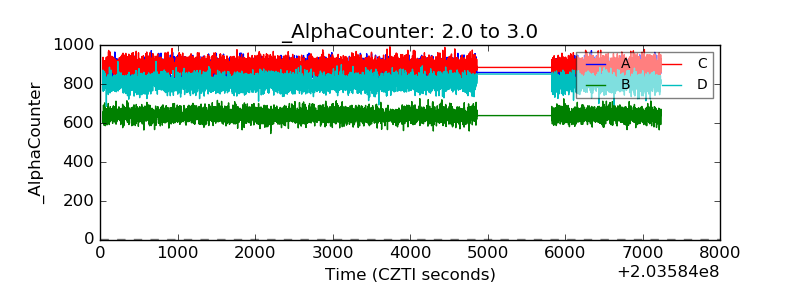 |
| _CPM_Rate | 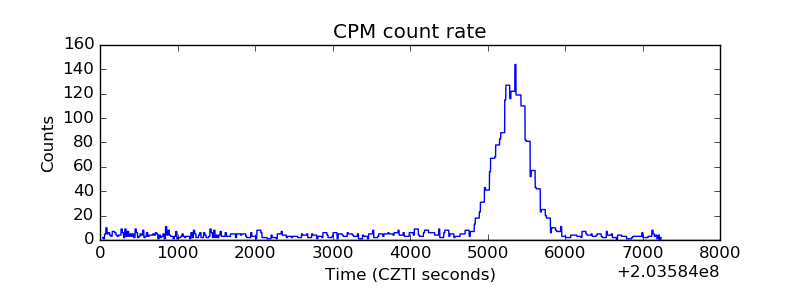 |
| CZT Counter | 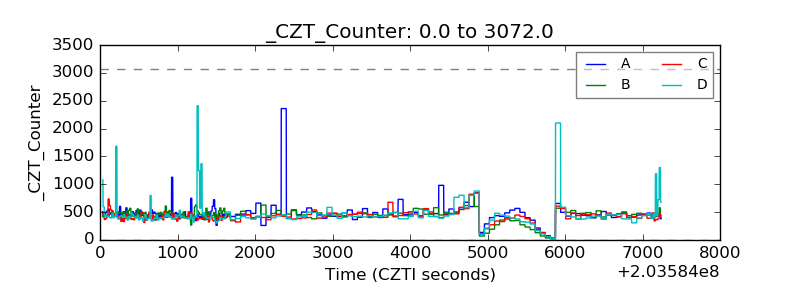 |
| +2.5 Volts monitor | 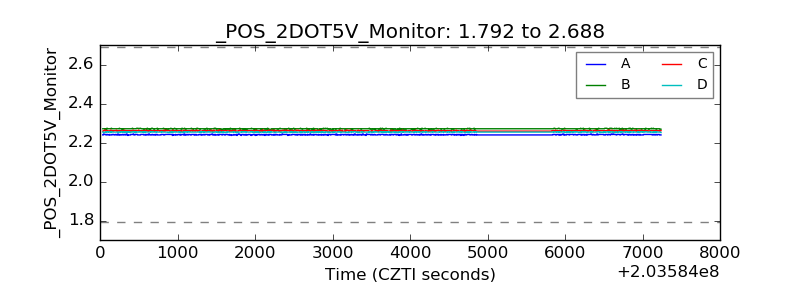 |
| +5 Volts monitor |  |
| Veto Counter | 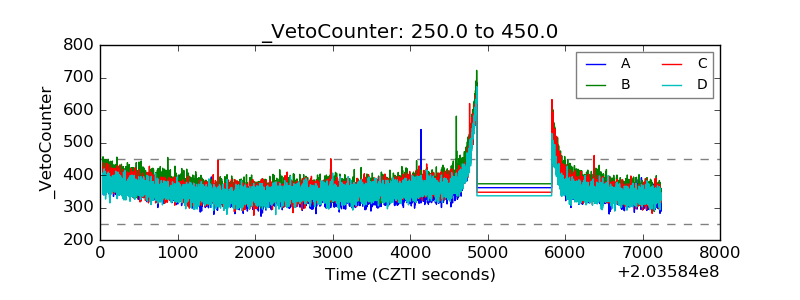 |