| Param | Original file | Final file |
|---|---|---|
| Filename | modeM0/AS1G05_189T01_9000000492_03853cztM0_level2.evt | modeM0/AS1G05_189T01_9000000492_03853cztM0_level2_quad_clean.evt |
| Size (bytes) | 486,089,280 | 66,412,800 |
| Size | 463.6 MB | 63.3 MB |
| Events in quadrant A | 3,665,384 | 383,882 |
| Events in quadrant B | 3,511,807 | 384,381 |
| Events in quadrant C | 3,389,593 | 375,262 |
| Events in quadrant D | 3,665,807 | 366,654 |
| Mode M0 | |||
|---|---|---|---|
| Quadrant | BADHDUFLAG | Total packets | Discarded packets |
| A | 0 | 15637 | 3 |
| B | 0 | 15055 | 2 |
| C | 0 | 15191 | 2 |
| D | 0 | 16161 | 2 |
| Mode M9 | |||
|---|---|---|---|
| Quadrant | BADHDUFLAG | Total packets | Discarded packets |
| A | 0 | 16 | 0 |
| B | 0 | 16 | 0 |
| C | 0 | 16 | 0 |
| D | 0 | 16 | 0 |
| Mode SS | |||
|---|---|---|---|
| Quadrant | BADHDUFLAG | Total packets | Discarded packets |
| A | 0 | 146 | 0 |
| B | 0 | 146 | 0 |
| C | 0 | 146 | 0 |
| D | 0 | 146 | 0 |
| Quadrant | Total seconds | Saturated seconds | Saturation percentage |
|---|---|---|---|
| A | 7194 | 178 | 2.474284% |
| B | 7194 | 149 | 2.071170% |
| C | 7194 | 130 | 1.807061% |
| D | 7194 | 156 | 2.168474% |
Noise dominated data is calculated using 1-second bins in cleaned event files. If a bin has >2000 counts, and if more than 50% of those come from <1% of pixels, then it is considered to be noise-dominated and hence unusable.
| Quadrant | # 1 sec bins | Bins with >0 counts | Bins with >2000 counts | High rate bins dominated by noise | Noise dominated (total time) | Noise dominated (detector-on time) | Marked lightcurve |
|---|---|---|---|---|---|---|---|
| A | 8694 | 7194 | 33 | 33 | 0.38% | 0.46% | 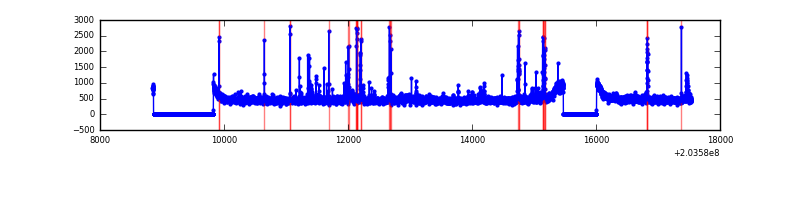 |
| B | 8694 | 7194 | 2 | 2 | 0.02% | 0.03% | 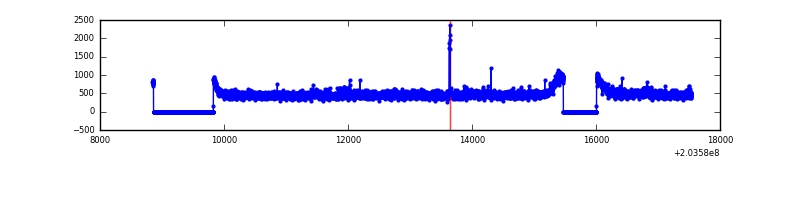 |
| C | 8694 | 7194 | 10 | 10 | 0.12% | 0.14% | 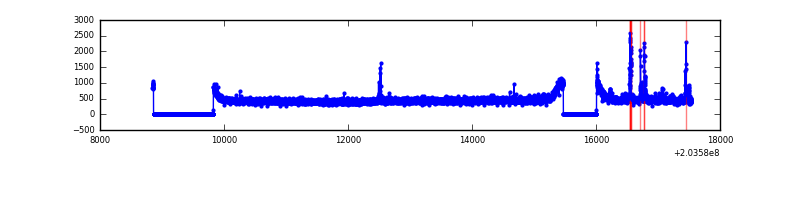 |
| D | 8694 | 7194 | 34 | 34 | 0.39% | 0.47% | 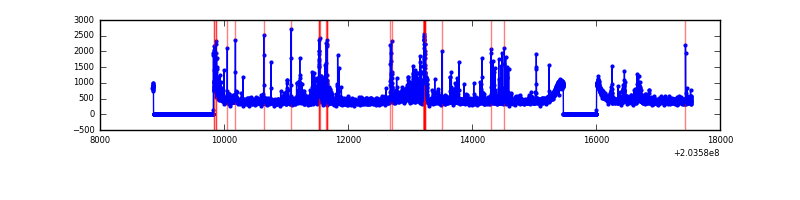 |
Top three noisy pixels from each quadrant. If the there are fewer than three noisy pixels in the level2.evt file, extra rows are filled as -1
| Pixel properties | Quadrant properties | ||||||
|---|---|---|---|---|---|---|---|
| Quadrant | DetID | PixID | Counts | Sigma | Mean | Median | Sigma |
| A | 13 | 251 | 239143 | 1359.82 | 855 | 837 | 175.2 |
| A | 15 | 234 | 63561 | 357.91 | 855 | 837 | 175.2 |
| A | 8 | 15 | 48851 | 273.98 | 855 | 837 | 175.2 |
| B | 15 | 204 | 100164 | 589.98 | 863 | 845 | 168.3 |
| B | 14 | 167 | 50647 | 295.83 | 863 | 845 | 168.3 |
| B | 0 | 219 | 25585 | 146.96 | 863 | 845 | 168.3 |
| C | 2 | 53 | 152543 | 785.9 | 821 | 824 | 193.1 |
| C | 9 | 247 | 17205 | 84.85 | 821 | 824 | 193.1 |
| C | 13 | 61 | 6943 | 31.7 | 821 | 824 | 193.1 |
| D | 2 | 32 | 267130 | 1322.31 | 824 | 801 | 201.4 |
| D | 13 | 223 | 89077 | 438.29 | 824 | 801 | 201.4 |
| D | 12 | 16 | 45729 | 223.07 | 824 | 801 | 201.4 |
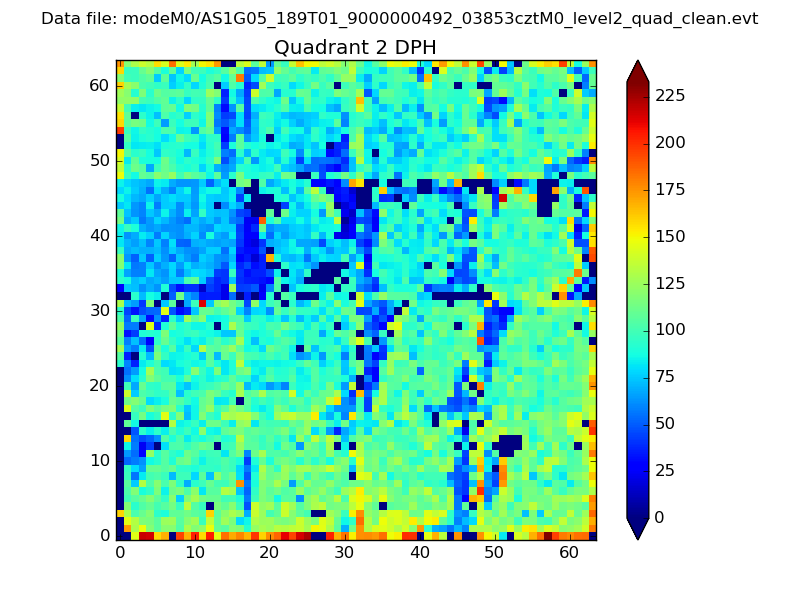
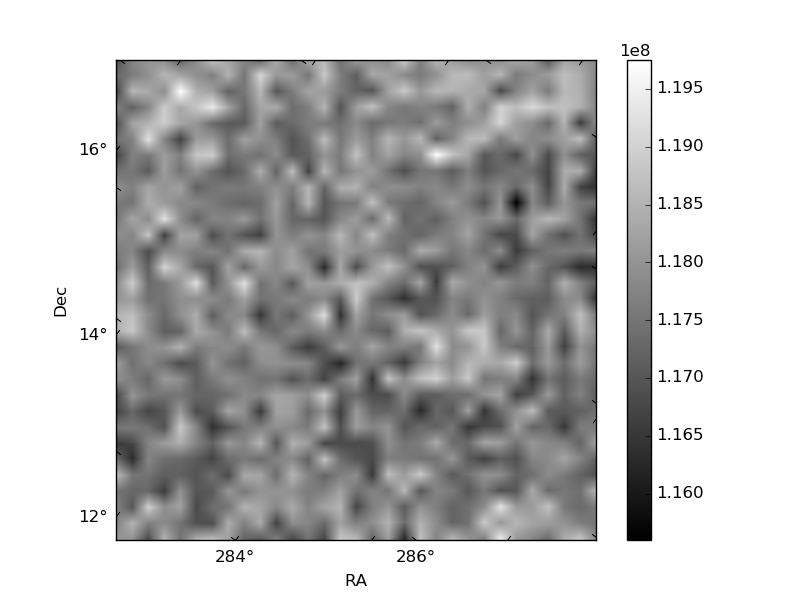
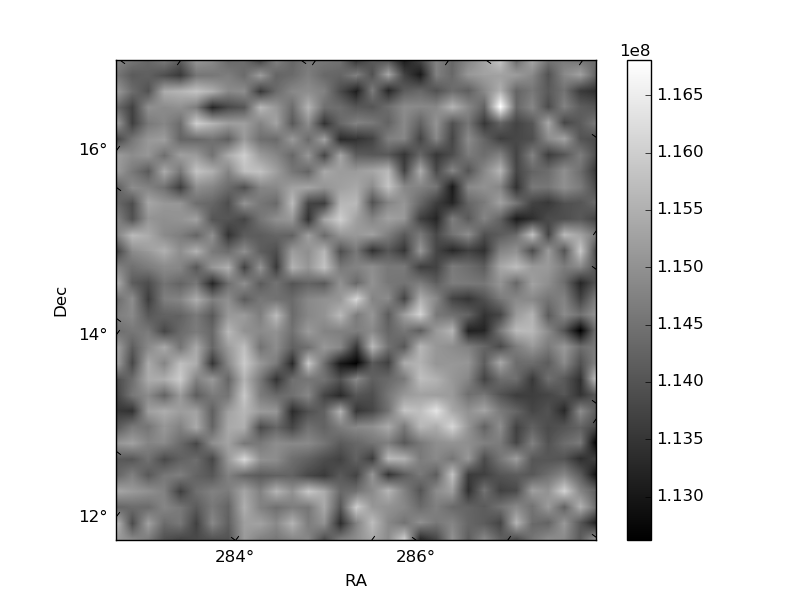
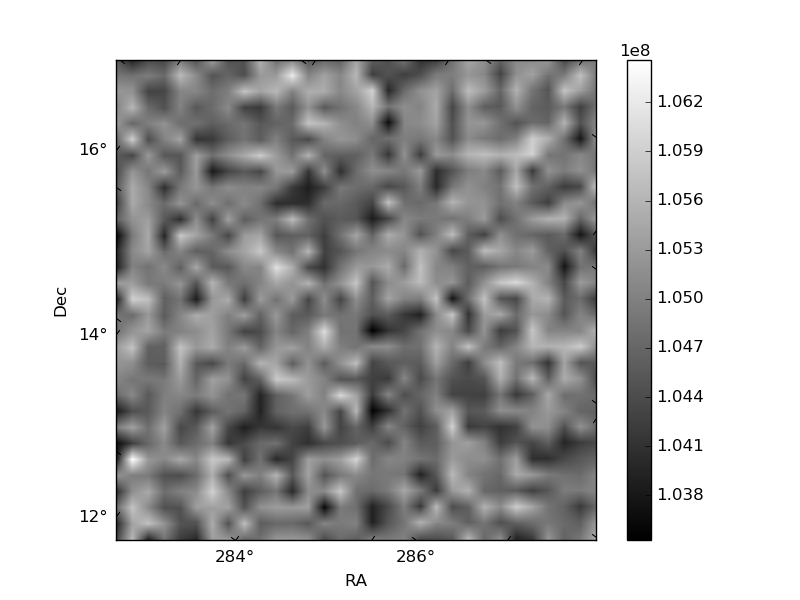
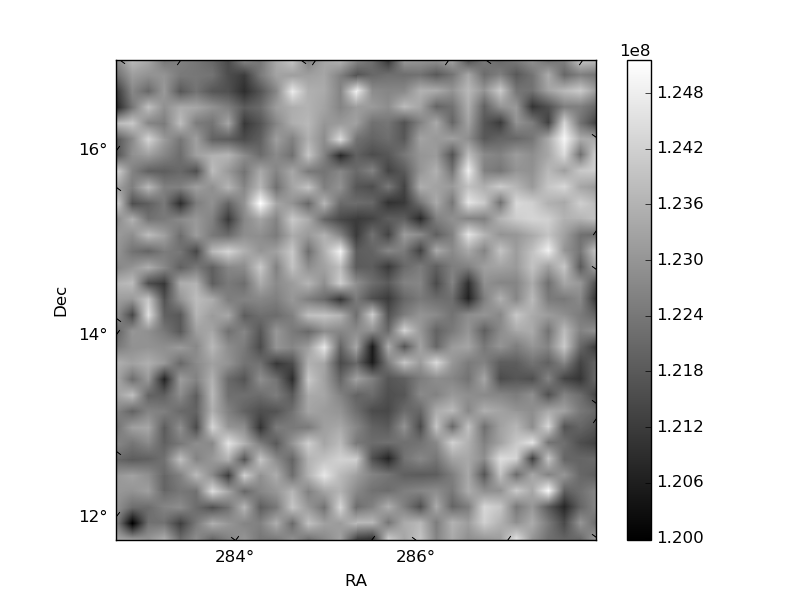
Histogram calculated using DETX and DETY for each event in the final _common_clean file
| Quadrant A | 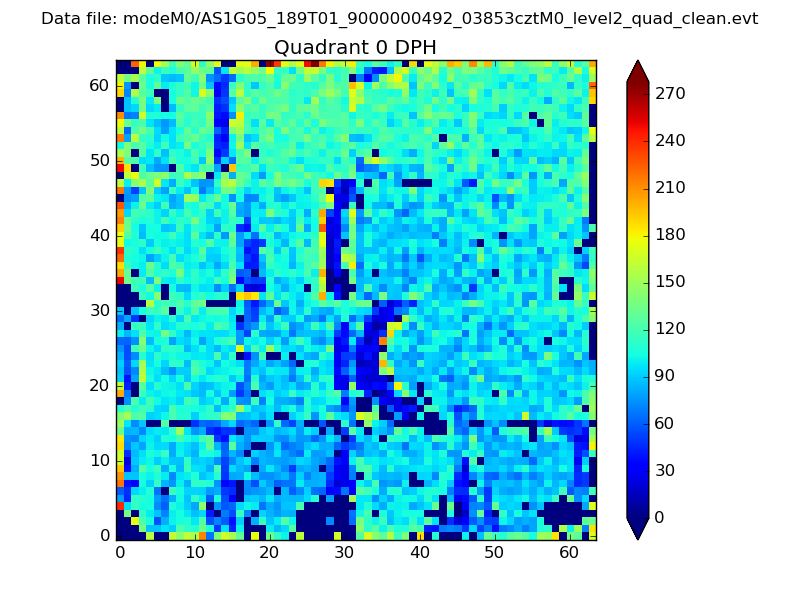 |
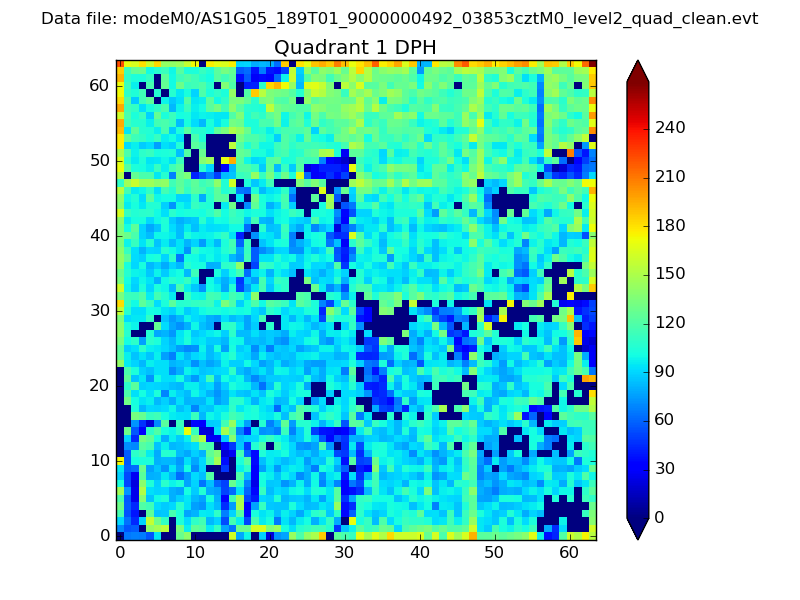 |
Quadrant B |
|---|---|---|---|
| Quadrant D | 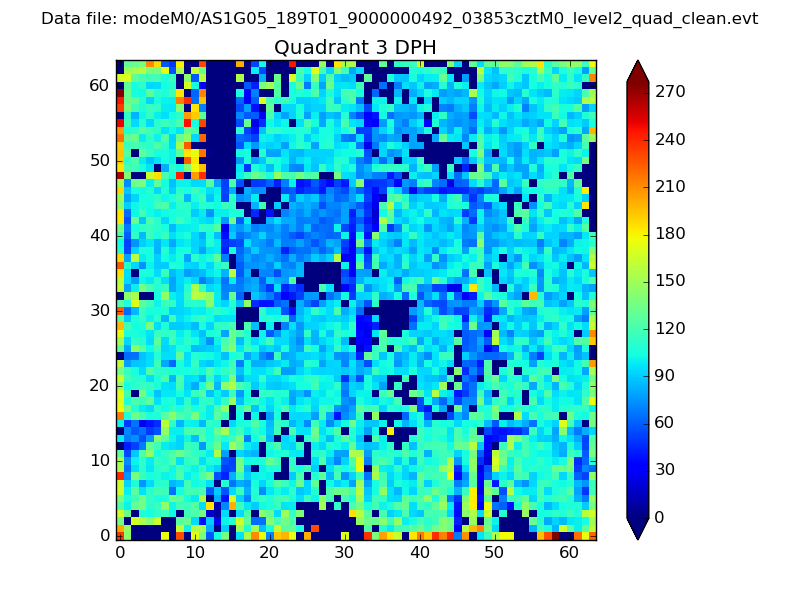 |
 |
Quadrant C |
| Plot type | Count rate plots | Images |
|---|---|---|
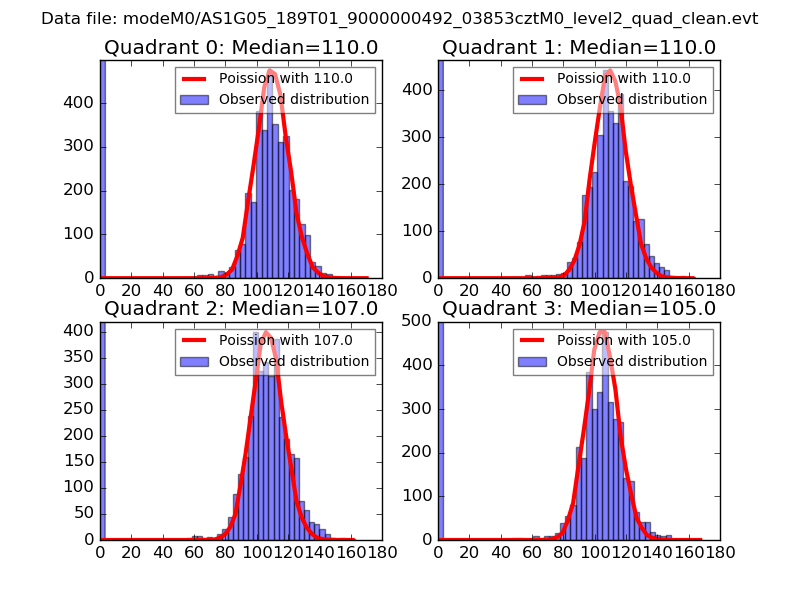
| Comparison with Poisson distribution Blue bars denote a histogram of data divided into 1 sec bins. Red curve is a Poisson curve with rate = median count rate of data. |
 |
 |
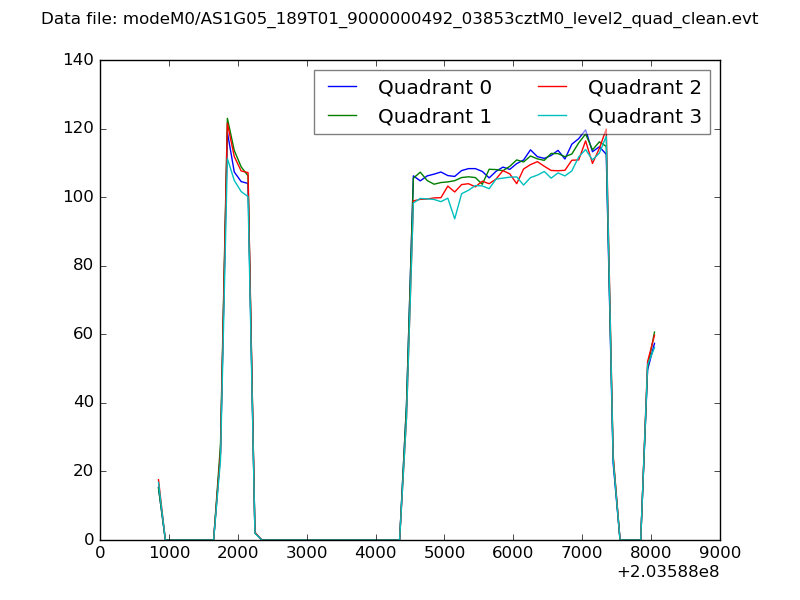
| Quadrant-wise count rates Data is divided into 100 sec bins |
 |
|
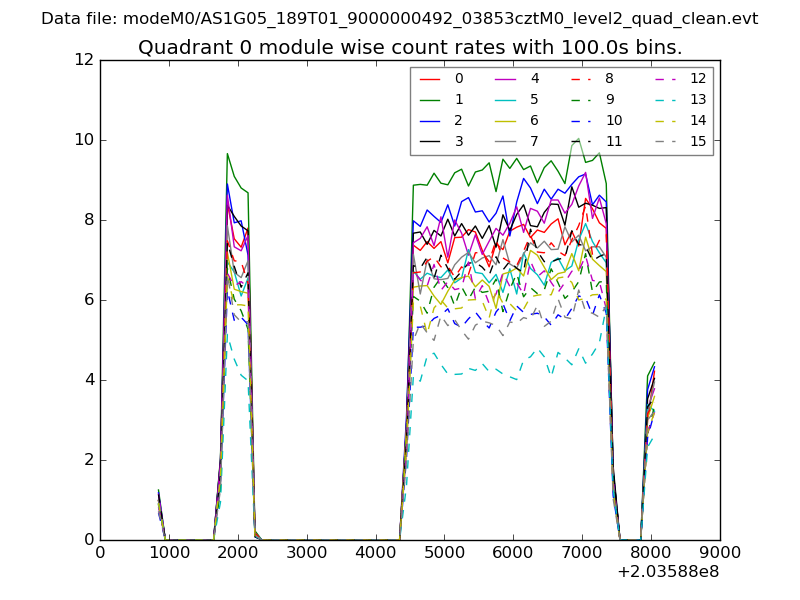
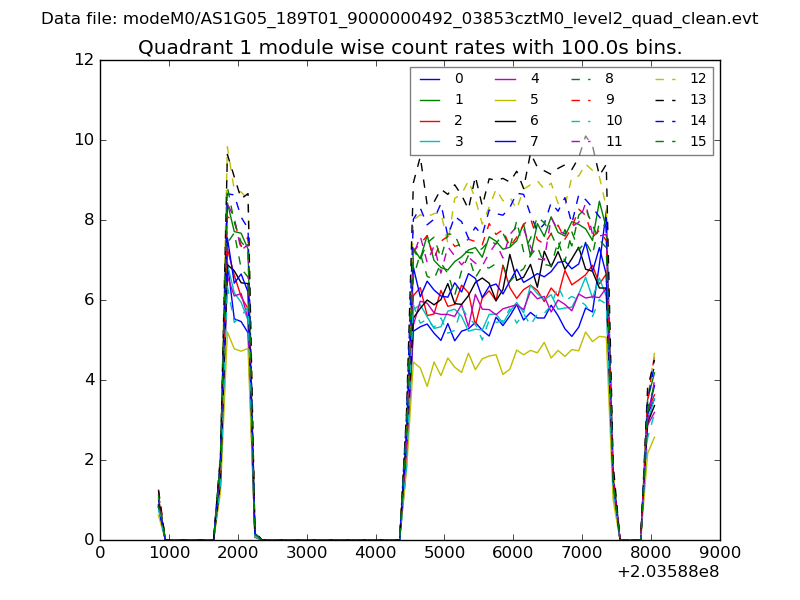
| Module-wise count rates for Quadrant A Data is divided into 100 sec bins |
 |
 |
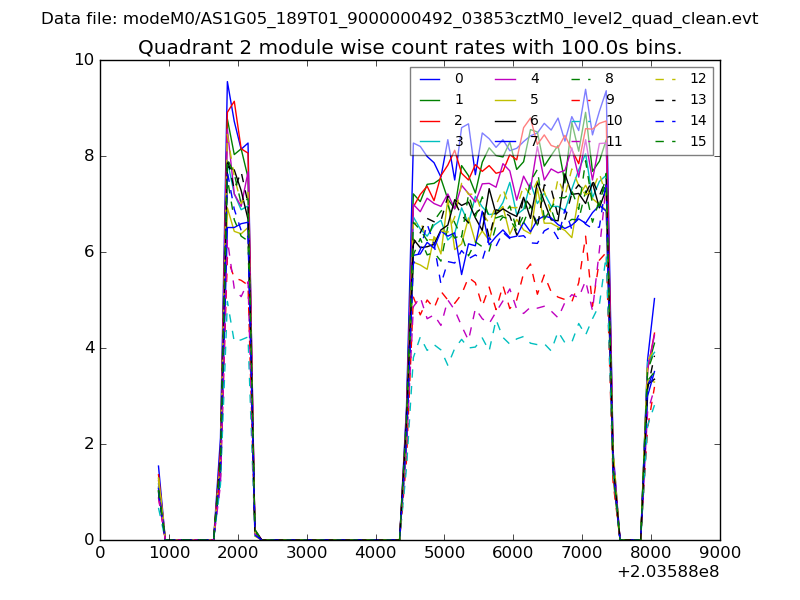
| Module-wise count rates for Quadrant B Data is divided into 100 sec bins |
 |
 |
| Module-wise count rates for Quadrant C Data is divided into 100 sec bins |
 |
 |
| Module-wise count rates for Quadrant D Data is divided into 100 sec bins |
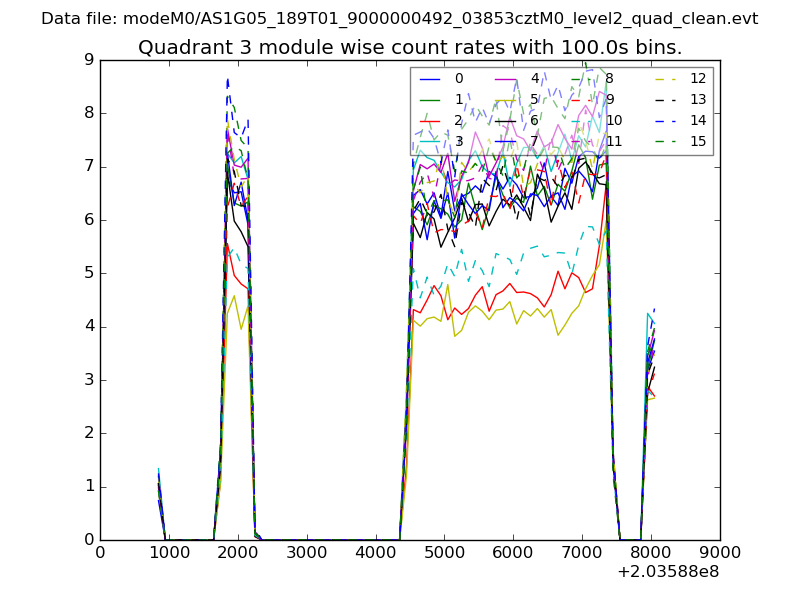 |
 |
| Parameter | Plot |
|---|---|
| CZT HV Monitor | 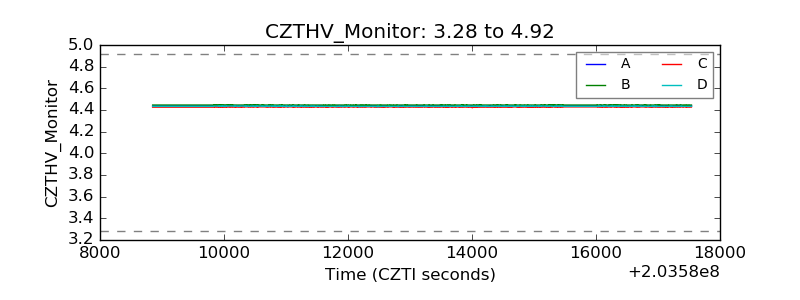 |
| D_VDD | 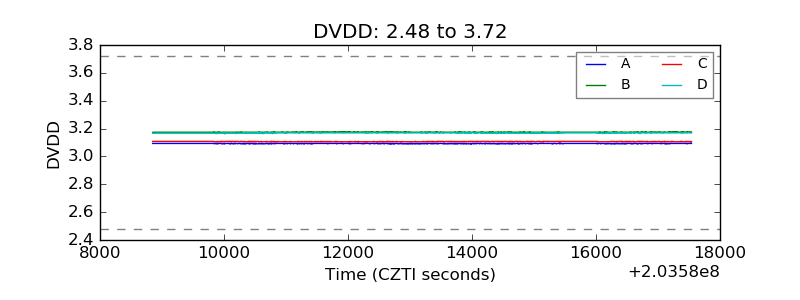 |
| Temperature 1 | 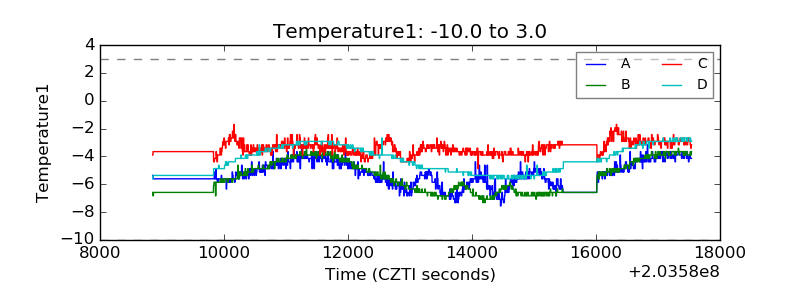 |
| Veto HV Monitor |  |
| Veto LLD | 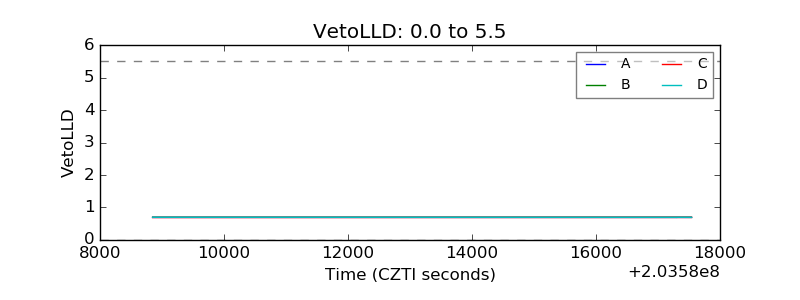 |
| Alpha Counter | 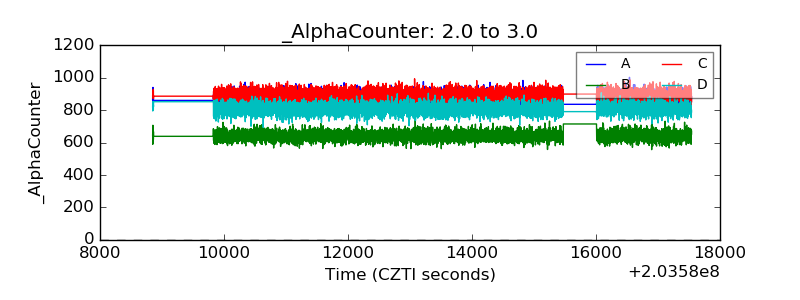 |
| _CPM_Rate | 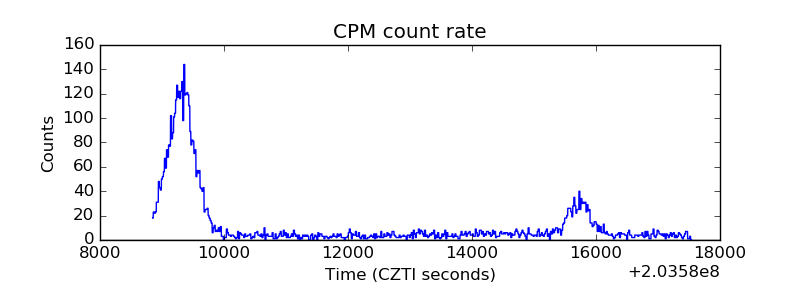 |
| CZT Counter | 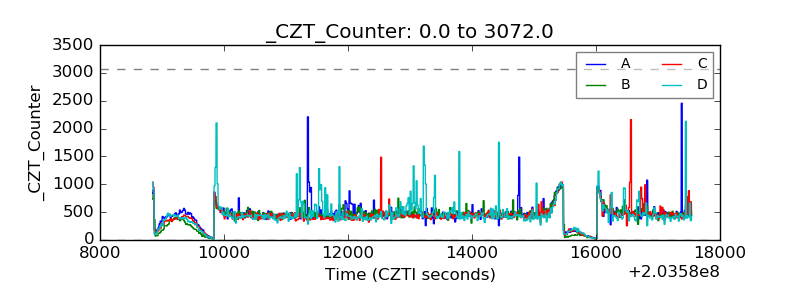 |
| +2.5 Volts monitor |  |
| +5 Volts monitor |  |
| Veto Counter | 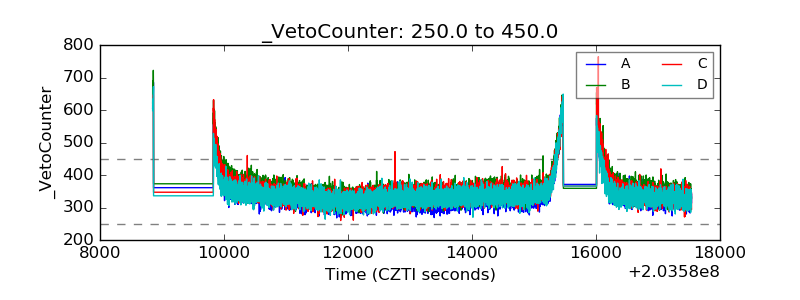 |