| Param | Original file | Final file |
|---|---|---|
| Filename | modeM0/AS1G05_189T01_9000000492_03854cztM0_level2.evt | modeM0/AS1G05_189T01_9000000492_03854cztM0_level2_quad_clean.evt |
| Size (bytes) | 546,557,760 | 70,516,800 |
| Size | 521.2 MB | 67.3 MB |
| Events in quadrant A | 3,957,586 | 405,778 |
| Events in quadrant B | 4,016,228 | 403,754 |
| Events in quadrant C | 4,246,361 | 394,747 |
| Events in quadrant D | 3,801,144 | 387,092 |
| Mode M0 | |||
|---|---|---|---|
| Quadrant | BADHDUFLAG | Total packets | Discarded packets |
| A | 0 | 17009 | 3 |
| B | 0 | 17005 | 2 |
| C | 0 | 17744 | 2 |
| D | 0 | 17192 | 2 |
| Mode M9 | |||
|---|---|---|---|
| Quadrant | BADHDUFLAG | Total packets | Discarded packets |
| A | 0 | 6 | 0 |
| B | 0 | 6 | 0 |
| C | 0 | 6 | 0 |
| D | 0 | 6 | 0 |
| Mode SS | |||
|---|---|---|---|
| Quadrant | BADHDUFLAG | Total packets | Discarded packets |
| A | 0 | 158 | 0 |
| B | 0 | 158 | 0 |
| C | 0 | 158 | 0 |
| D | 0 | 158 | 0 |
| Quadrant | Total seconds | Saturated seconds | Saturation percentage |
|---|---|---|---|
| A | 7818 | 379 | 4.847787% |
| B | 7818 | 373 | 4.771041% |
| C | 7818 | 323 | 4.131491% |
| D | 7818 | 322 | 4.118700% |
Noise dominated data is calculated using 1-second bins in cleaned event files. If a bin has >2000 counts, and if more than 50% of those come from <1% of pixels, then it is considered to be noise-dominated and hence unusable.
| Quadrant | # 1 sec bins | Bins with >0 counts | Bins with >2000 counts | High rate bins dominated by noise | Noise dominated (total time) | Noise dominated (detector-on time) | Marked lightcurve |
|---|---|---|---|---|---|---|---|
| A | 8388 | 7818 | 8 | 8 | 0.10% | 0.10% | 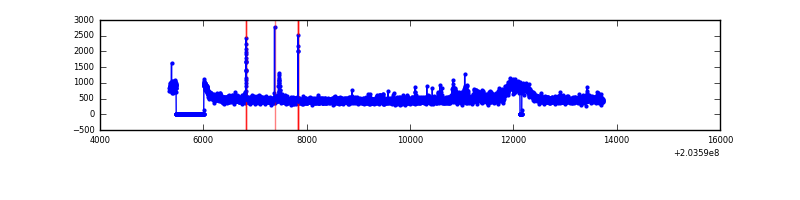 |
| B | 8388 | 7818 | 7 | 7 | 0.08% | 0.09% | 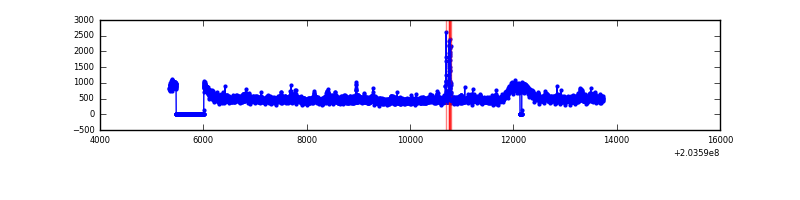 |
| C | 8388 | 7818 | 23 | 23 | 0.27% | 0.29% | 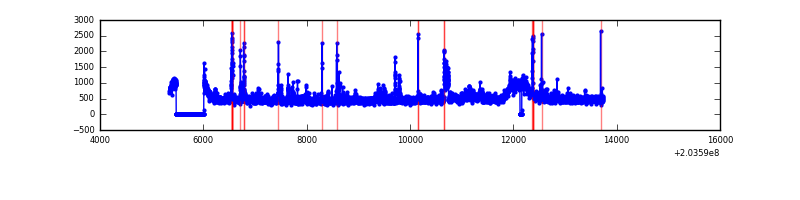 |
| D | 8388 | 7818 | 12 | 12 | 0.14% | 0.15% | 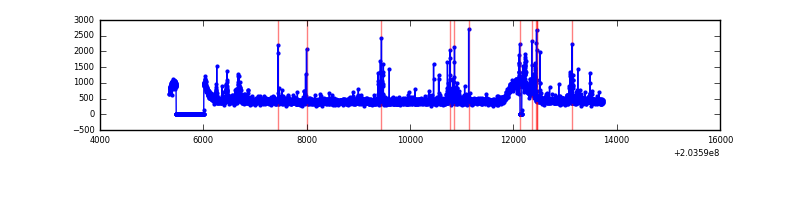 |
Top three noisy pixels from each quadrant. If the there are fewer than three noisy pixels in the level2.evt file, extra rows are filled as -1
| Pixel properties | Quadrant properties | ||||||
|---|---|---|---|---|---|---|---|
| Quadrant | DetID | PixID | Counts | Sigma | Mean | Median | Sigma |
| A | 8 | 15 | 157594 | 792.34 | 960 | 939 | 197.7 |
| A | 15 | 234 | 50135 | 248.83 | 960 | 939 | 197.7 |
| A | 13 | 251 | 31867 | 156.43 | 960 | 939 | 197.7 |
| B | 15 | 204 | 148739 | 773.9 | 965 | 941 | 191.0 |
| B | 14 | 167 | 69615 | 359.59 | 965 | 941 | 191.0 |
| B | 5 | 85 | 47958 | 246.19 | 965 | 941 | 191.0 |
| C | 2 | 53 | 502222 | 2290.28 | 925 | 929 | 218.9 |
| C | 9 | 247 | 38162 | 170.11 | 925 | 929 | 218.9 |
| C | 4 | 206 | 25515 | 112.33 | 925 | 929 | 218.9 |
| D | 12 | 227 | 80667 | 350.22 | 929 | 900 | 227.8 |
| D | 2 | 63 | 37202 | 159.39 | 929 | 900 | 227.8 |
| D | 2 | 31 | 29038 | 123.54 | 929 | 900 | 227.8 |
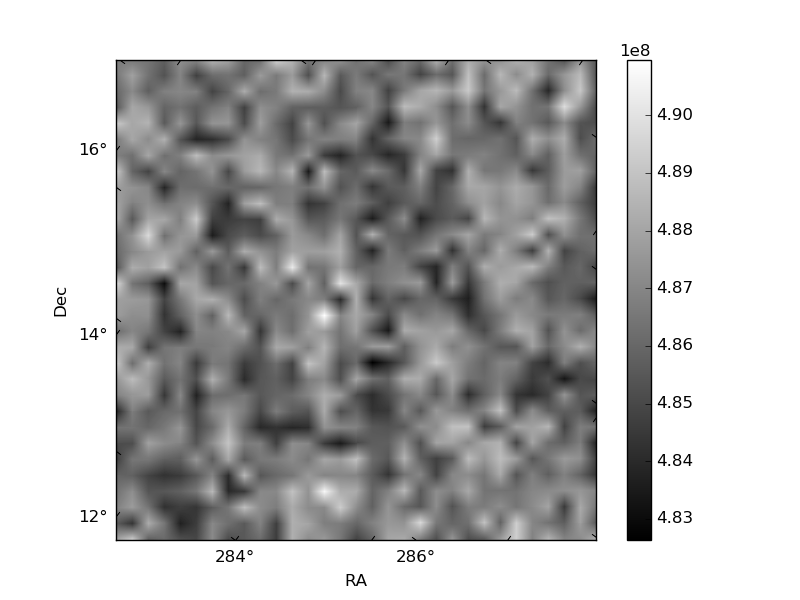
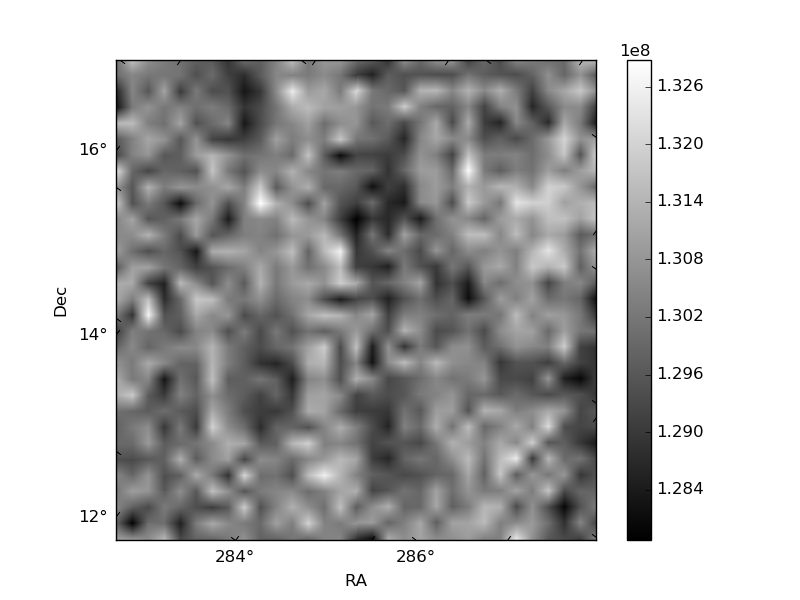
Histogram calculated using DETX and DETY for each event in the final _common_clean file
| Quadrant A | 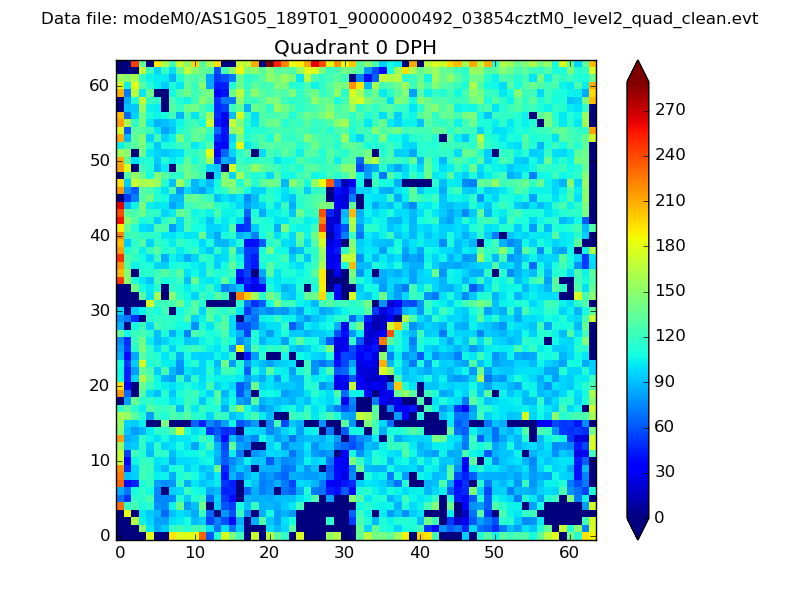 |
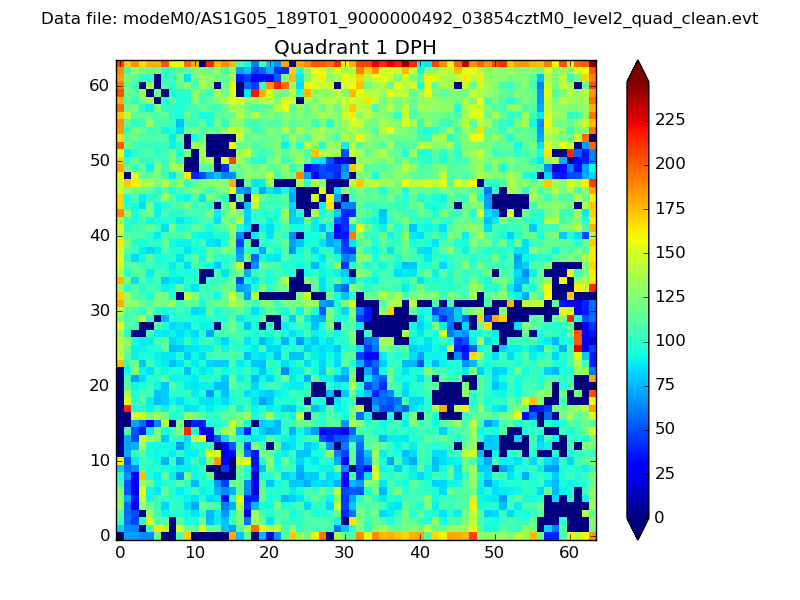 |
Quadrant B |
|---|---|---|---|
| Quadrant D | 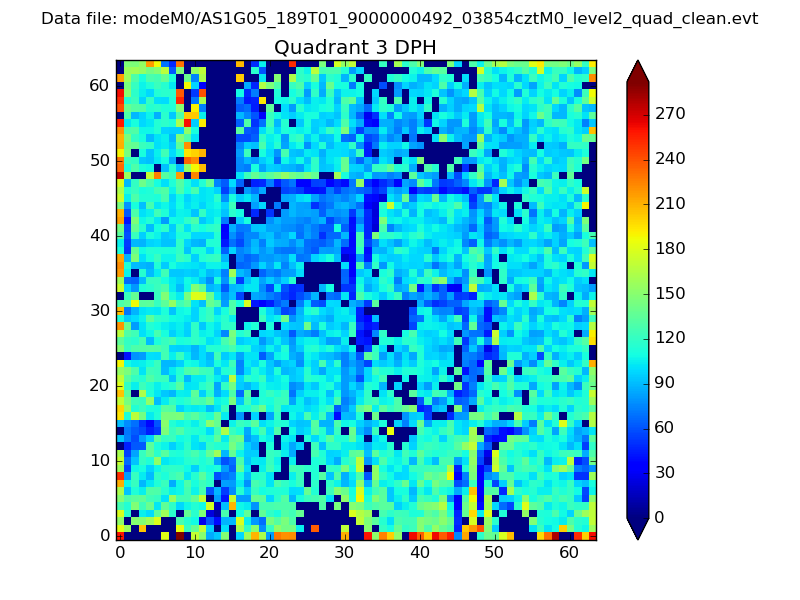 |
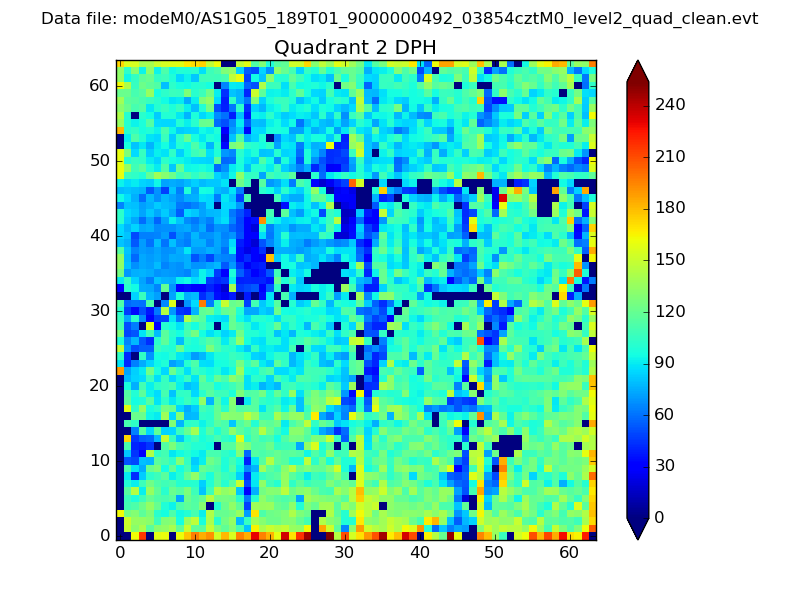 |
Quadrant C |
| Plot type | Count rate plots | Images |
|---|---|---|
| Comparison with Poisson distribution Blue bars denote a histogram of data divided into 1 sec bins. Red curve is a Poisson curve with rate = median count rate of data. |
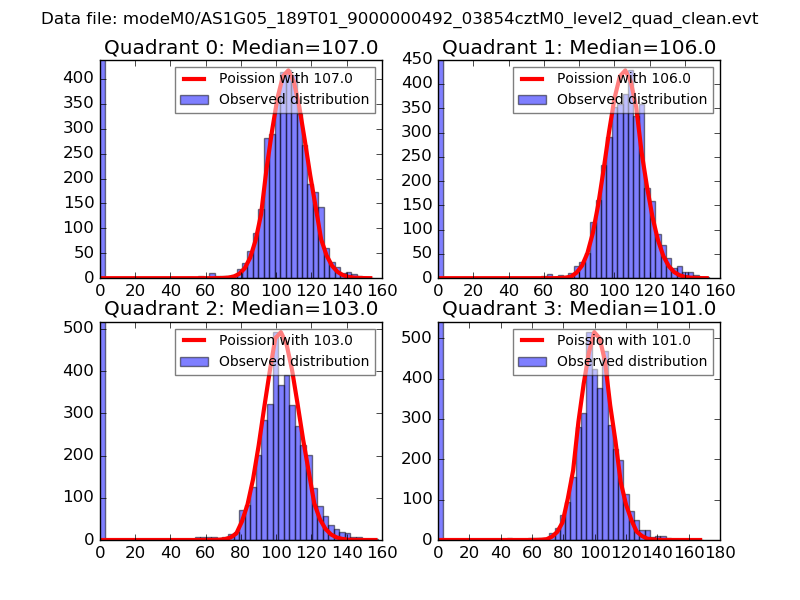 |
 |
| Quadrant-wise count rates Data is divided into 100 sec bins |
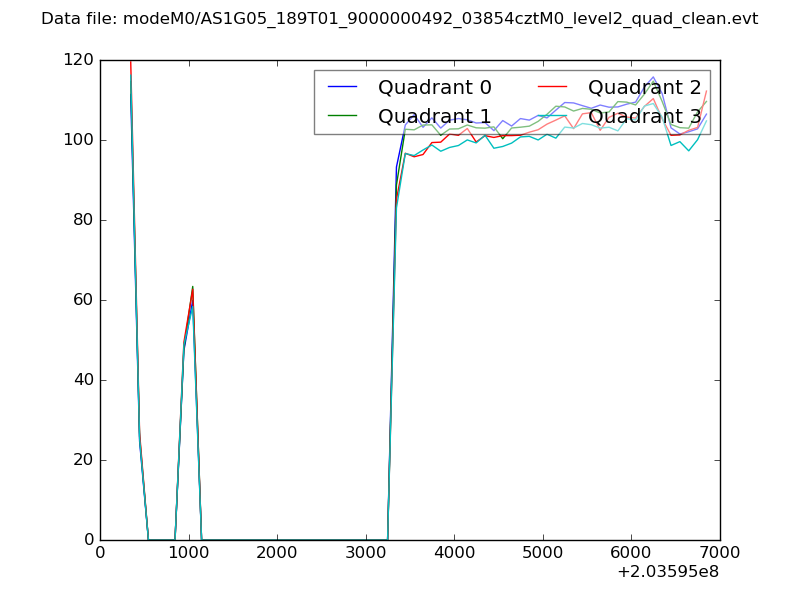 |
|
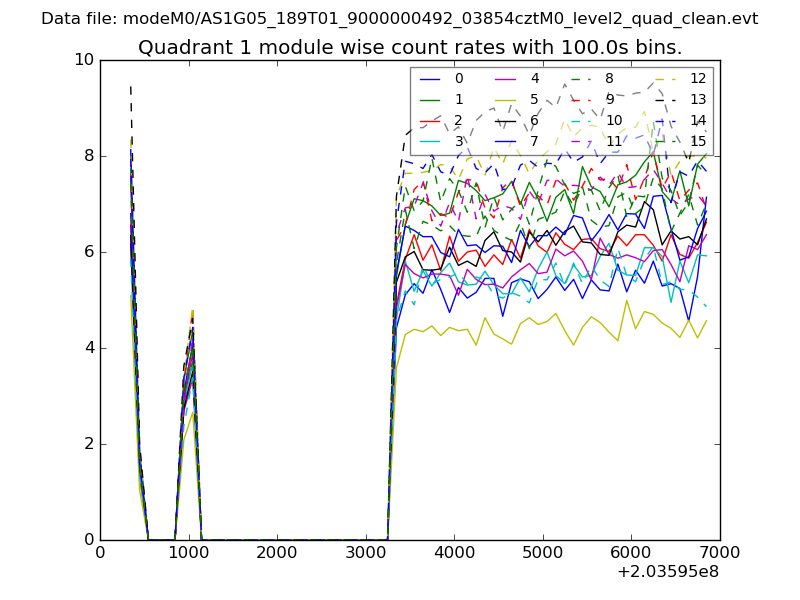
| Module-wise count rates for Quadrant A Data is divided into 100 sec bins |
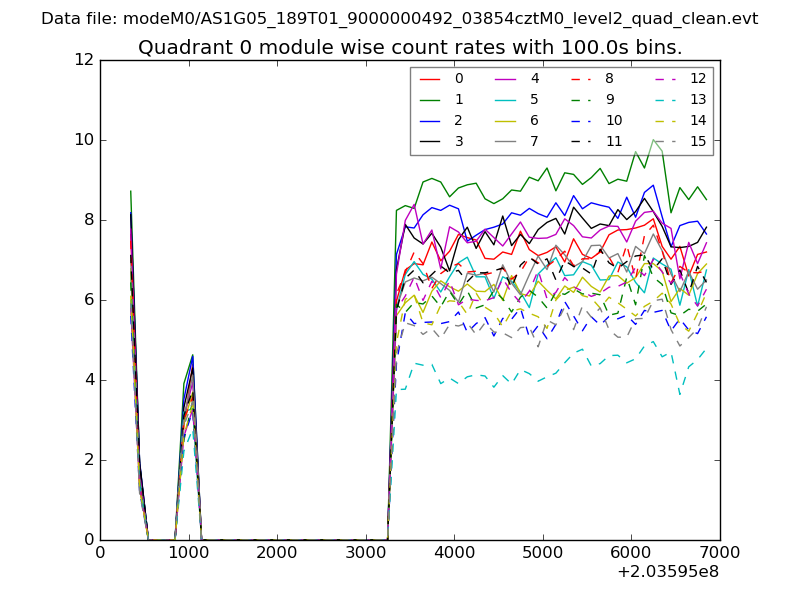 |
 |
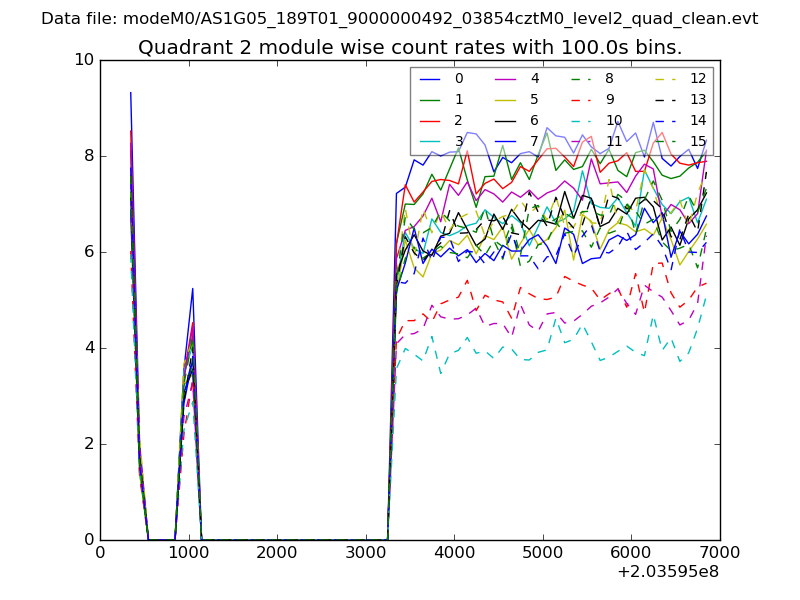
| Module-wise count rates for Quadrant B Data is divided into 100 sec bins |
 |
 |
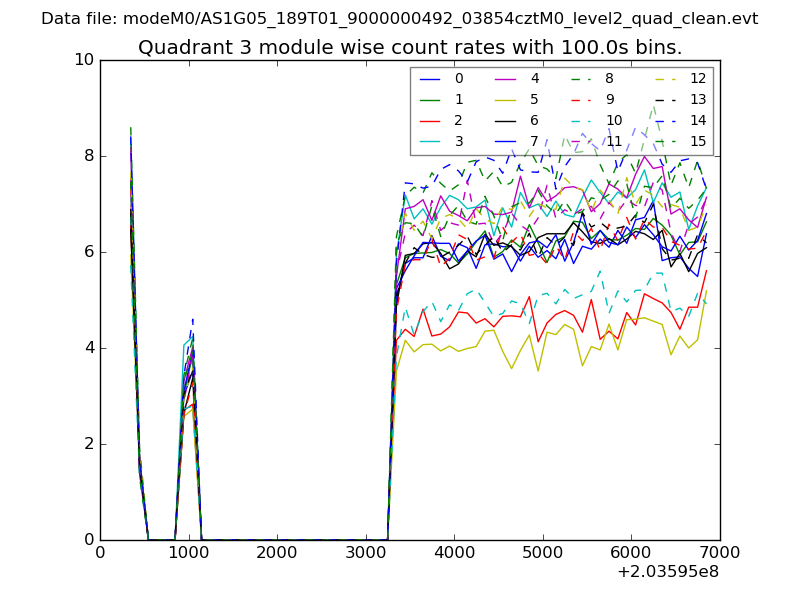
| Module-wise count rates for Quadrant C Data is divided into 100 sec bins |
 |
 |
| Module-wise count rates for Quadrant D Data is divided into 100 sec bins |
 |
 |
| Parameter | Plot |
|---|---|
| CZT HV Monitor | 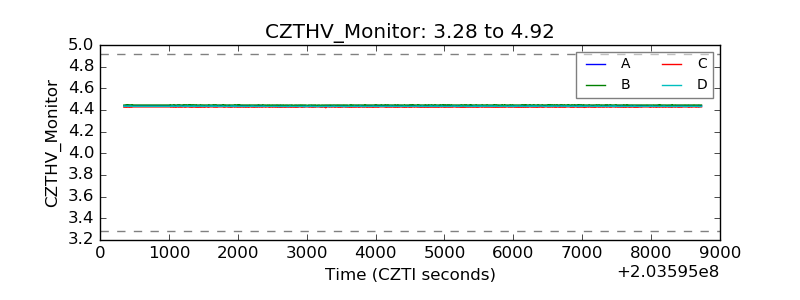 |
| D_VDD | 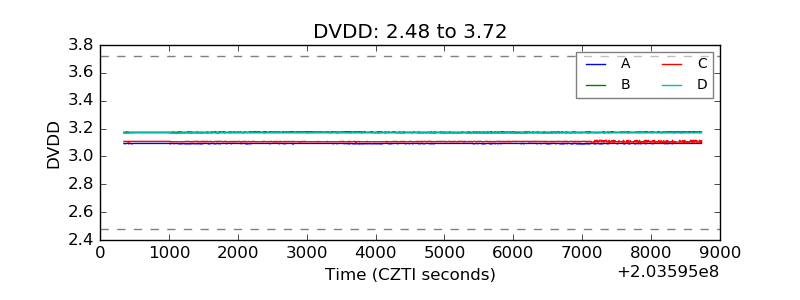 |
| Temperature 1 | 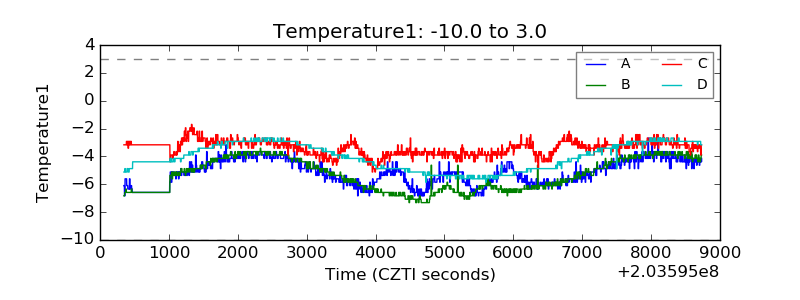 |
| Veto HV Monitor | 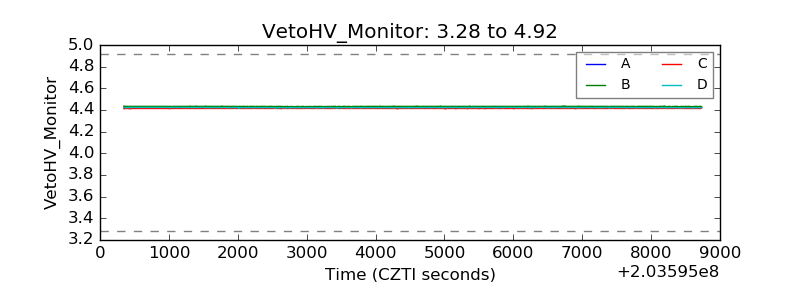 |
| Veto LLD | 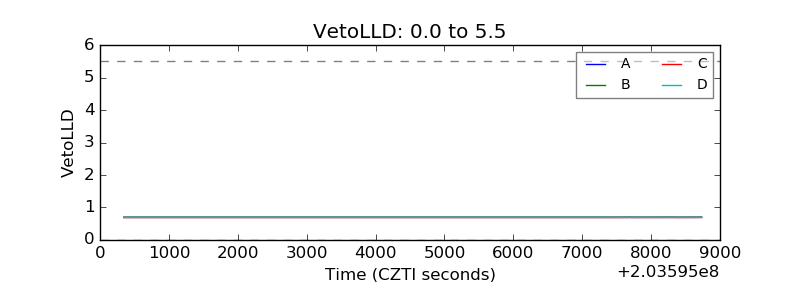 |
| Alpha Counter | 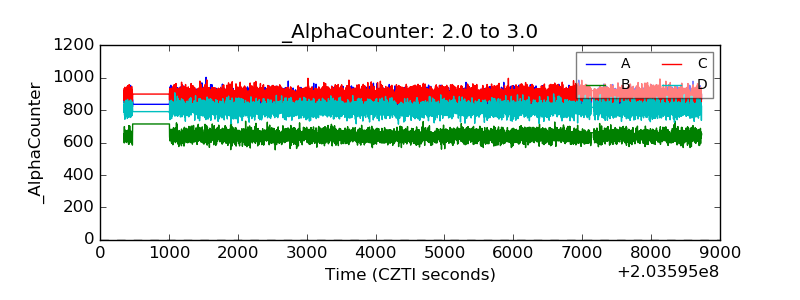 |
| _CPM_Rate | 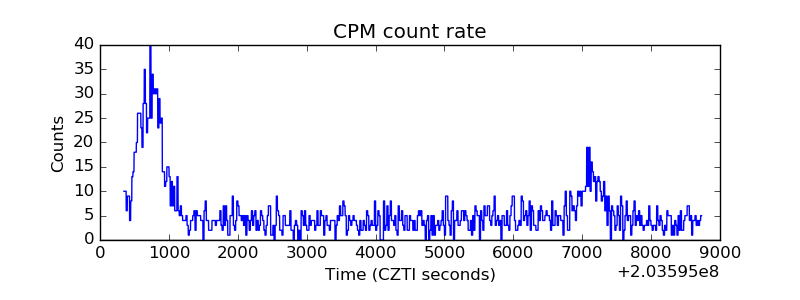 |
| CZT Counter | 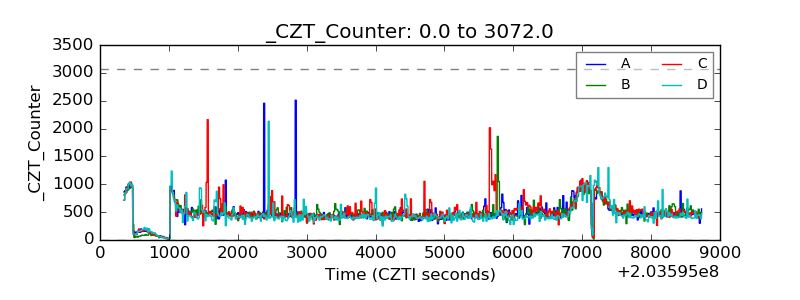 |
| +2.5 Volts monitor |  |
| +5 Volts monitor |  |
| Veto Counter | 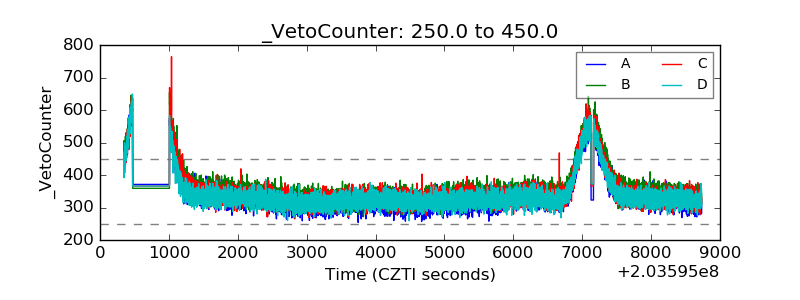 |