| Param | Original file | Final file |
|---|---|---|
| Filename | modeM0/AS1G05_189T01_9000000492_03855cztM0_level2.evt | modeM0/AS1G05_189T01_9000000492_03855cztM0_level2_quad_clean.evt |
| Size (bytes) | 655,931,520 | 79,476,480 |
| Size | 625.5 MB | 75.8 MB |
| Events in quadrant A | 4,403,945 | 459,016 |
| Events in quadrant B | 4,557,453 | 456,053 |
| Events in quadrant C | 5,727,457 | 438,203 |
| Events in quadrant D | 4,576,483 | 439,756 |
| Mode M0 | |||
|---|---|---|---|
| Quadrant | BADHDUFLAG | Total packets | Discarded packets |
| A | 0 | 19162 | 3 |
| B | 0 | 19118 | 2 |
| C | 0 | 22705 | 2 |
| D | 0 | 20113 | 2 |
| Mode M9 | |||
|---|---|---|---|
| Quadrant | BADHDUFLAG | Total packets | Discarded packets |
| A | 0 | 1 | 0 |
| B | 0 | 1 | 0 |
| C | 0 | 1 | 0 |
| D | 0 | 1 | 0 |
| Mode SS | |||
|---|---|---|---|
| Quadrant | BADHDUFLAG | Total packets | Discarded packets |
| A | 0 | 178 | 0 |
| B | 0 | 178 | 0 |
| C | 0 | 178 | 0 |
| D | 0 | 178 | 0 |
| Quadrant | Total seconds | Saturated seconds | Saturation percentage |
|---|---|---|---|
| A | 8840 | 476 | 5.384615% |
| B | 8840 | 488 | 5.520362% |
| C | 8840 | 572 | 6.470588% |
| D | 8840 | 507 | 5.735294% |
Noise dominated data is calculated using 1-second bins in cleaned event files. If a bin has >2000 counts, and if more than 50% of those come from <1% of pixels, then it is considered to be noise-dominated and hence unusable.
| Quadrant | # 1 sec bins | Bins with >0 counts | Bins with >2000 counts | High rate bins dominated by noise | Noise dominated (total time) | Noise dominated (detector-on time) | Marked lightcurve |
|---|---|---|---|---|---|---|---|
| A | 8895 | 8840 | 10 | 10 | 0.11% | 0.11% | 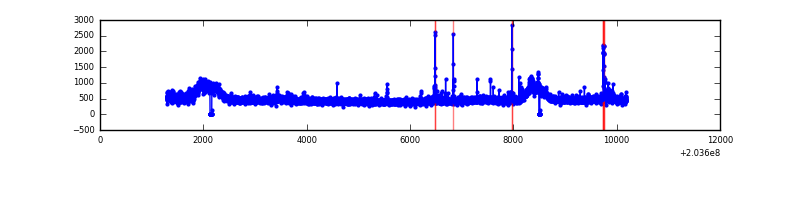 |
| B | 8895 | 8840 | 1 | 1 | 0.01% | 0.01% | 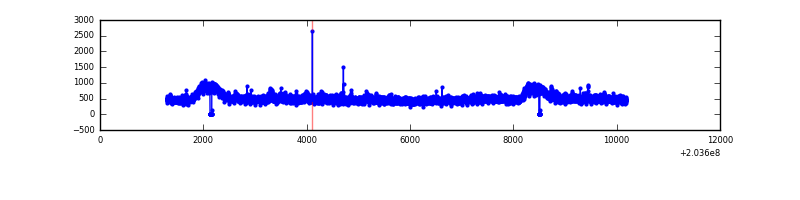 |
| C | 8895 | 8840 | 86 | 86 | 0.97% | 0.97% | 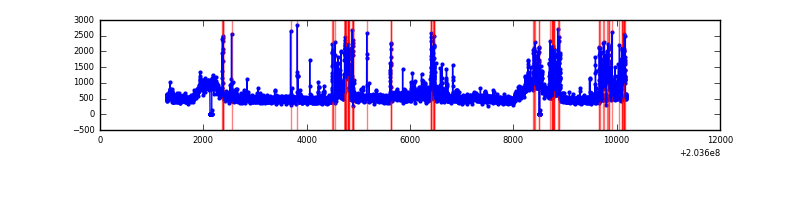 |
| D | 8895 | 8841 | 105 | 105 | 1.18% | 1.19% | 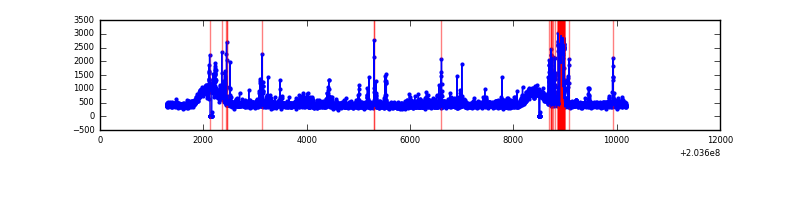 |
Top three noisy pixels from each quadrant. If the there are fewer than three noisy pixels in the level2.evt file, extra rows are filled as -1
| Pixel properties | Quadrant properties | ||||||
|---|---|---|---|---|---|---|---|
| Quadrant | DetID | PixID | Counts | Sigma | Mean | Median | Sigma |
| A | 8 | 15 | 83972 | 370.91 | 1086 | 1061 | 223.5 |
| A | 0 | 149 | 41217 | 179.64 | 1086 | 1061 | 223.5 |
| A | 0 | 50 | 40012 | 174.25 | 1086 | 1061 | 223.5 |
| B | 15 | 204 | 243111 | 1119.26 | 1094 | 1067 | 216.3 |
| B | 14 | 167 | 59545 | 270.41 | 1094 | 1067 | 216.3 |
| B | 12 | 111 | 19967 | 87.4 | 1094 | 1067 | 216.3 |
| C | 2 | 53 | 1566745 | 6393.63 | 1037 | 1038 | 244.9 |
| C | 10 | 65 | 28487 | 112.09 | 1037 | 1038 | 244.9 |
| C | 8 | 128 | 26644 | 104.56 | 1037 | 1038 | 244.9 |
| D | 8 | 112 | 285984 | 1016.18 | 1039 | 1011 | 280.4 |
| D | 2 | 63 | 123110 | 435.39 | 1039 | 1011 | 280.4 |
| D | 12 | 227 | 83049 | 292.54 | 1039 | 1011 | 280.4 |
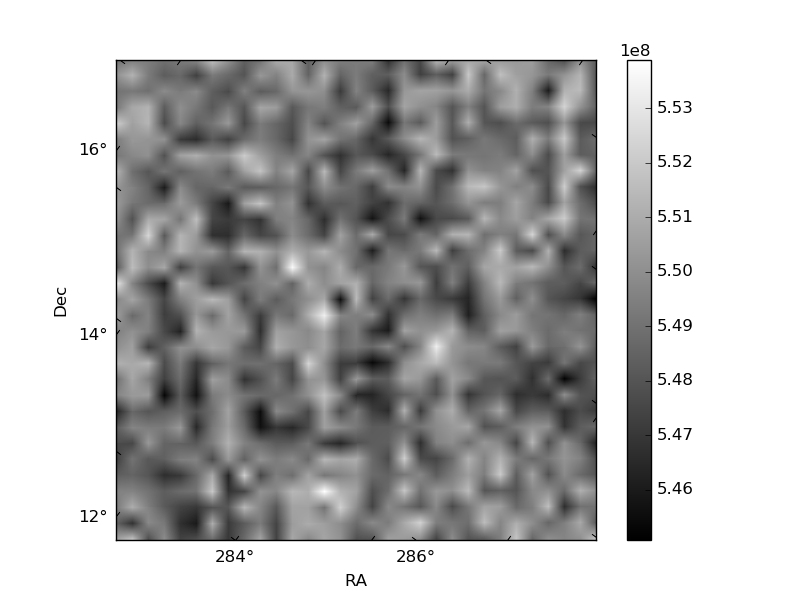
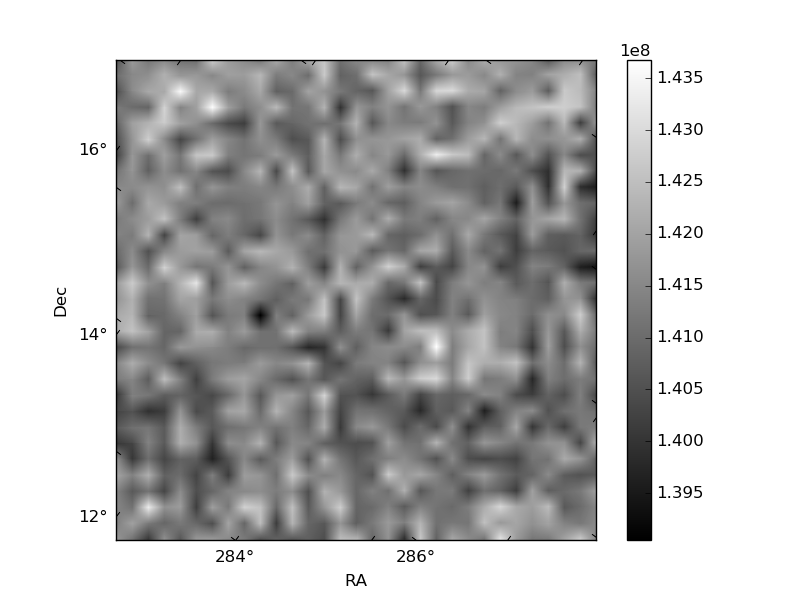
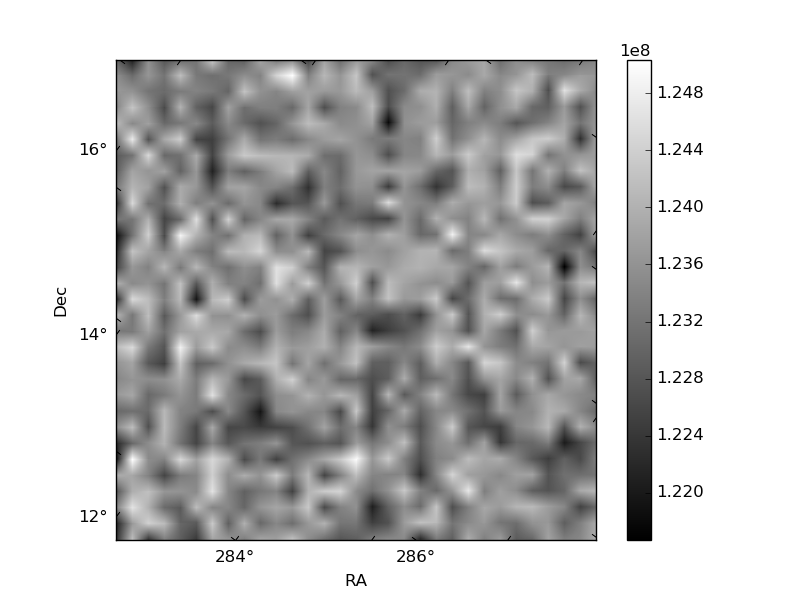
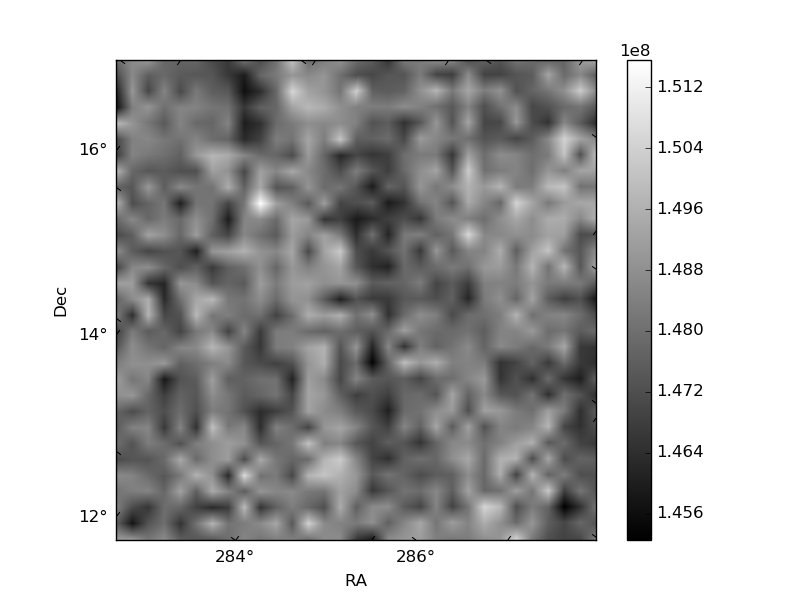
Histogram calculated using DETX and DETY for each event in the final _common_clean file
| Quadrant A | 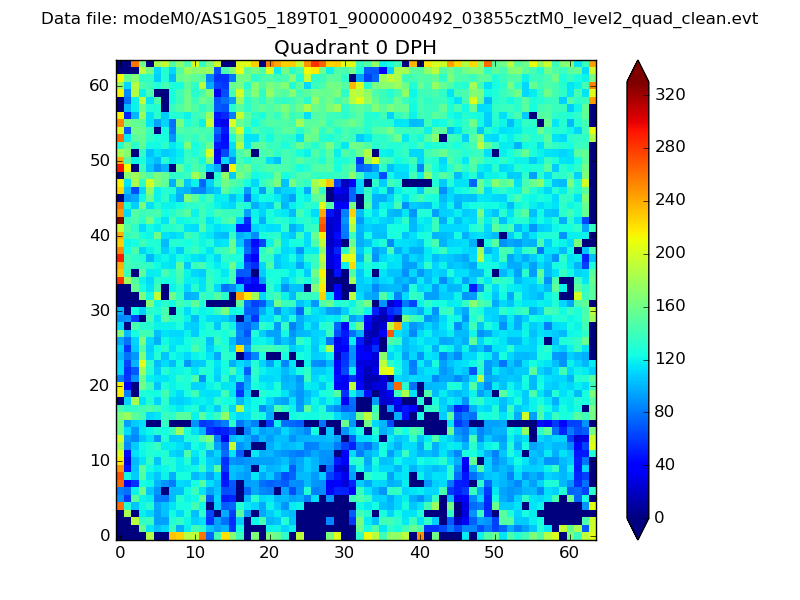 |
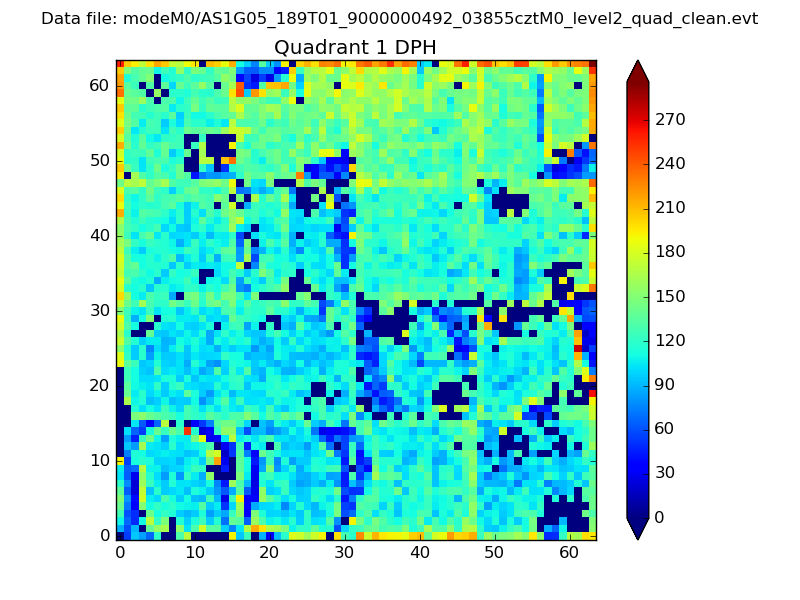 |
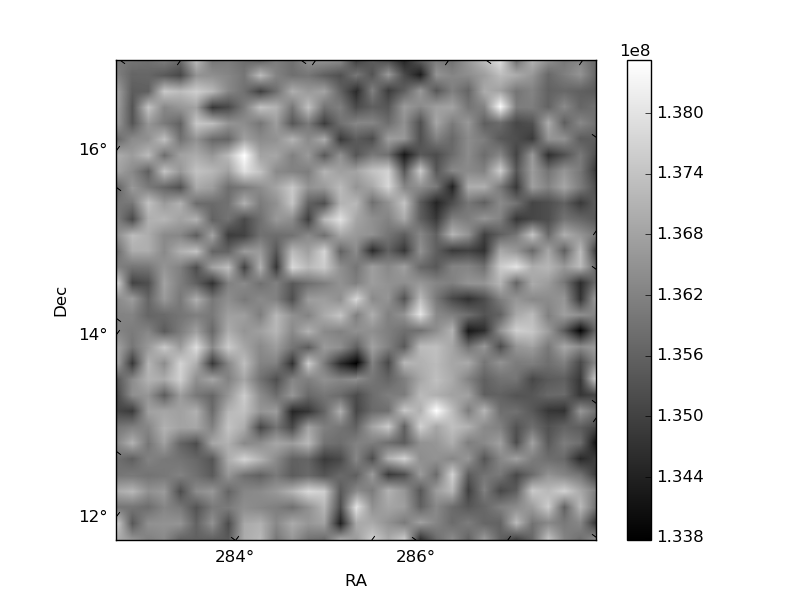
Quadrant B |
|---|---|---|---|
| Quadrant D | 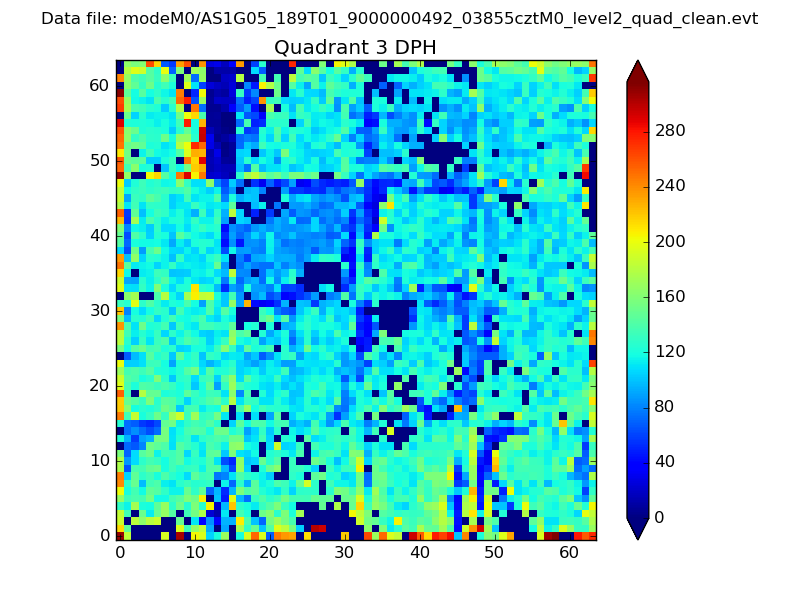 |
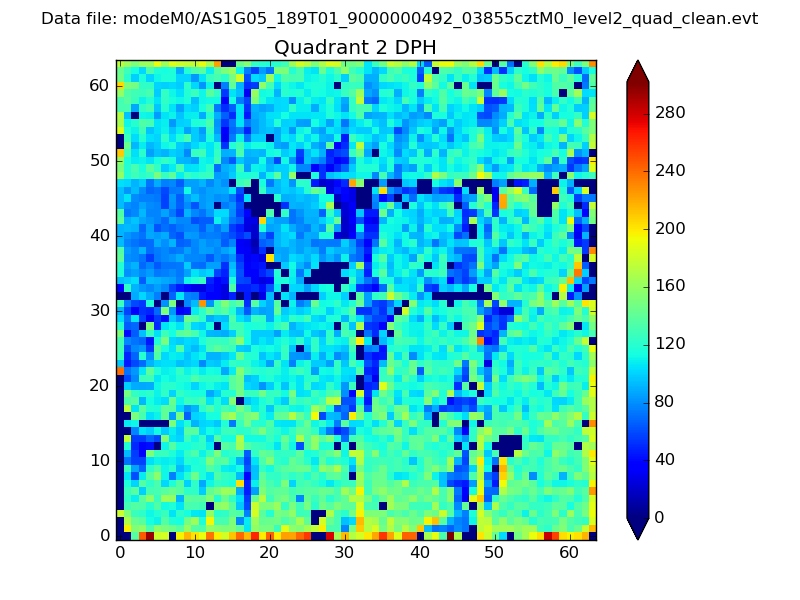 |
Quadrant C |
| Plot type | Count rate plots | Images |
|---|---|---|
| Comparison with Poisson distribution Blue bars denote a histogram of data divided into 1 sec bins. Red curve is a Poisson curve with rate = median count rate of data. |
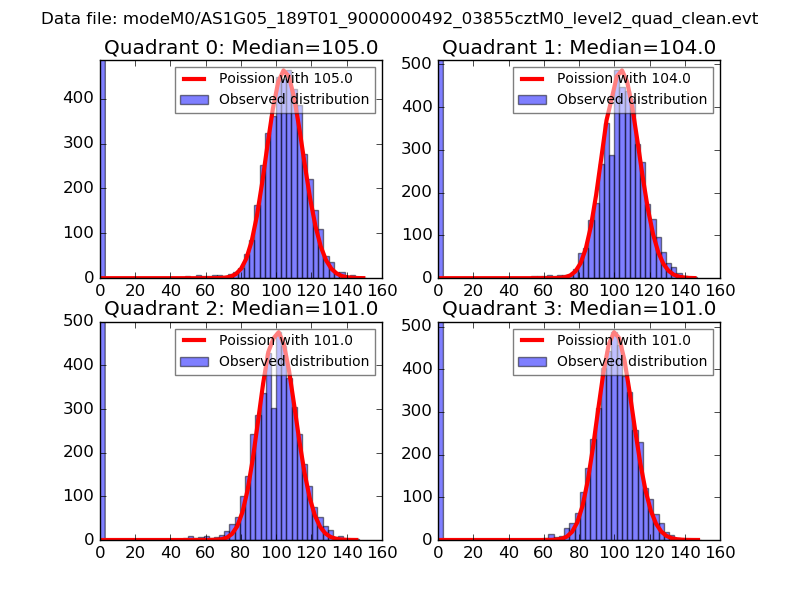 |
 |
| Quadrant-wise count rates Data is divided into 100 sec bins |
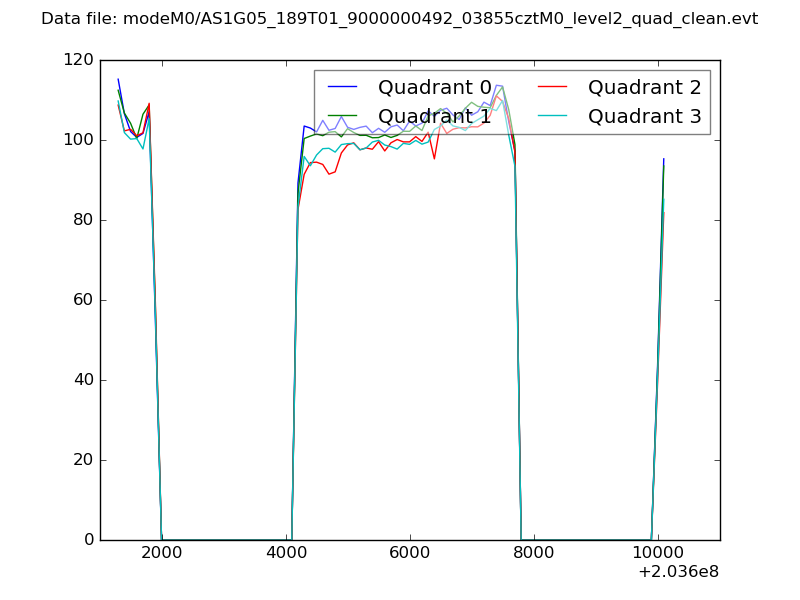 |
|
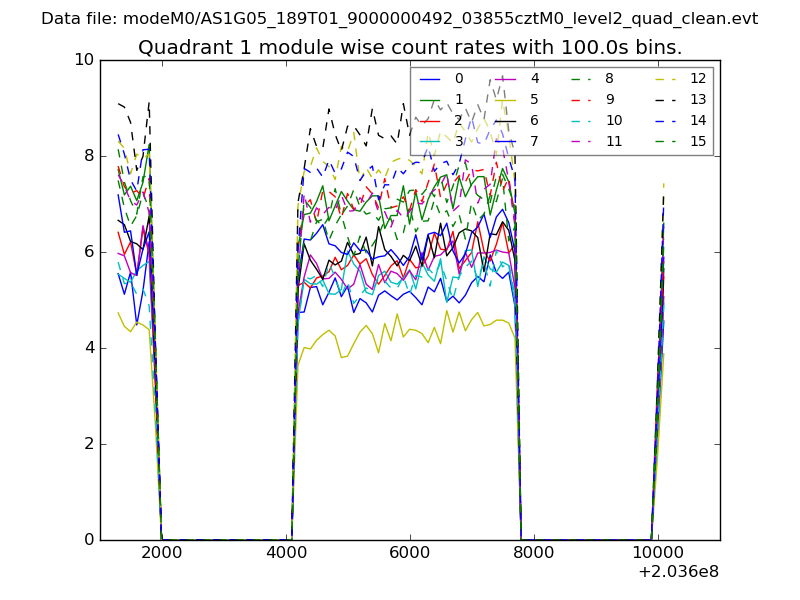
| Module-wise count rates for Quadrant A Data is divided into 100 sec bins |
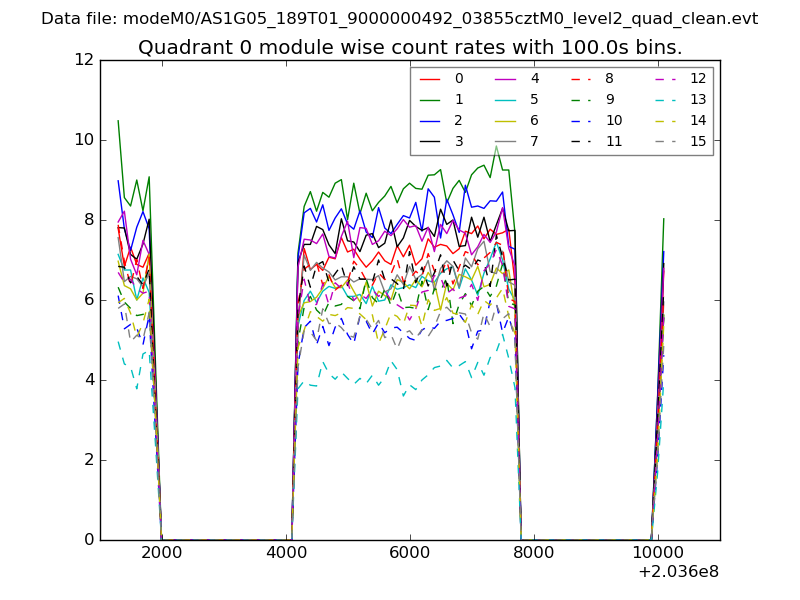 |
 |
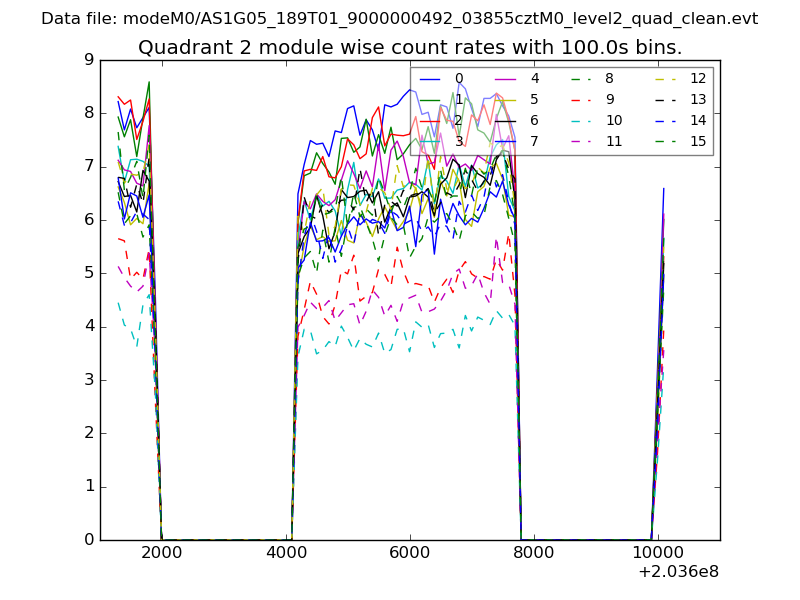
| Module-wise count rates for Quadrant B Data is divided into 100 sec bins |
 |
 |
| Module-wise count rates for Quadrant C Data is divided into 100 sec bins |
 |
 |
| Module-wise count rates for Quadrant D Data is divided into 100 sec bins |
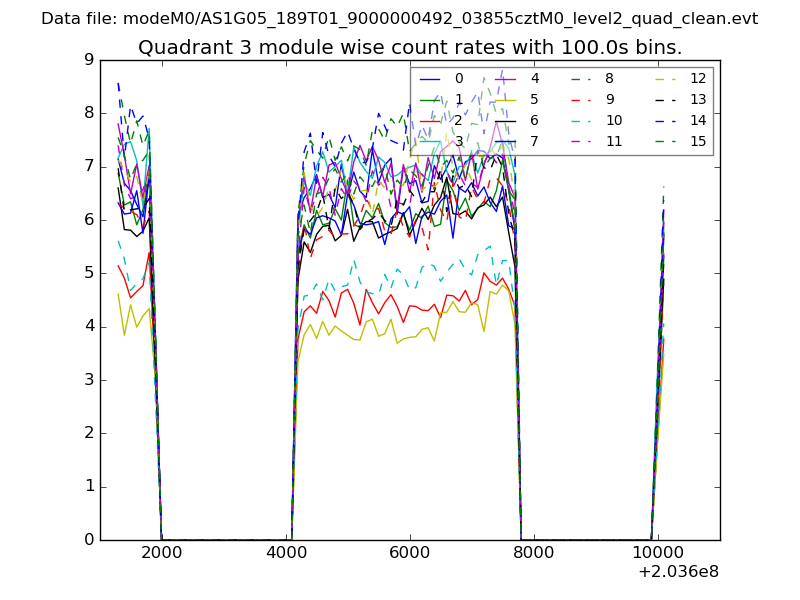 |
 |
| Parameter | Plot |
|---|---|
| CZT HV Monitor | 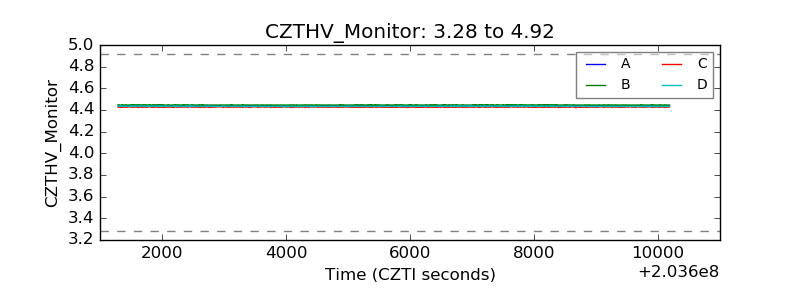 |
| D_VDD |  |
| Temperature 1 | 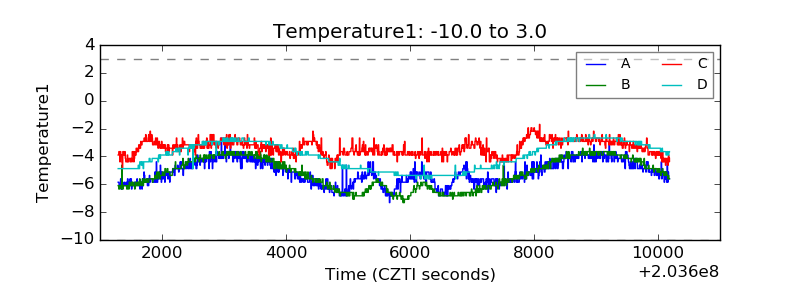 |
| Veto HV Monitor | 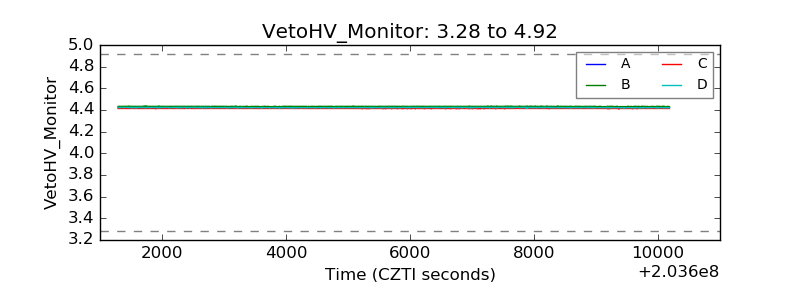 |
| Veto LLD | 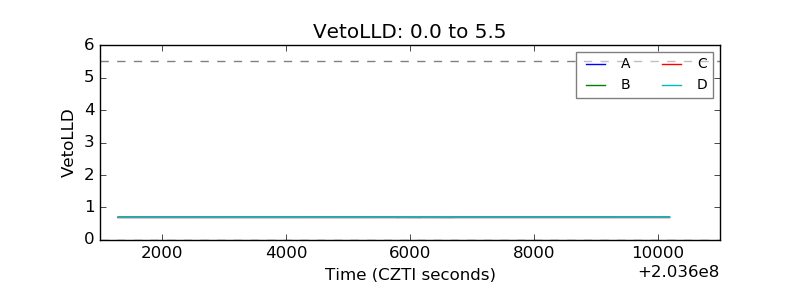 |
| Alpha Counter | 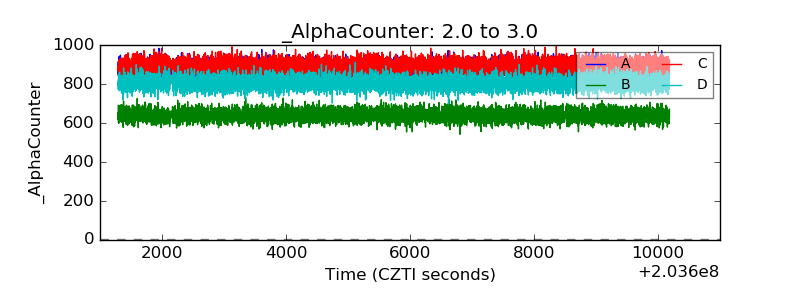 |
| _CPM_Rate | 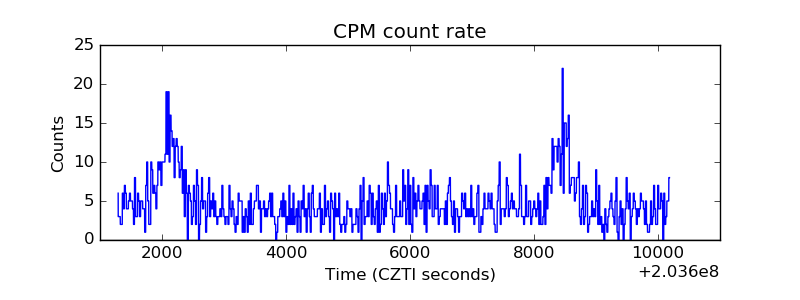 |
| CZT Counter | 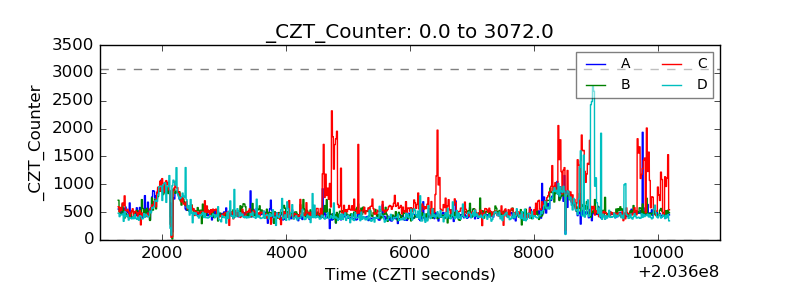 |
| +2.5 Volts monitor |  |
| +5 Volts monitor |  |
| Veto Counter | 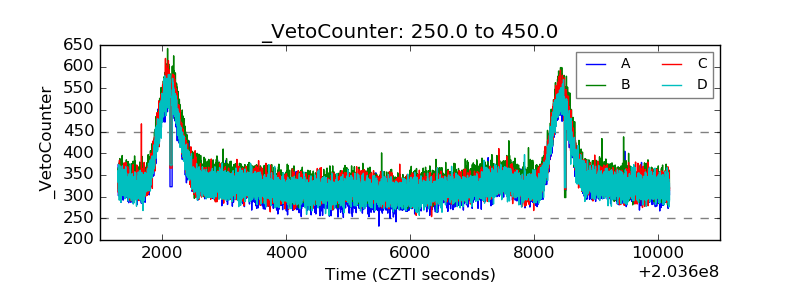 |