| Param | Original file | Final file |
|---|---|---|
| Filename | modeM0/AS1G05_189T01_9000000492_03856cztM0_level2.evt | modeM0/AS1G05_189T01_9000000492_03856cztM0_level2_quad_clean.evt |
| Size (bytes) | 613,471,680 | 65,741,760 |
| Size | 585.1 MB | 62.7 MB |
| Events in quadrant A | 3,423,745 | 390,650 |
| Events in quadrant B | 3,584,802 | 387,392 |
| Events in quadrant C | 5,792,275 | 367,117 |
| Events in quadrant D | 5,295,805 | 349,549 |
| Mode M0 | |||
|---|---|---|---|
| Quadrant | BADHDUFLAG | Total packets | Discarded packets |
| A | 0 | 15152 | 5 |
| B | 0 | 15333 | 4 |
| C | 0 | 22207 | 8 |
| D | 0 | 20924 | 14 |
| Mode M9 | |||
|---|---|---|---|
| Quadrant | BADHDUFLAG | Total packets | Discarded packets |
| A | 0 | 4 | 0 |
| B | 0 | 4 | 0 |
| C | 0 | 4 | 0 |
| D | 0 | 4 | 0 |
| Mode SS | |||
|---|---|---|---|
| Quadrant | BADHDUFLAG | Total packets | Discarded packets |
| A | 0 | 146 | 0 |
| B | 0 | 146 | 0 |
| C | 0 | 146 | 0 |
| D | 0 | 146 | 0 |
| Quadrant | Total seconds | Saturated seconds | Saturation percentage |
|---|---|---|---|
| A | 7116 | 309 | 4.342327% |
| B | 7116 | 353 | 4.960652% |
| C | 7115 | 540 | 7.589599% |
| D | 7115 | 909 | 12.775826% |
Noise dominated data is calculated using 1-second bins in cleaned event files. If a bin has >2000 counts, and if more than 50% of those come from <1% of pixels, then it is considered to be noise-dominated and hence unusable.
| Quadrant | # 1 sec bins | Bins with >0 counts | Bins with >2000 counts | High rate bins dominated by noise | Noise dominated (total time) | Noise dominated (detector-on time) | Marked lightcurve |
|---|---|---|---|---|---|---|---|
| A | 7467 | 7117 | 7 | 7 | 0.09% | 0.10% | 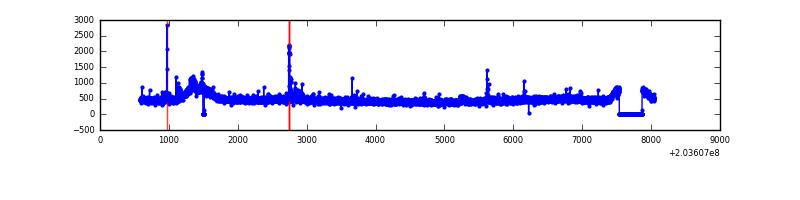 |
| B | 7467 | 7117 | 2 | 2 | 0.03% | 0.03% | 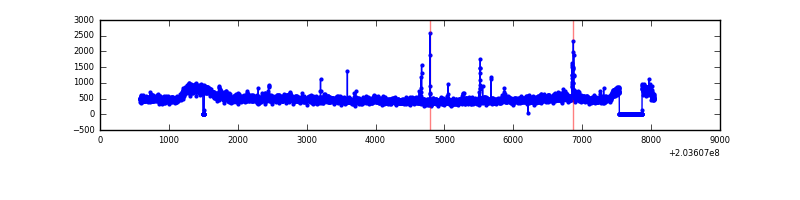 |
| C | 7467 | 7117 | 148 | 148 | 1.98% | 2.08% | 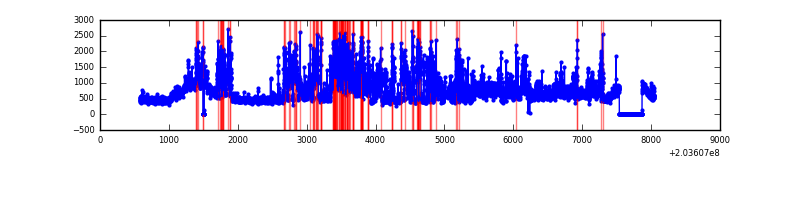 |
| D | 7467 | 7118 | 653 | 653 | 8.75% | 9.17% | 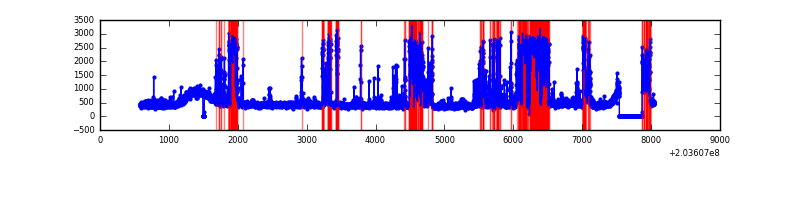 |
Top three noisy pixels from each quadrant. If the there are fewer than three noisy pixels in the level2.evt file, extra rows are filled as -1
| Pixel properties | Quadrant properties | ||||||
|---|---|---|---|---|---|---|---|
| Quadrant | DetID | PixID | Counts | Sigma | Mean | Median | Sigma |
| A | 0 | 50 | 38126 | 212.73 | 850 | 831 | 175.3 |
| A | 8 | 15 | 36246 | 202.01 | 850 | 831 | 175.3 |
| A | 0 | 149 | 29573 | 163.95 | 850 | 831 | 175.3 |
| B | 15 | 204 | 158292 | 932.44 | 856 | 834 | 168.9 |
| B | 14 | 167 | 74491 | 436.18 | 856 | 834 | 168.9 |
| B | 10 | 249 | 17834 | 100.67 | 856 | 834 | 168.9 |
| C | 2 | 53 | 2522137 | 13276.82 | 805 | 807 | 189.9 |
| C | 9 | 247 | 86423 | 450.84 | 805 | 807 | 189.9 |
| C | 10 | 65 | 10699 | 52.09 | 805 | 807 | 189.9 |
| D | 8 | 112 | 1813174 | 9407.87 | 792 | 766 | 192.6 |
| D | 13 | 248 | 314999 | 1631.12 | 792 | 766 | 192.6 |
| D | 2 | 63 | 64688 | 331.81 | 792 | 766 | 192.6 |
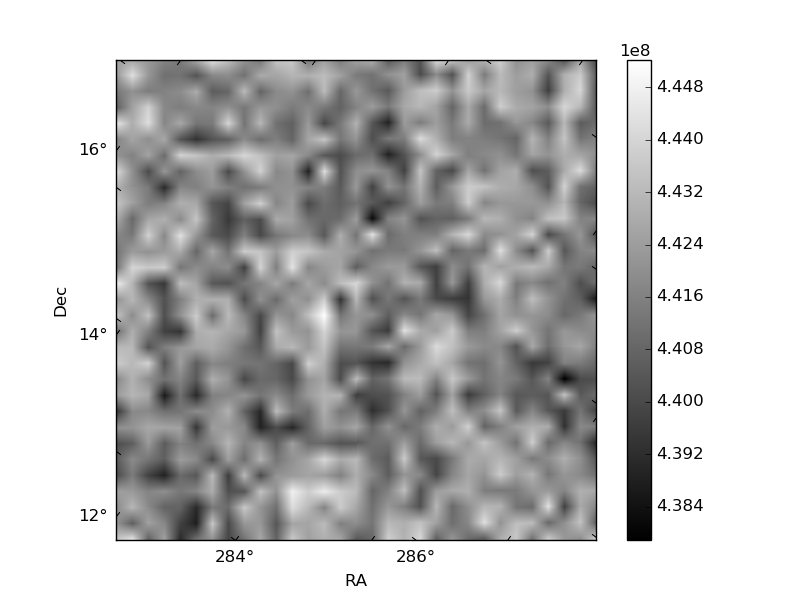
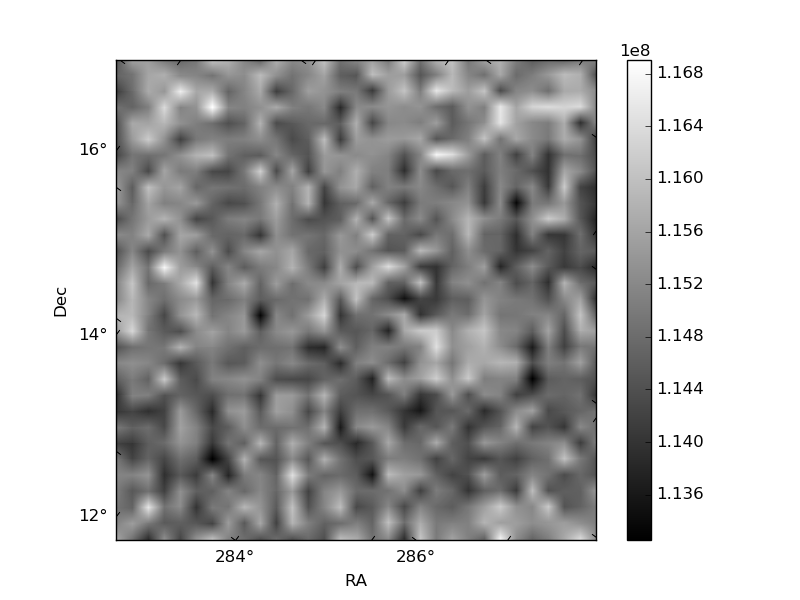
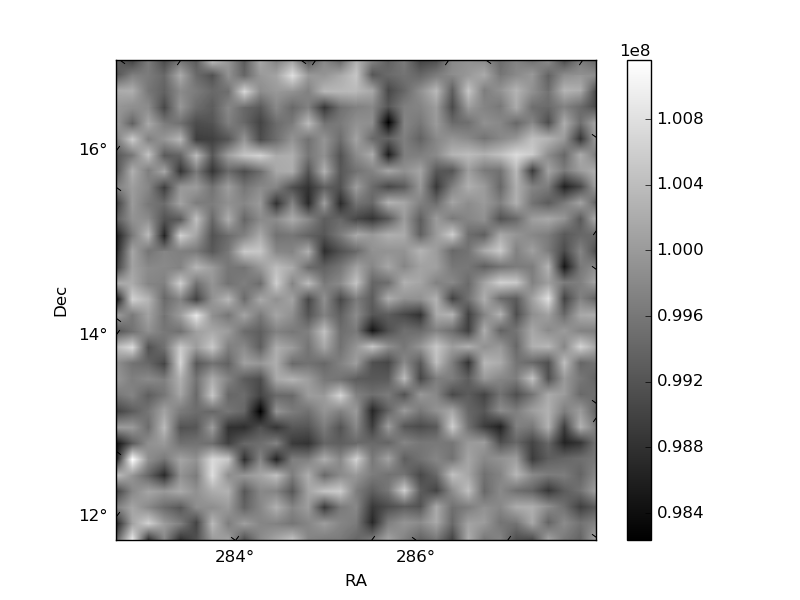
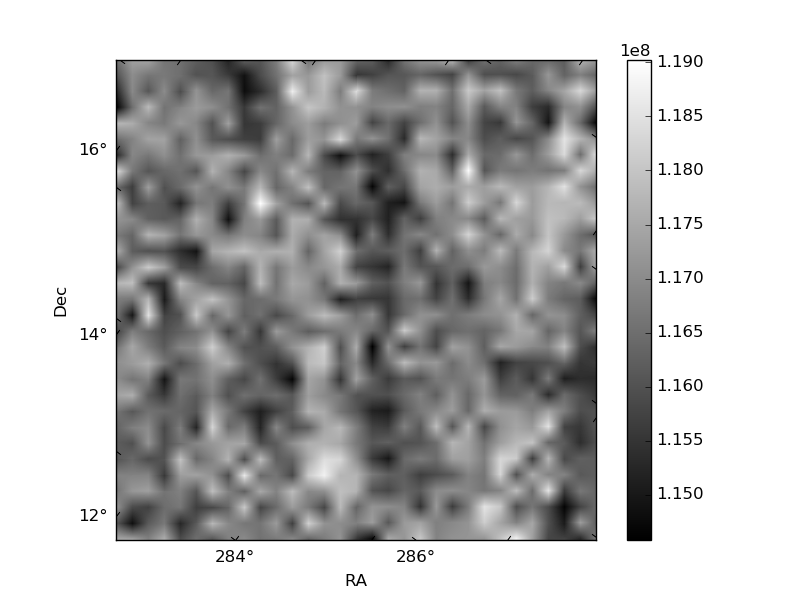
Histogram calculated using DETX and DETY for each event in the final _common_clean file
| Quadrant A | 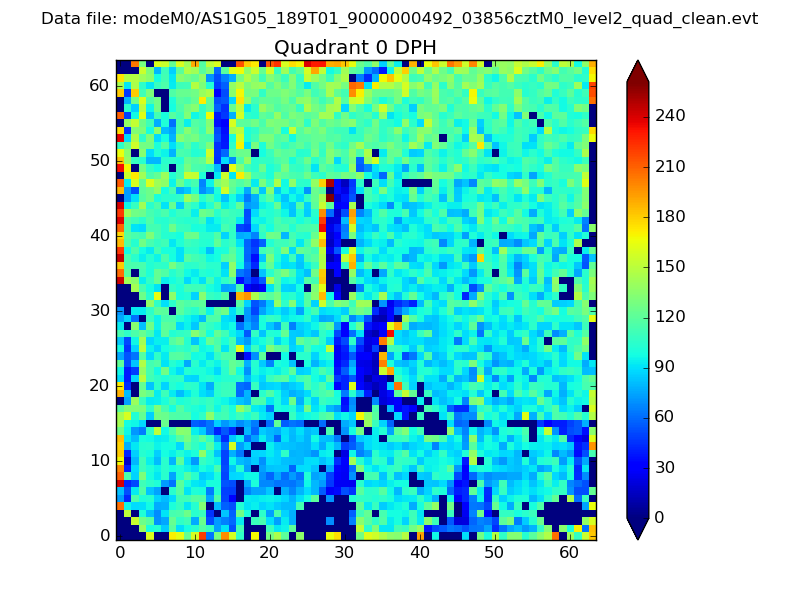 |
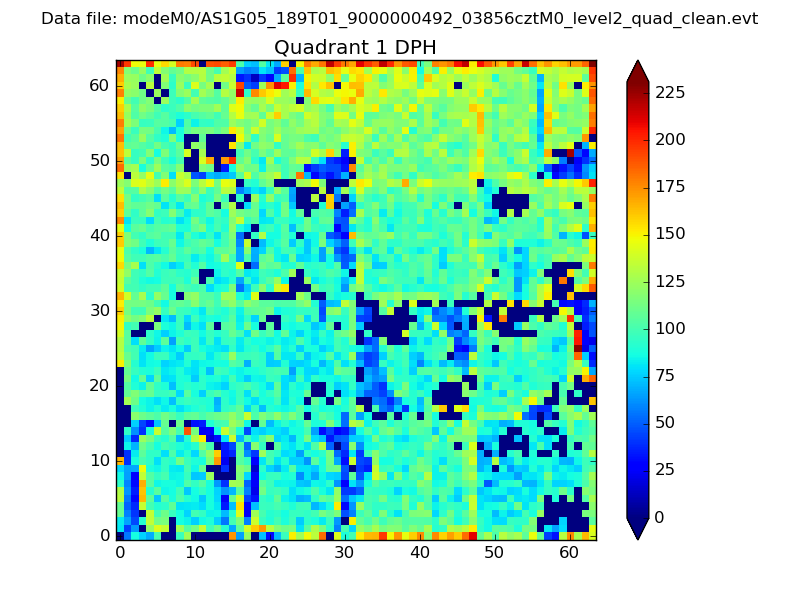 |
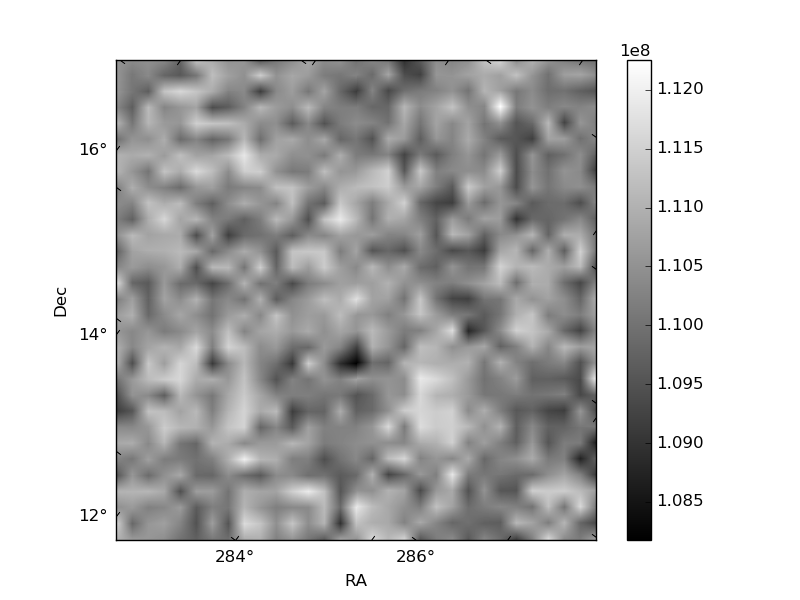
Quadrant B |
|---|---|---|---|
| Quadrant D | 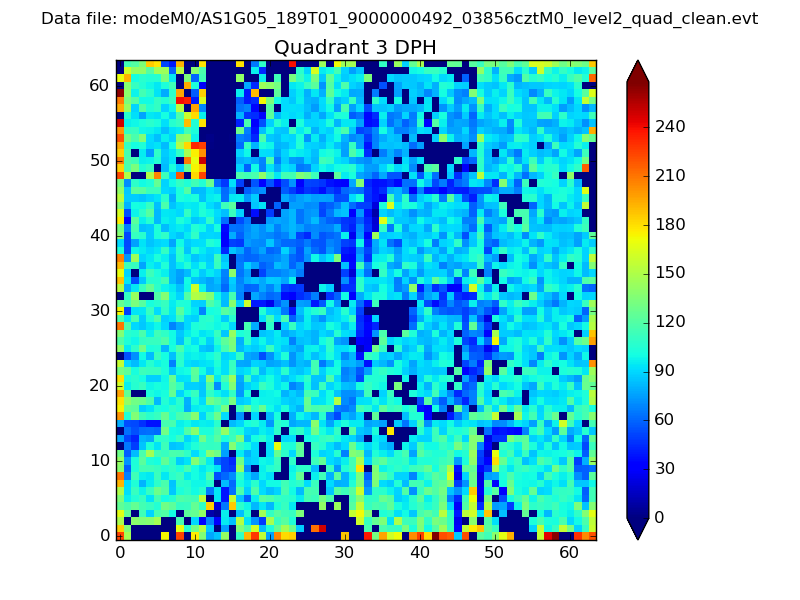 |
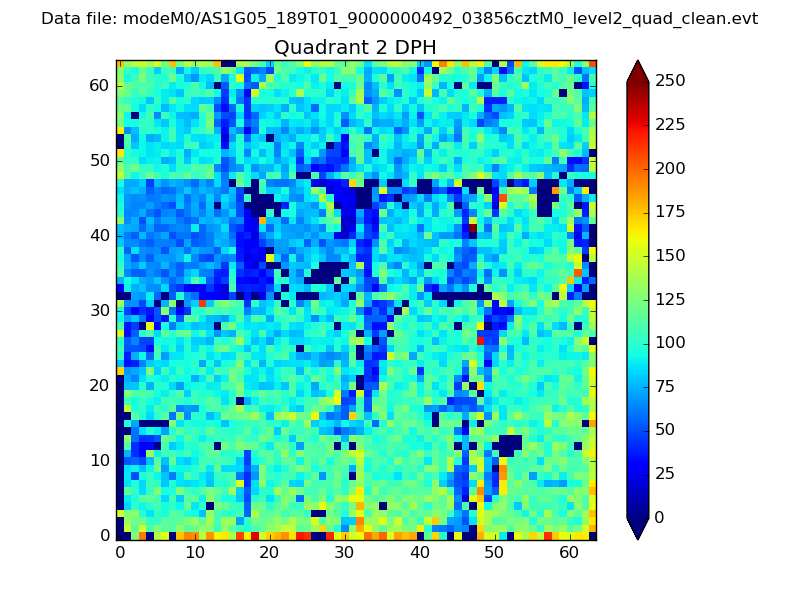 |
Quadrant C |
| Plot type | Count rate plots | Images |
|---|---|---|
| Comparison with Poisson distribution Blue bars denote a histogram of data divided into 1 sec bins. Red curve is a Poisson curve with rate = median count rate of data. |
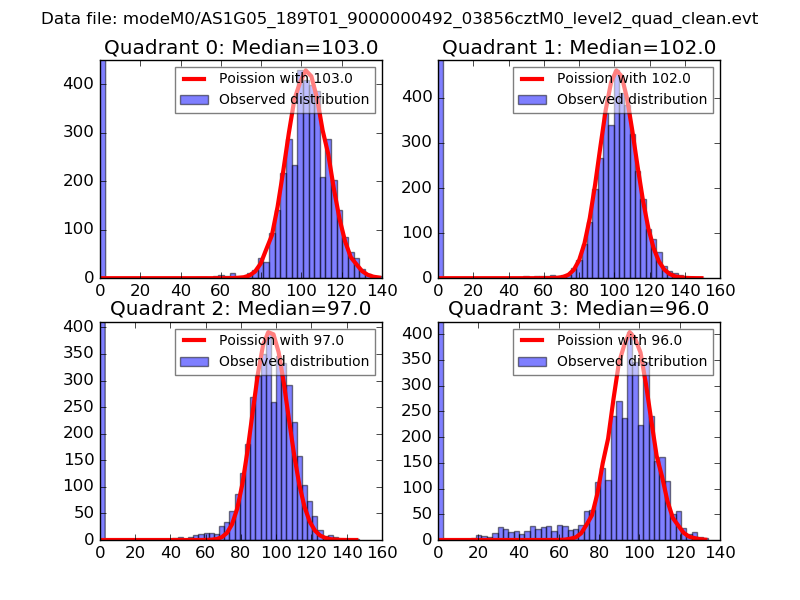 |
 |
| Quadrant-wise count rates Data is divided into 100 sec bins |
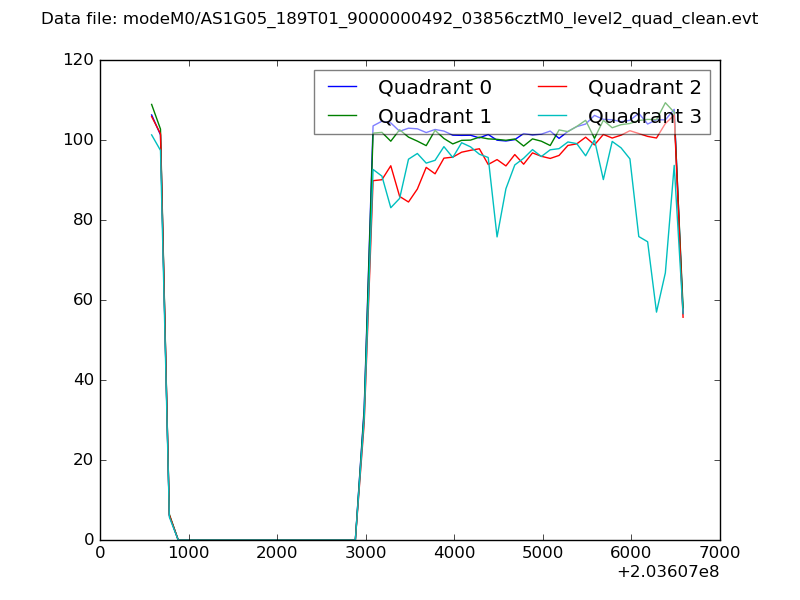 |
|
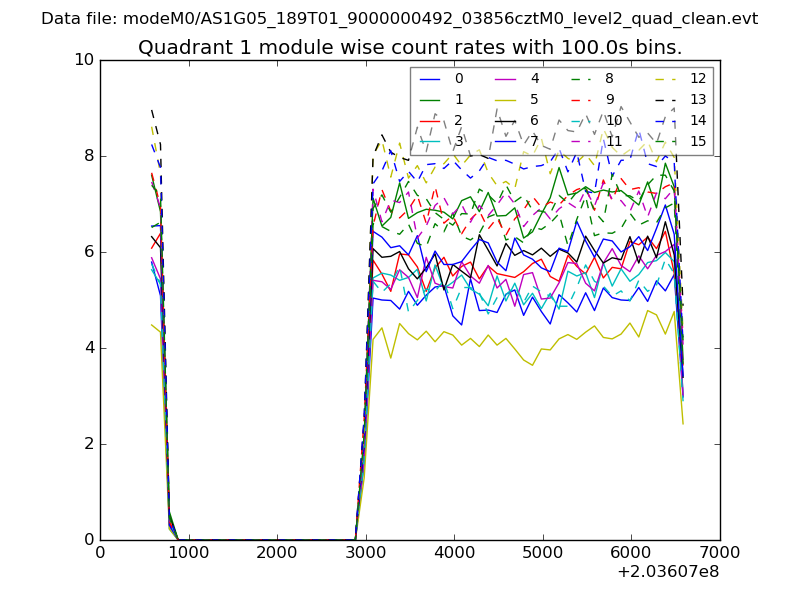
| Module-wise count rates for Quadrant A Data is divided into 100 sec bins |
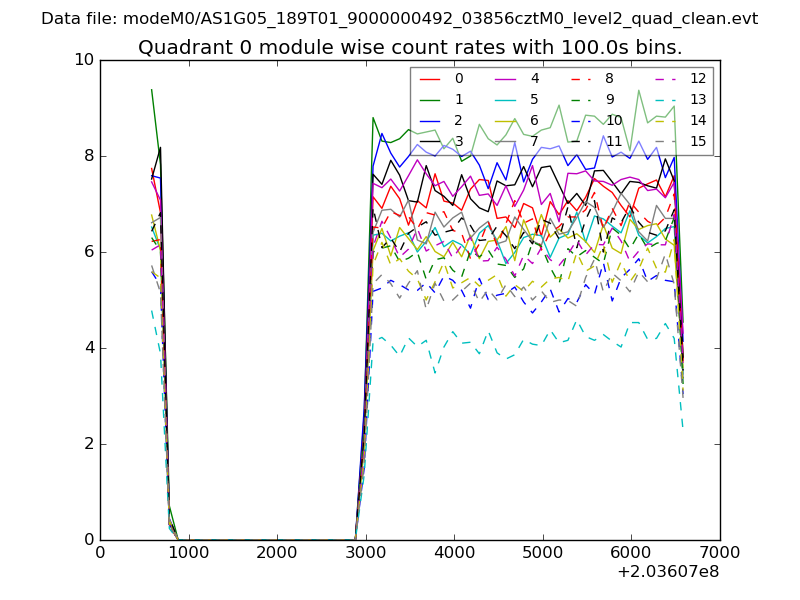 |
 |
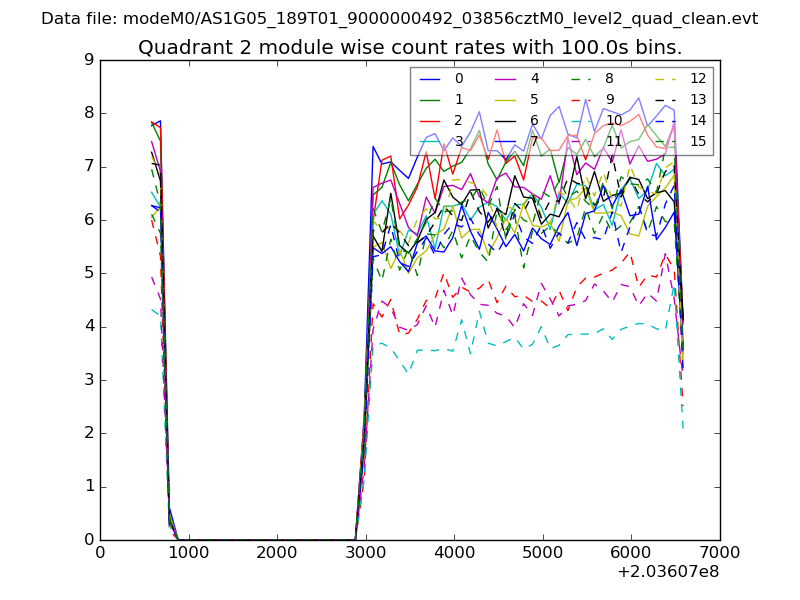
| Module-wise count rates for Quadrant B Data is divided into 100 sec bins |
 |
 |
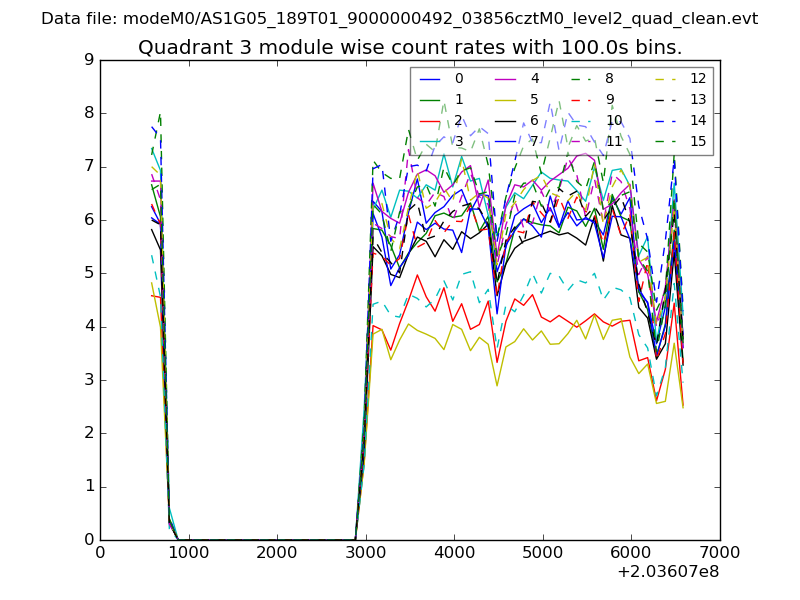
| Module-wise count rates for Quadrant C Data is divided into 100 sec bins |
 |
 |
| Module-wise count rates for Quadrant D Data is divided into 100 sec bins |
 |
 |
| Parameter | Plot |
|---|---|
| CZT HV Monitor | 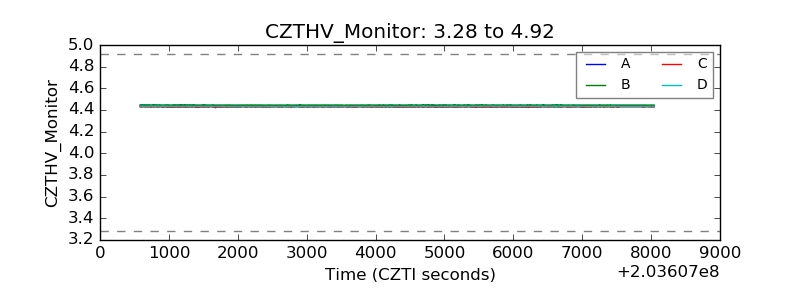 |
| D_VDD | 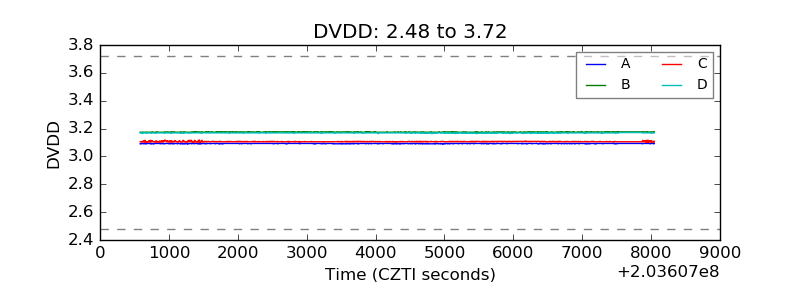 |
| Temperature 1 | 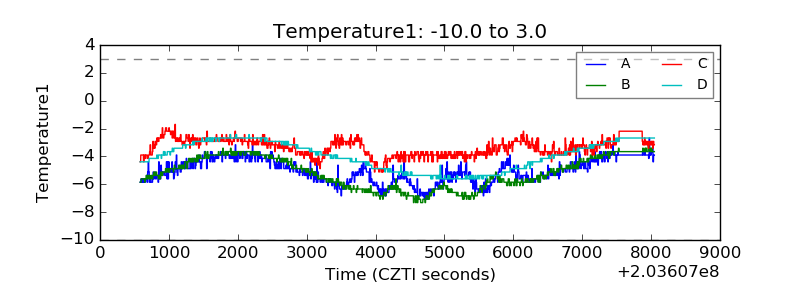 |
| Veto HV Monitor | 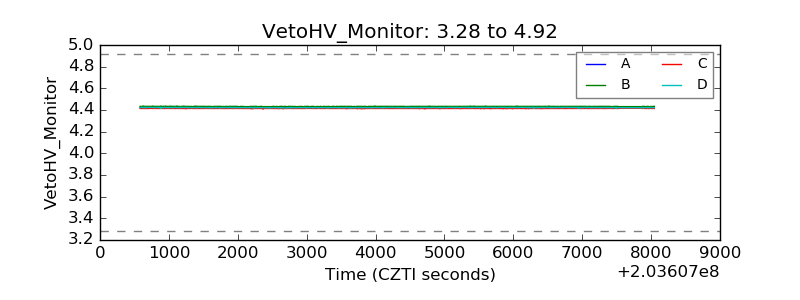 |
| Veto LLD | 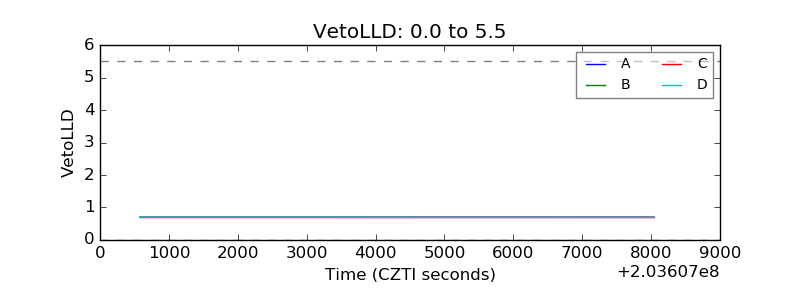 |
| Alpha Counter | 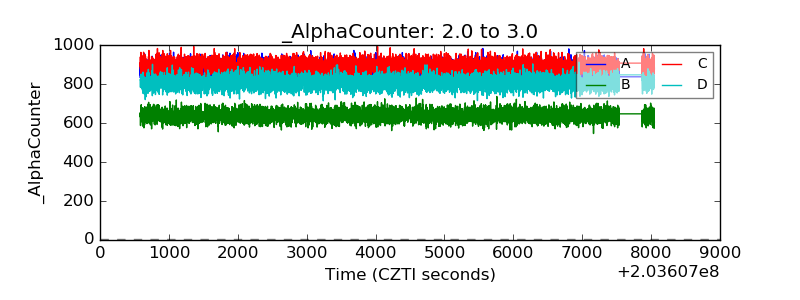 |
| _CPM_Rate | 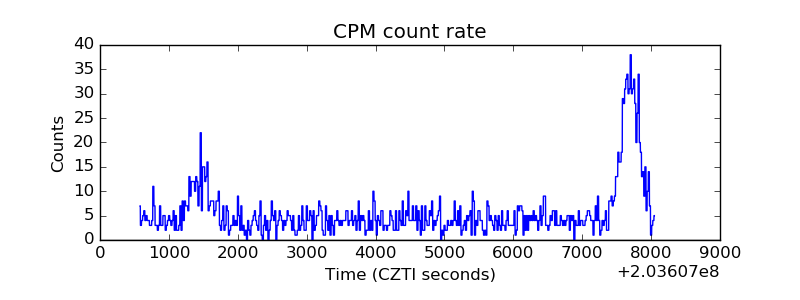 |
| CZT Counter | 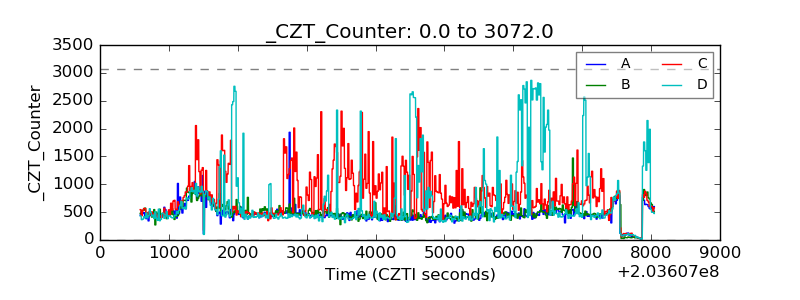 |
| +2.5 Volts monitor |  |
| +5 Volts monitor |  |
| Veto Counter | 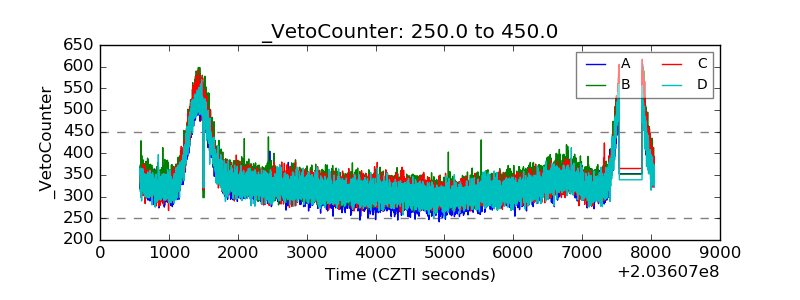 |