| Param | Original file | Final file |
|---|---|---|
| Filename | modeM0/AS1G05_189T01_9000000492_03858cztM0_level2.evt | modeM0/AS1G05_189T01_9000000492_03858cztM0_level2_quad_clean.evt |
| Size (bytes) | 1,175,045,760 | 140,935,680 |
| Size | 1.1 GB | 134.4 MB |
| Events in quadrant A | 6,597,074 | 890,587 |
| Events in quadrant B | 6,301,820 | 884,911 |
| Events in quadrant C | 15,107,385 | 770,788 |
| Events in quadrant D | 6,714,679 | 835,463 |
| Mode M0 | |||
|---|---|---|---|
| Quadrant | BADHDUFLAG | Total packets | Discarded packets |
| A | 0 | 28539 | 3 |
| B | 0 | 27157 | 2 |
| C | 0 | 53442 | 2 |
| D | 0 | 29532 | 2 |
| Mode M9 | |||
|---|---|---|---|
| Quadrant | BADHDUFLAG | Total packets | Discarded packets |
| A | 0 | 14 | 0 |
| B | 0 | 14 | 0 |
| C | 0 | 14 | 0 |
| D | 0 | 14 | 0 |
| Mode SS | |||
|---|---|---|---|
| Quadrant | BADHDUFLAG | Total packets | Discarded packets |
| A | 0 | 260 | 0 |
| B | 0 | 260 | 0 |
| C | 0 | 260 | 0 |
| D | 0 | 260 | 0 |
| Quadrant | Total seconds | Saturated seconds | Saturation percentage |
|---|---|---|---|
| A | 12809 | 106 | 0.827543% |
| B | 12809 | 80 | 0.624561% |
| C | 12809 | 3557 | 27.769537% |
| D | 12809 | 376 | 2.935436% |
Noise dominated data is calculated using 1-second bins in cleaned event files. If a bin has >2000 counts, and if more than 50% of those come from <1% of pixels, then it is considered to be noise-dominated and hence unusable.
| Quadrant | # 1 sec bins | Bins with >0 counts | Bins with >2000 counts | High rate bins dominated by noise | Noise dominated (total time) | Noise dominated (detector-on time) | Marked lightcurve |
|---|---|---|---|---|---|---|---|
| A | 14134 | 12810 | 24 | 24 | 0.17% | 0.19% | 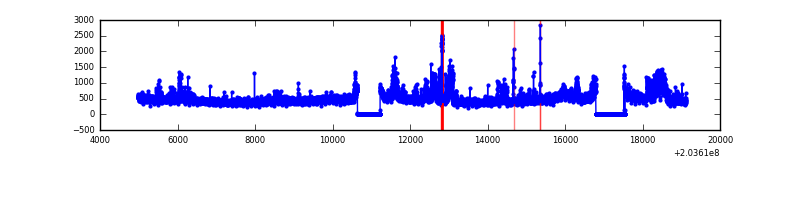 |
| B | 14134 | 12810 | 4 | 4 | 0.03% | 0.03% | 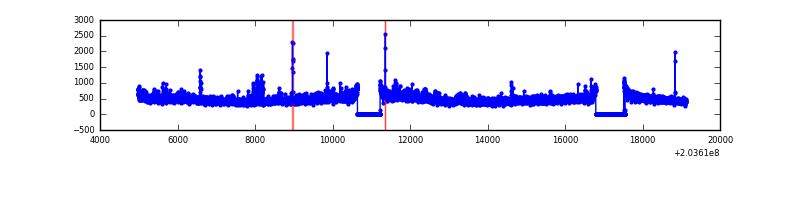 |
| C | 14134 | 12809 | 3417 | 3417 | 24.18% | 26.68% | 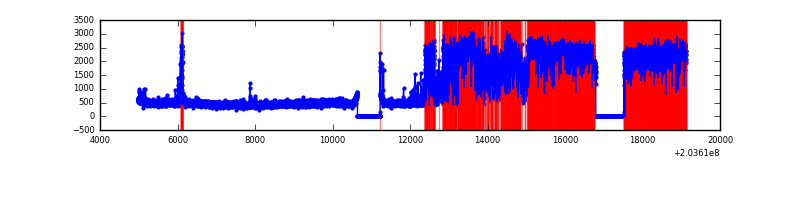 |
| D | 14134 | 12811 | 343 | 343 | 2.43% | 2.68% | 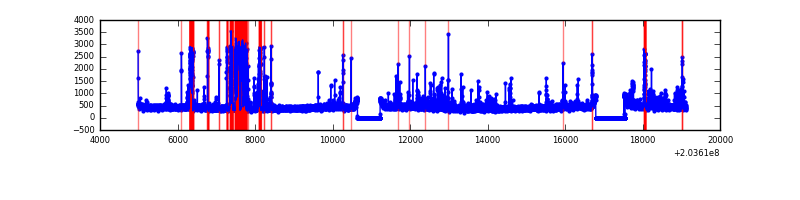 |
Top three noisy pixels from each quadrant. If the there are fewer than three noisy pixels in the level2.evt file, extra rows are filled as -1
| Pixel properties | Quadrant properties | ||||||
|---|---|---|---|---|---|---|---|
| Quadrant | DetID | PixID | Counts | Sigma | Mean | Median | Sigma |
| A | 15 | 234 | 842314 | 2827.16 | 1449 | 1418 | 297.4 |
| A | 8 | 15 | 142117 | 473.04 | 1449 | 1418 | 297.4 |
| A | 0 | 50 | 17947 | 55.57 | 1449 | 1418 | 297.4 |
| B | 15 | 204 | 404971 | 1418.12 | 1469 | 1432 | 284.6 |
| B | 14 | 167 | 135641 | 471.64 | 1469 | 1432 | 284.6 |
| B | 4 | 81 | 36628 | 123.69 | 1469 | 1432 | 284.6 |
| C | 2 | 53 | 9848254 | 32695.55 | 1291 | 1295 | 301.2 |
| C | 9 | 247 | 95345 | 312.28 | 1291 | 1295 | 301.2 |
| C | 1 | 241 | 47210 | 152.45 | 1291 | 1295 | 301.2 |
| D | 8 | 112 | 1110596 | 2990.69 | 1385 | 1357 | 370.9 |
| D | 13 | 223 | 66531 | 175.72 | 1385 | 1357 | 370.9 |
| D | 2 | 206 | 64972 | 171.52 | 1385 | 1357 | 370.9 |
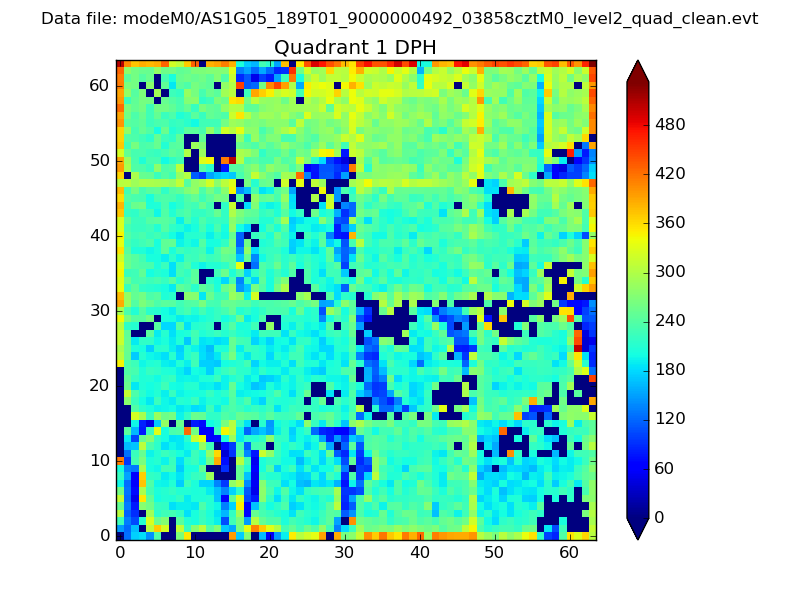
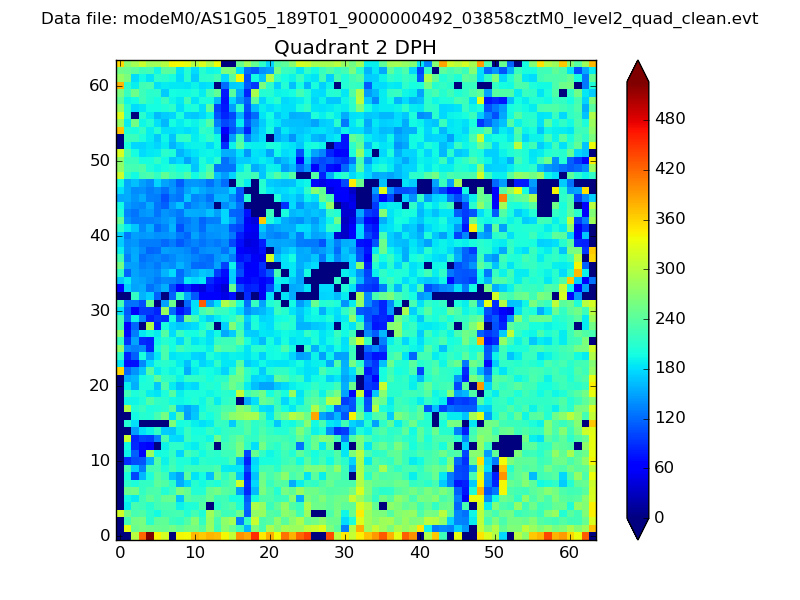
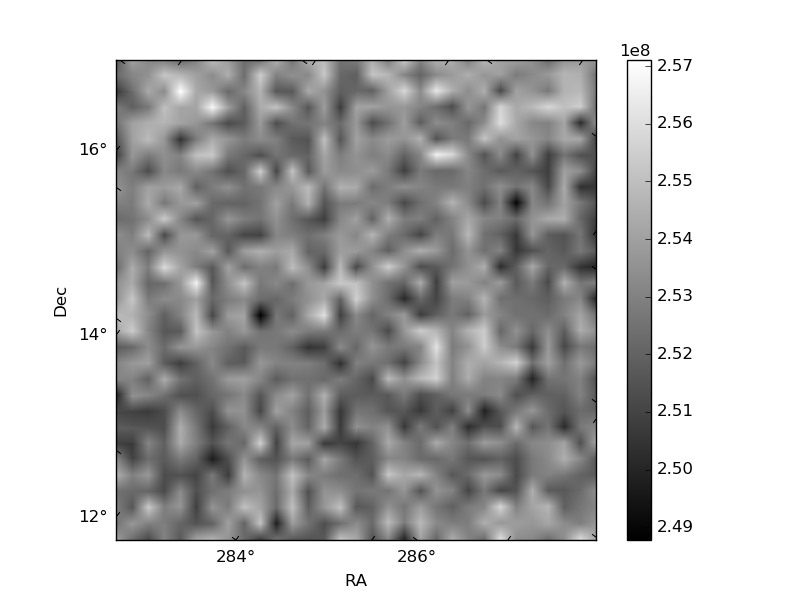
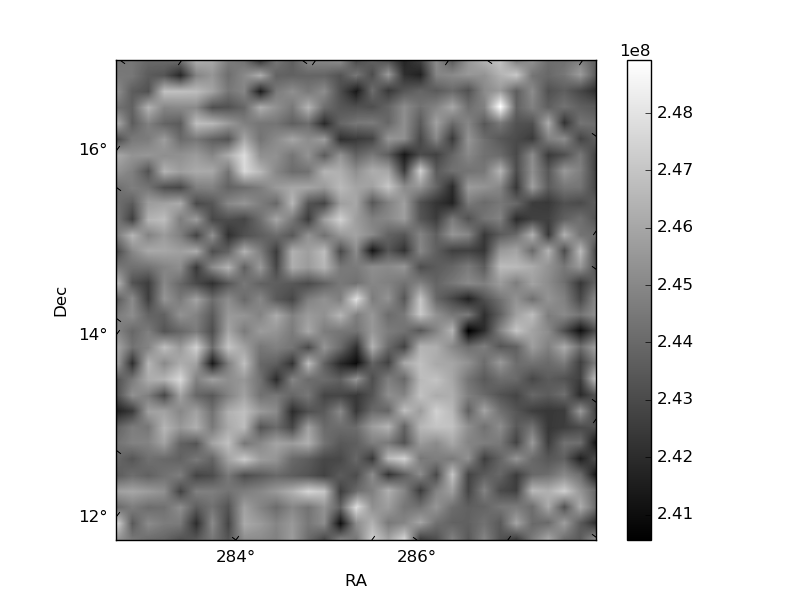
Histogram calculated using DETX and DETY for each event in the final _common_clean file
| Quadrant A |  |
 |
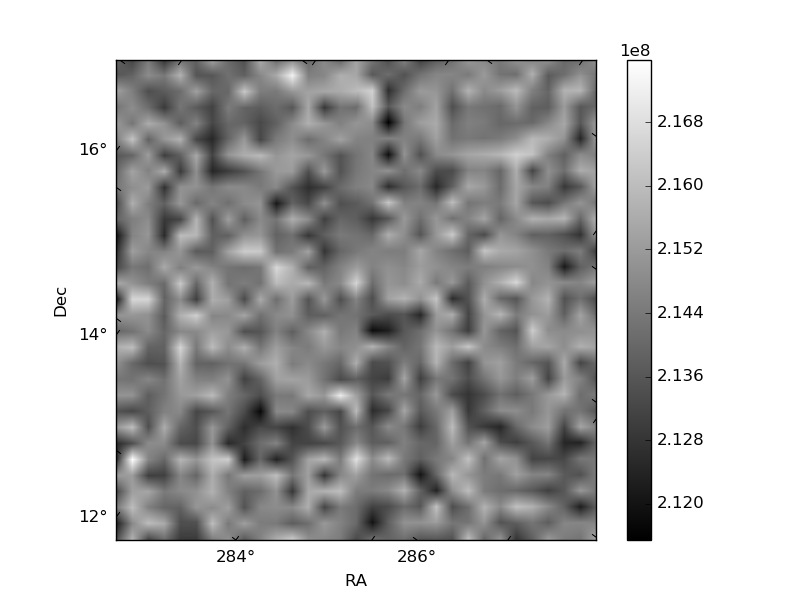
Quadrant B |
|---|---|---|---|
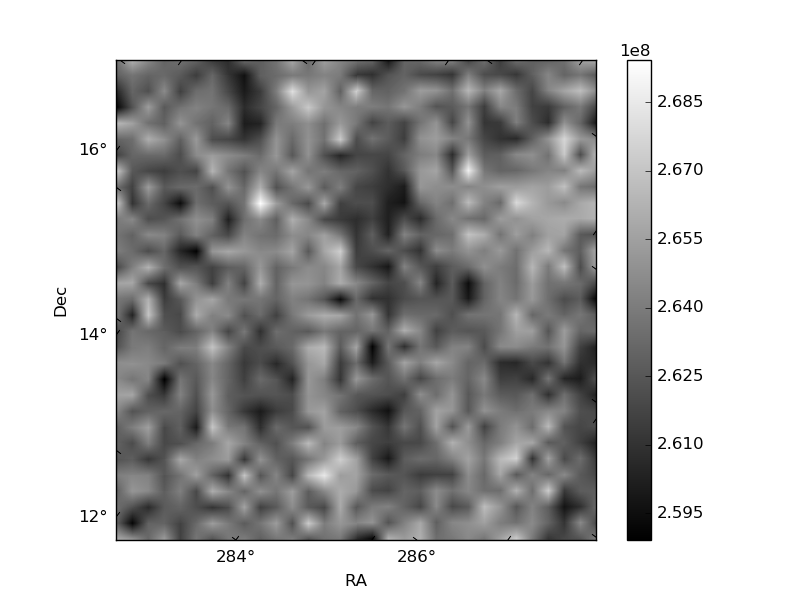
| Quadrant D | 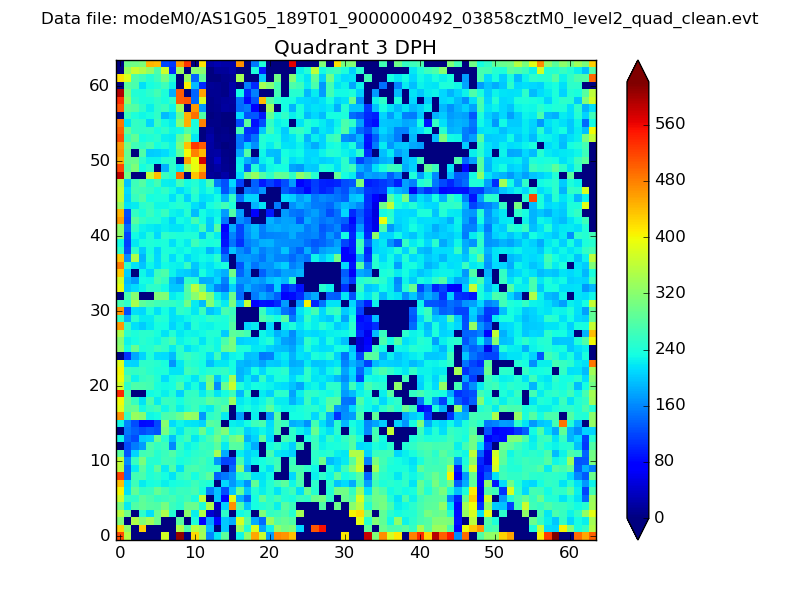 |
 |
Quadrant C |
| Plot type | Count rate plots | Images |
|---|---|---|
| Comparison with Poisson distribution Blue bars denote a histogram of data divided into 1 sec bins. Red curve is a Poisson curve with rate = median count rate of data. |
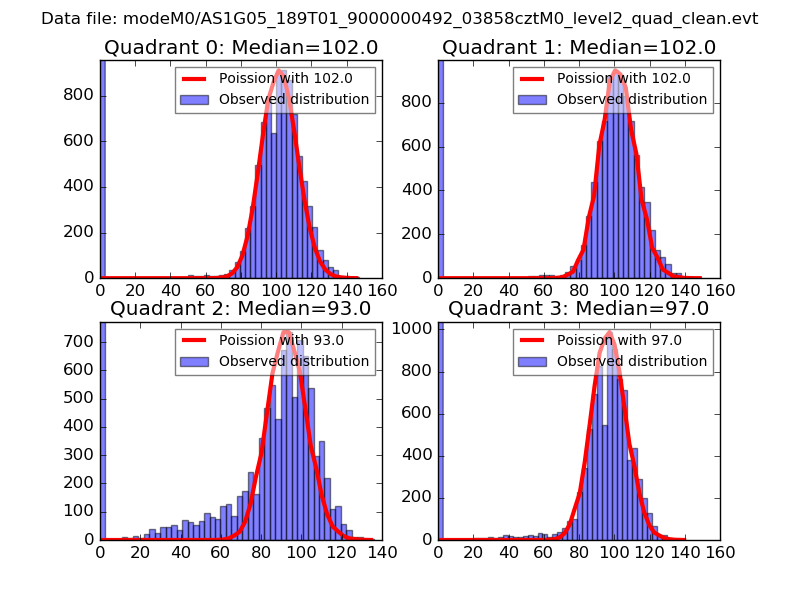 |
 |
| Quadrant-wise count rates Data is divided into 100 sec bins |
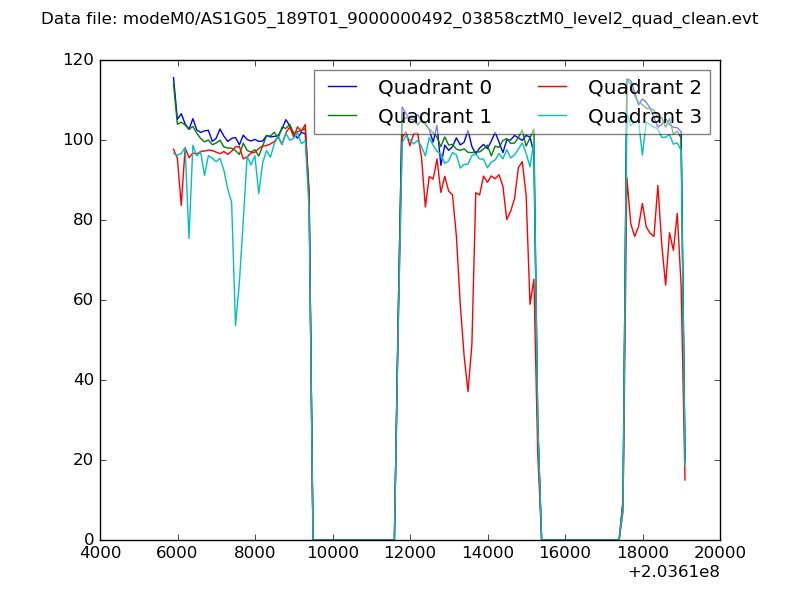 |
|
| Module-wise count rates for Quadrant A Data is divided into 100 sec bins |
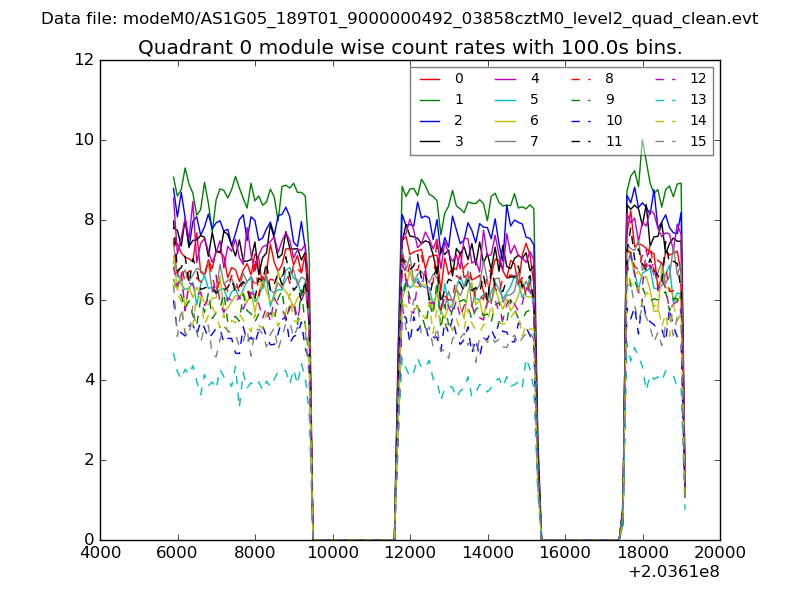 |
 |
| Module-wise count rates for Quadrant B Data is divided into 100 sec bins |
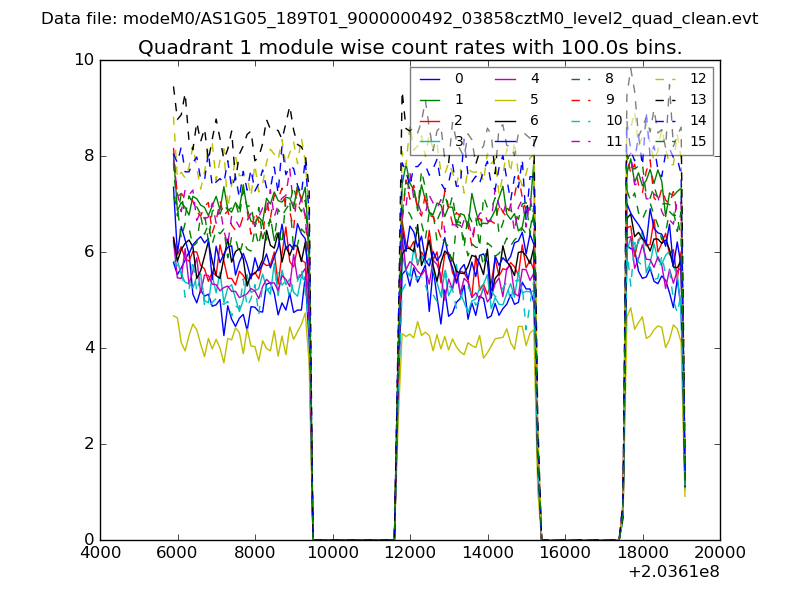 |
 |
| Module-wise count rates for Quadrant C Data is divided into 100 sec bins |
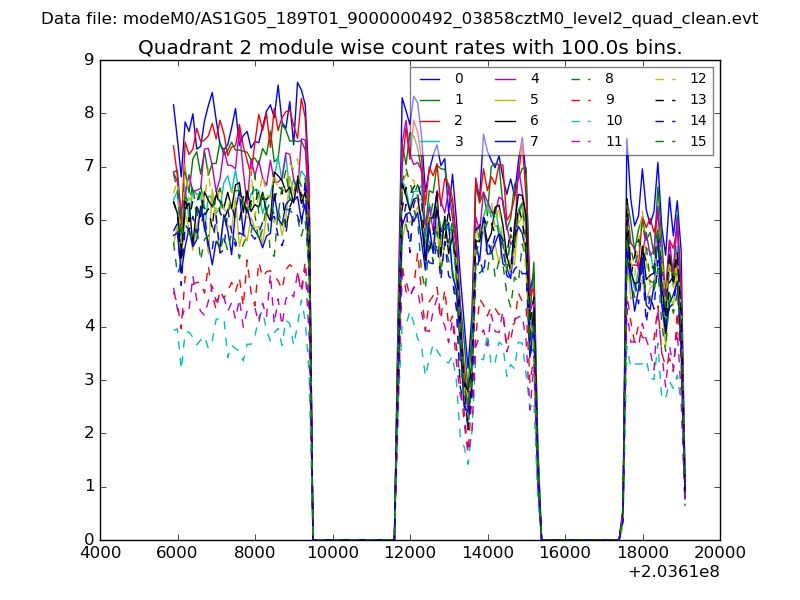 |
 |
| Module-wise count rates for Quadrant D Data is divided into 100 sec bins |
 |
 |
| Parameter | Plot |
|---|---|
| CZT HV Monitor | 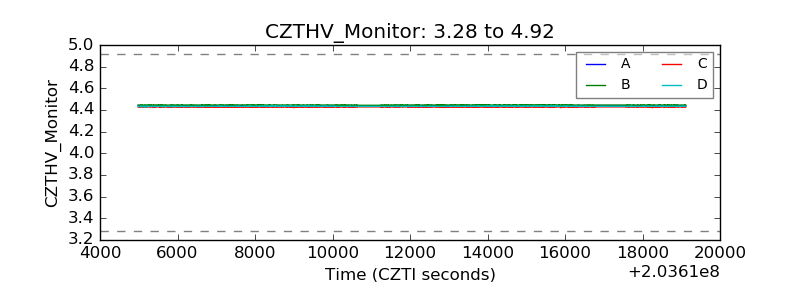 |
| D_VDD | 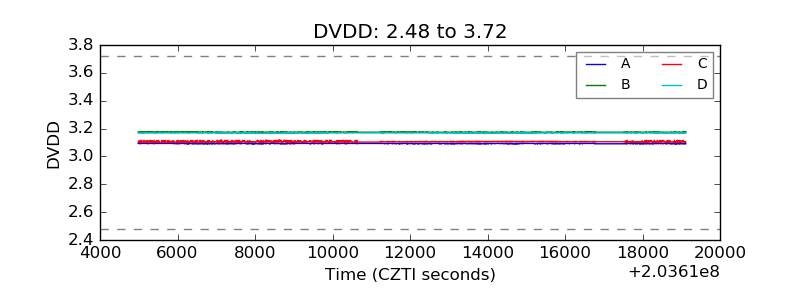 |
| Temperature 1 | 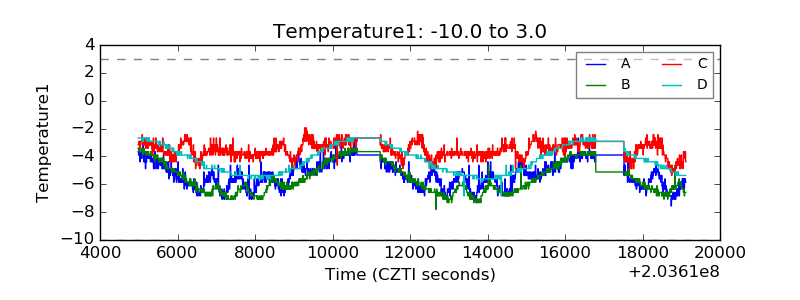 |
| Veto HV Monitor | 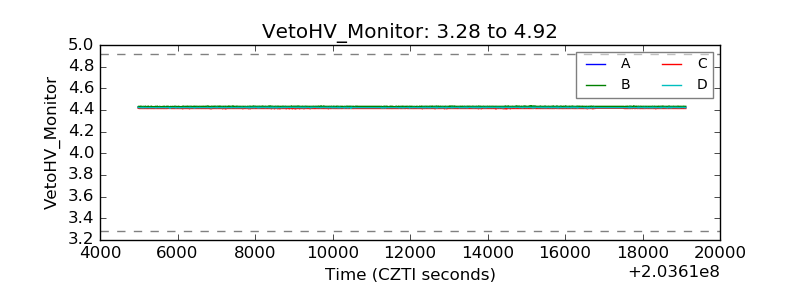 |
| Veto LLD | 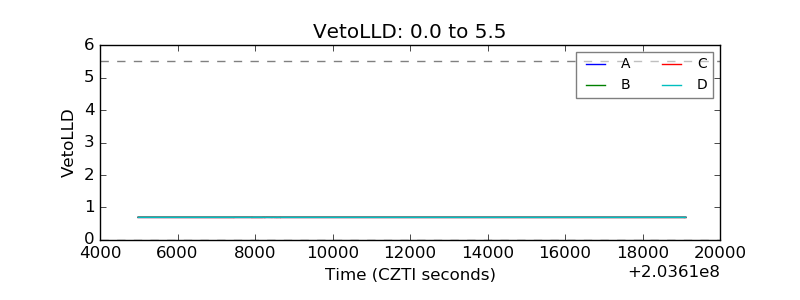 |
| Alpha Counter | 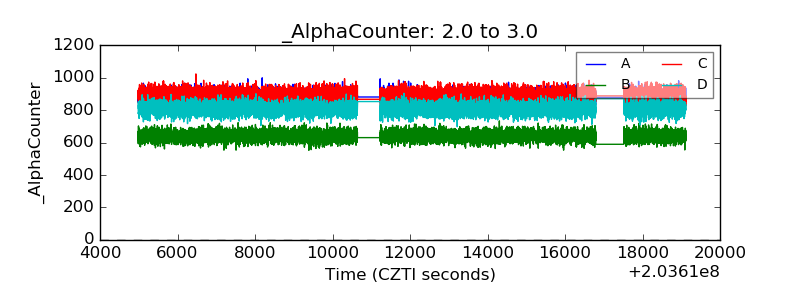 |
| _CPM_Rate | 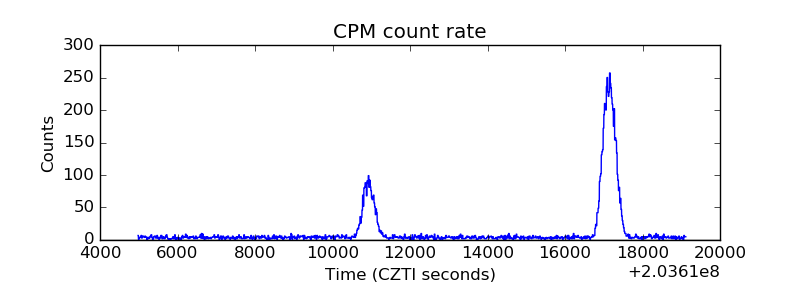 |
| CZT Counter | 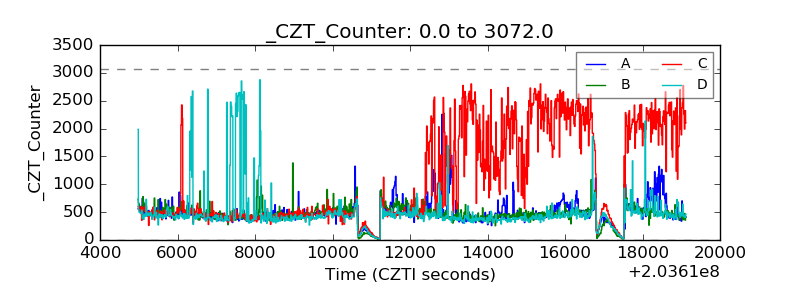 |
| +2.5 Volts monitor |  |
| +5 Volts monitor |  |
| Veto Counter | 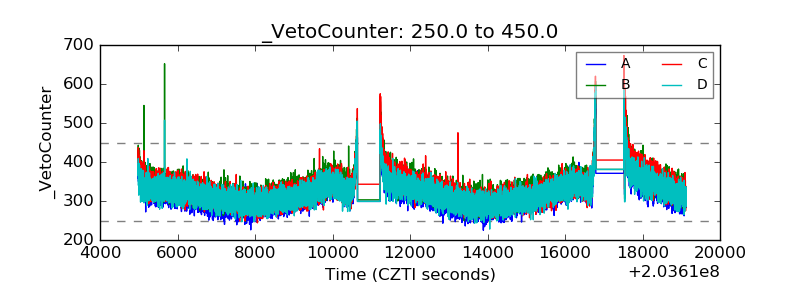 |