| Param | Original file | Final file |
|---|---|---|
| Filename | modeM0/AS1G05_189T01_9000000492_03859cztM0_level2.evt | modeM0/AS1G05_189T01_9000000492_03859cztM0_level2_quad_clean.evt |
| Size (bytes) | 774,763,200 | 70,407,360 |
| Size | 738.9 MB | 67.1 MB |
| Events in quadrant A | 3,139,466 | 468,841 |
| Events in quadrant B | 3,145,482 | 464,787 |
| Events in quadrant C | 11,835,555 | 371,488 |
| Events in quadrant D | 4,928,263 | 396,387 |
| Mode M0 | |||
|---|---|---|---|
| Quadrant | BADHDUFLAG | Total packets | Discarded packets |
| A | 0 | 13661 | 2 |
| B | 0 | 13664 | 1 |
| C | 0 | 39398 | 1 |
| D | 0 | 18987 | 1 |
| Mode M9 | |||
|---|---|---|---|
| Quadrant | BADHDUFLAG | Total packets | Discarded packets |
| A | 0 | 9 | 0 |
| B | 0 | 9 | 0 |
| C | 0 | 9 | 0 |
| D | 0 | 9 | 0 |
| Mode SS | |||
|---|---|---|---|
| Quadrant | BADHDUFLAG | Total packets | Discarded packets |
| A | 0 | 126 | 0 |
| B | 0 | 126 | 0 |
| C | 0 | 126 | 0 |
| D | 0 | 126 | 0 |
| Quadrant | Total seconds | Saturated seconds | Saturation percentage |
|---|---|---|---|
| A | 6139 | 29 | 0.472390% |
| B | 6139 | 66 | 1.075094% |
| C | 6139 | 3088 | 50.301352% |
| D | 6139 | 914 | 14.888418% |
Noise dominated data is calculated using 1-second bins in cleaned event files. If a bin has >2000 counts, and if more than 50% of those come from <1% of pixels, then it is considered to be noise-dominated and hence unusable.
| Quadrant | # 1 sec bins | Bins with >0 counts | Bins with >2000 counts | High rate bins dominated by noise | Noise dominated (total time) | Noise dominated (detector-on time) | Marked lightcurve |
|---|---|---|---|---|---|---|---|
| A | 7094 | 6140 | 4 | 4 | 0.06% | 0.07% | 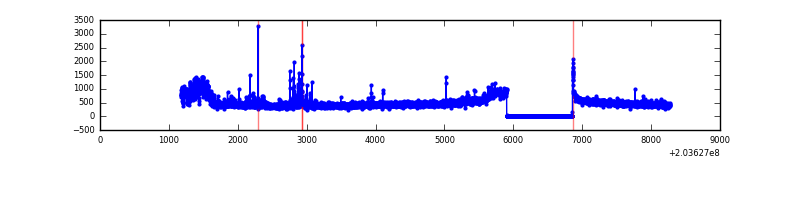 |
| B | 7094 | 6140 | 27 | 27 | 0.38% | 0.44% | 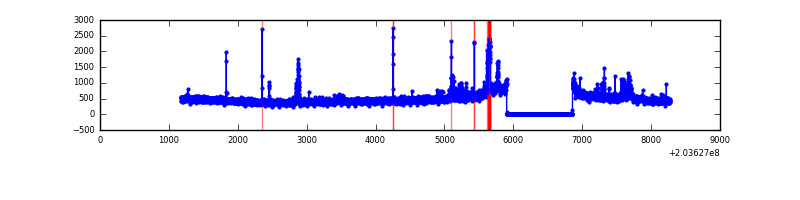 |
| C | 7094 | 6139 | 3244 | 3244 | 45.73% | 52.84% | 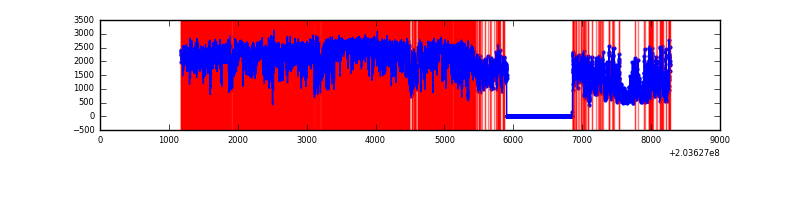 |
| D | 7093 | 6138 | 890 | 890 | 12.55% | 14.50% | 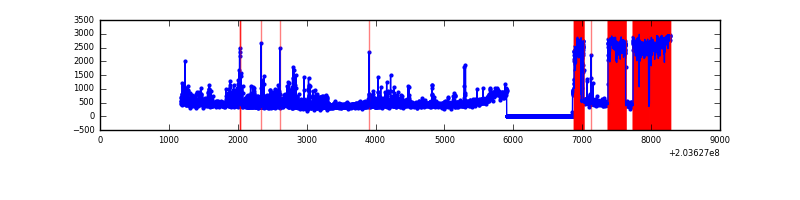 |
Top three noisy pixels from each quadrant. If the there are fewer than three noisy pixels in the level2.evt file, extra rows are filled as -1
| Pixel properties | Quadrant properties | ||||||
|---|---|---|---|---|---|---|---|
| Quadrant | DetID | PixID | Counts | Sigma | Mean | Median | Sigma |
| A | 15 | 234 | 277809 | 1895.22 | 717 | 702 | 146.2 |
| A | 8 | 15 | 93549 | 635.01 | 717 | 702 | 146.2 |
| A | 13 | 251 | 7574 | 47.0 | 717 | 702 | 146.2 |
| B | 14 | 167 | 179295 | 1281.75 | 718 | 701 | 139.3 |
| B | 15 | 204 | 140799 | 1005.47 | 718 | 701 | 139.3 |
| B | 0 | 187 | 17557 | 120.97 | 718 | 701 | 139.3 |
| C | 2 | 53 | 9366244 | 65241.27 | 612 | 614 | 143.6 |
| C | 1 | 241 | 40100 | 275.06 | 612 | 614 | 143.6 |
| C | 7 | 141 | 14489 | 96.65 | 612 | 614 | 143.6 |
| D | 13 | 137 | 2145811 | 13307.9 | 649 | 631 | 161.2 |
| D | 8 | 112 | 277210 | 1715.79 | 649 | 631 | 161.2 |
| D | 13 | 223 | 33194 | 202.01 | 649 | 631 | 161.2 |
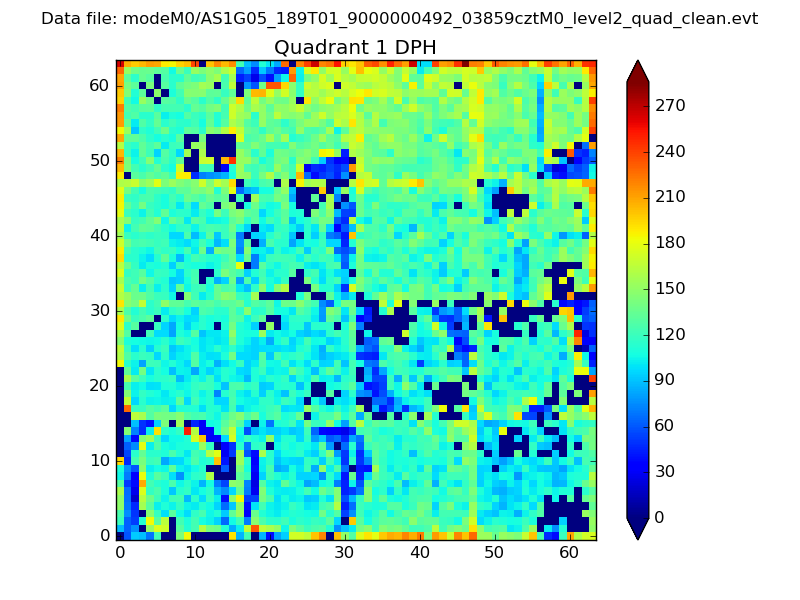
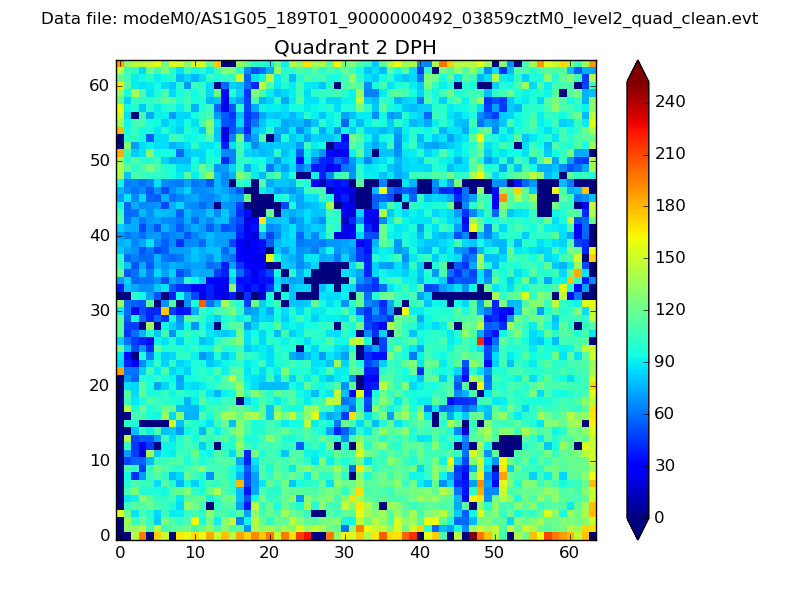
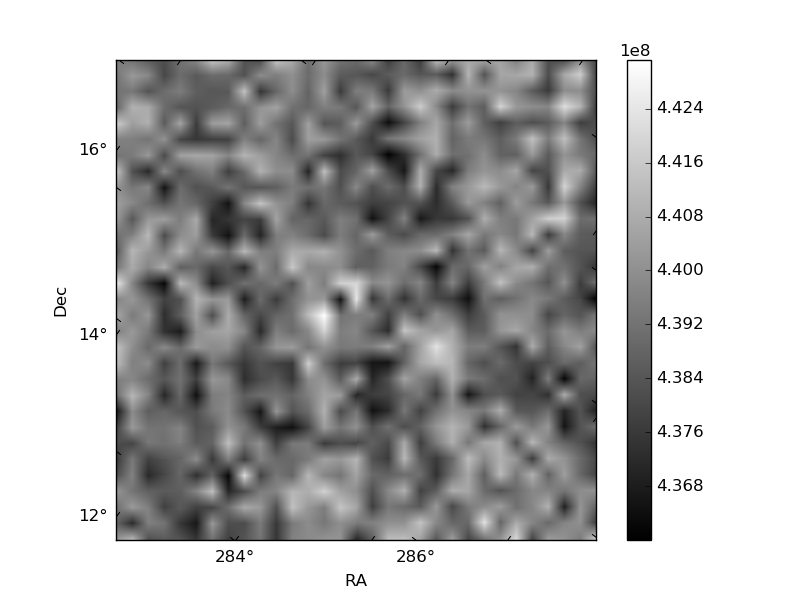
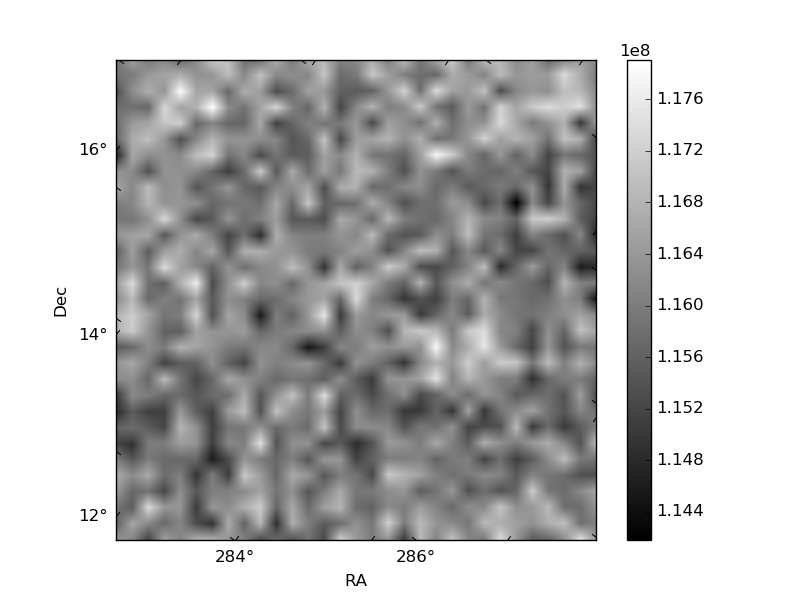
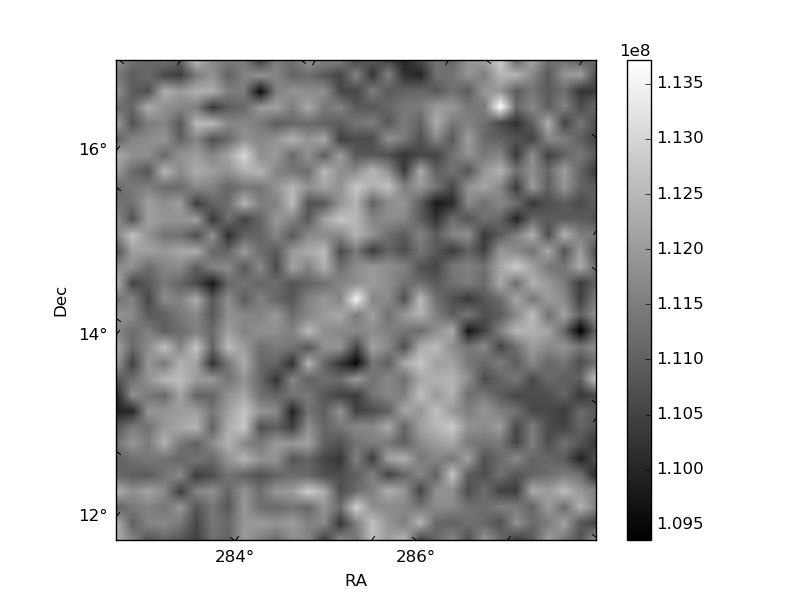
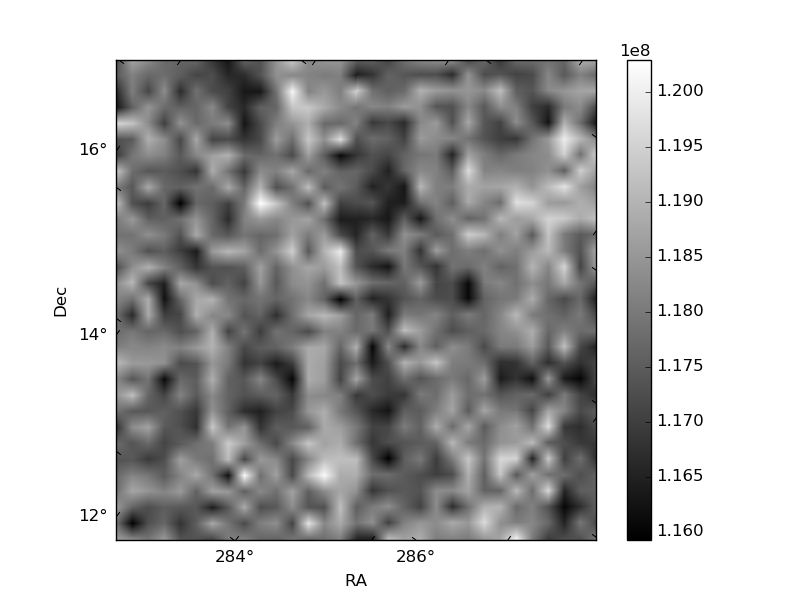
Histogram calculated using DETX and DETY for each event in the final _common_clean file
| Quadrant A |  |
 |
Quadrant B |
|---|---|---|---|
| Quadrant D | 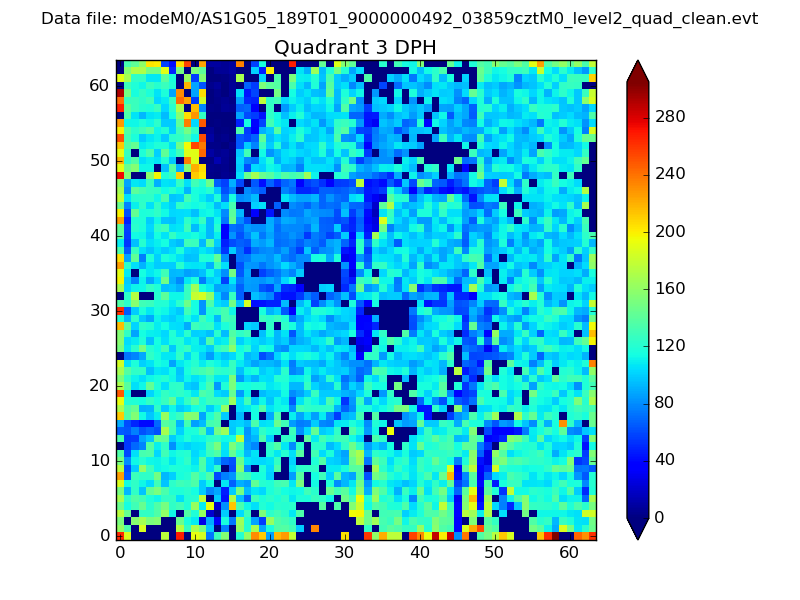 |
 |
Quadrant C |
| Plot type | Count rate plots | Images |
|---|---|---|
| Comparison with Poisson distribution Blue bars denote a histogram of data divided into 1 sec bins. Red curve is a Poisson curve with rate = median count rate of data. |
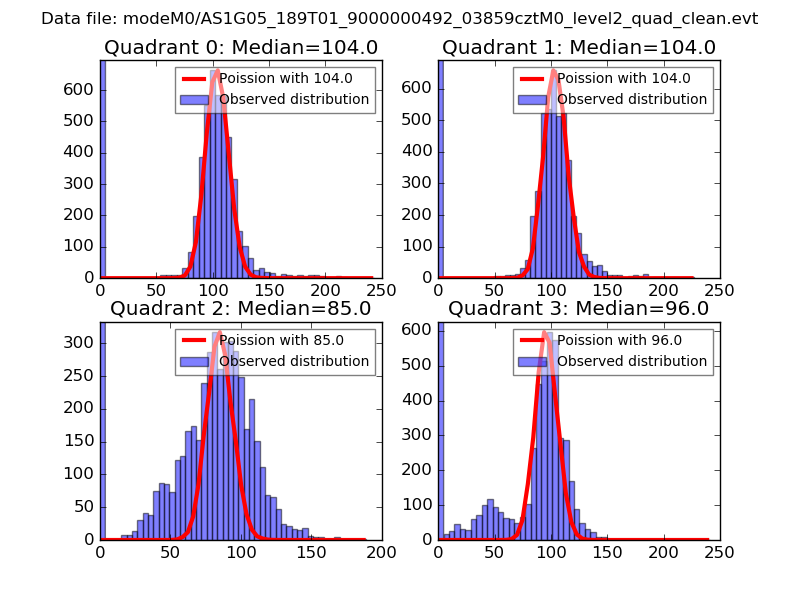 |
 |
| Quadrant-wise count rates Data is divided into 100 sec bins |
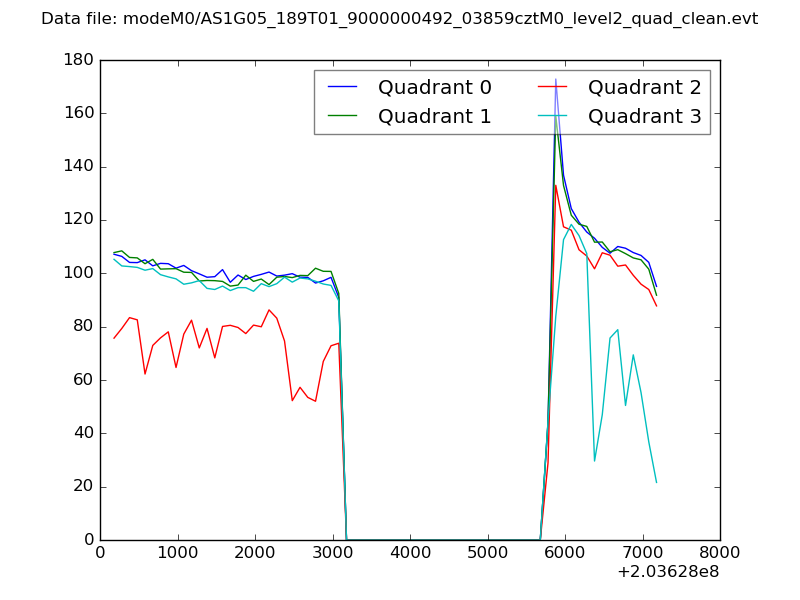 |
|
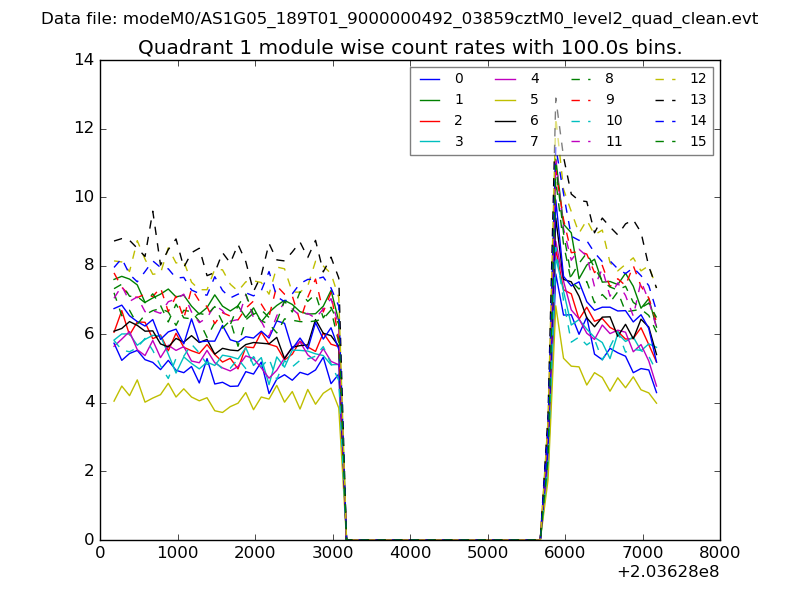
| Module-wise count rates for Quadrant A Data is divided into 100 sec bins |
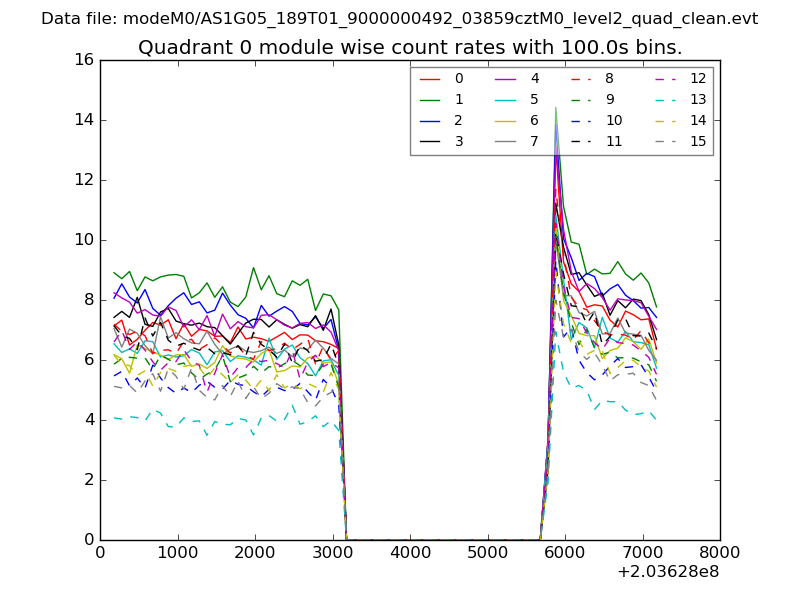 |
 |
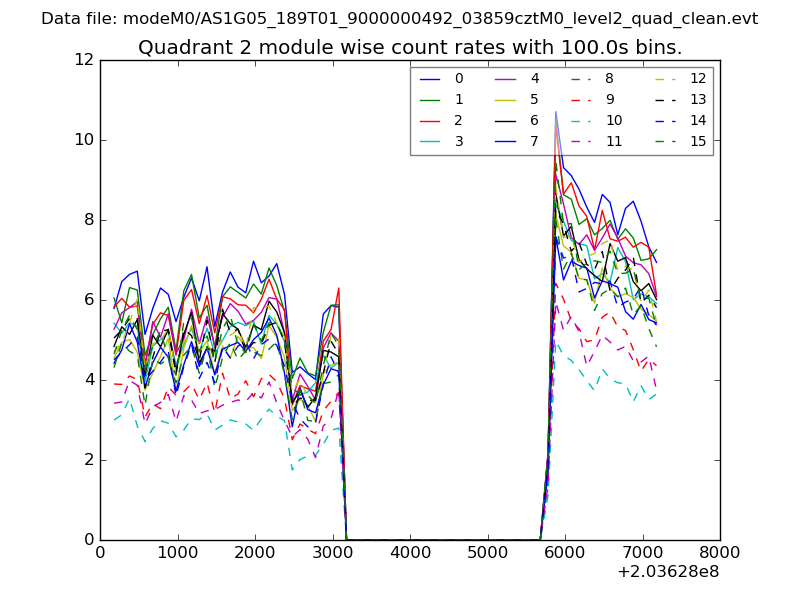
| Module-wise count rates for Quadrant B Data is divided into 100 sec bins |
 |
 |
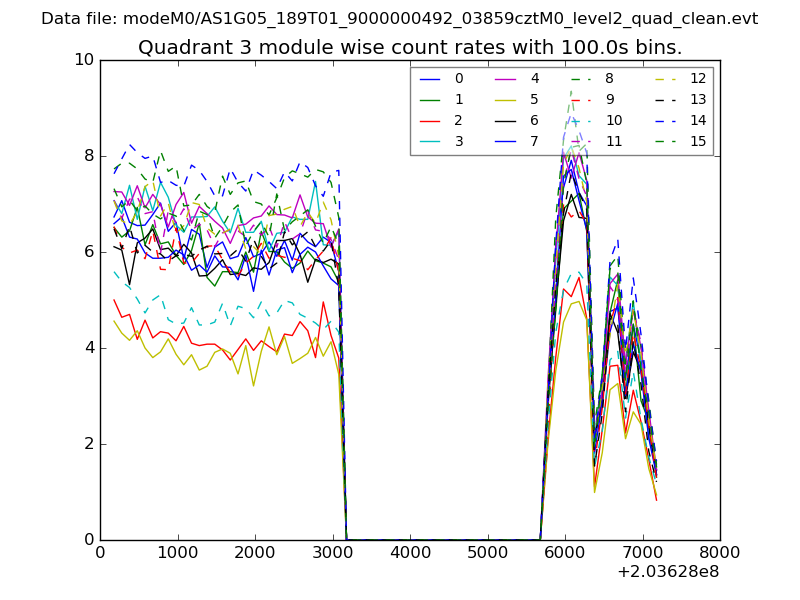
| Module-wise count rates for Quadrant C Data is divided into 100 sec bins |
 |
 |
| Module-wise count rates for Quadrant D Data is divided into 100 sec bins |
 |
 |
| Parameter | Plot |
|---|---|
| CZT HV Monitor | 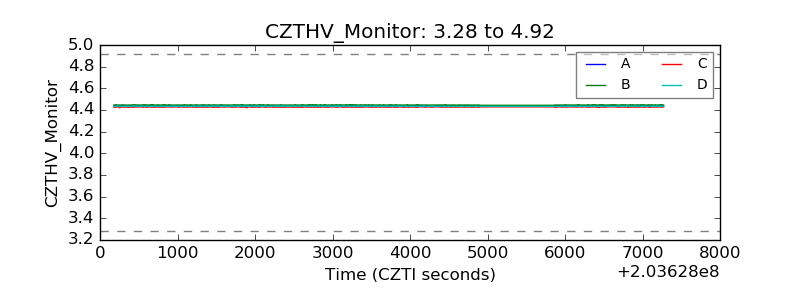 |
| D_VDD | 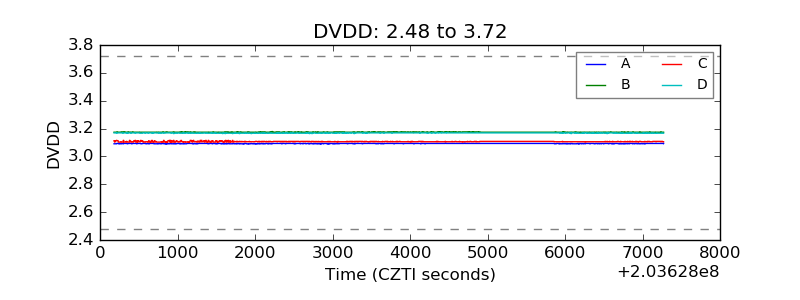 |
| Temperature 1 | 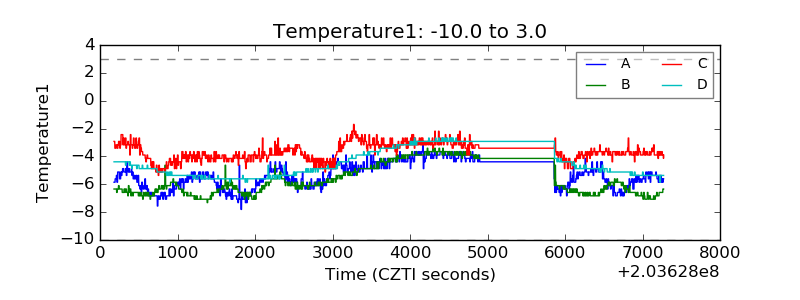 |
| Veto HV Monitor |  |
| Veto LLD | 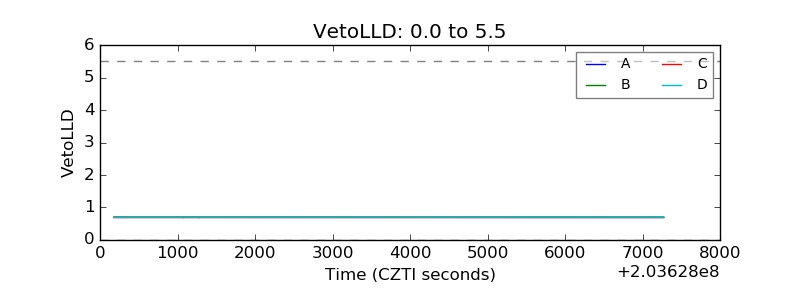 |
| Alpha Counter | 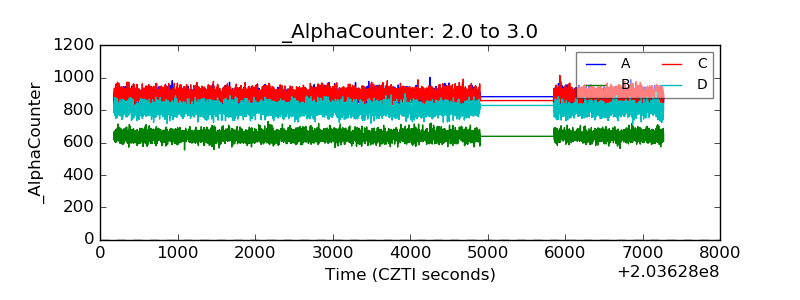 |
| _CPM_Rate | 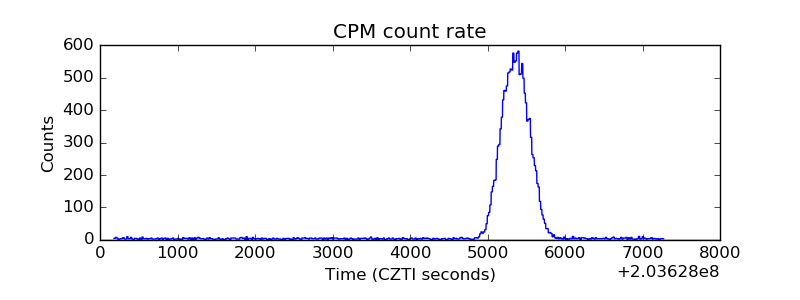 |
| CZT Counter | 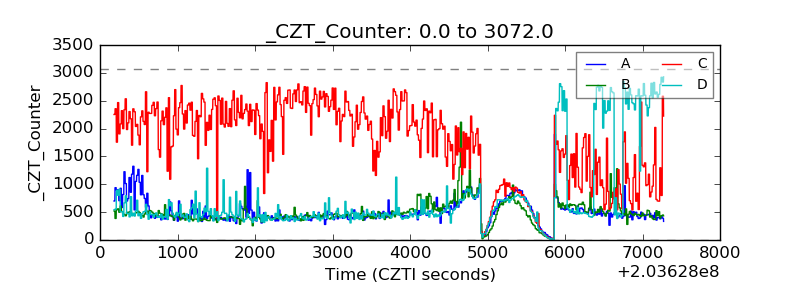 |
| +2.5 Volts monitor |  |
| +5 Volts monitor |  |
| Veto Counter | 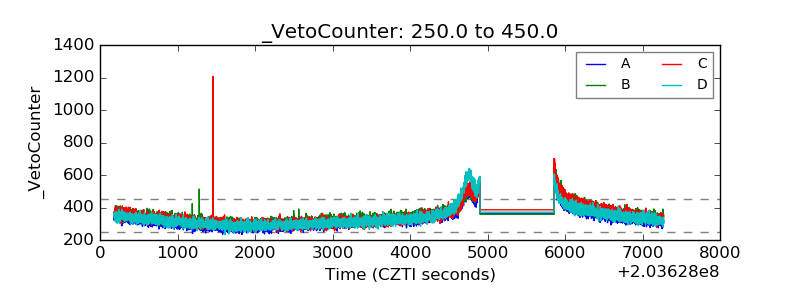 |