| Param | Original file | Final file |
|---|---|---|
| Filename | modeM0/AS1G05_189T01_9000000492_03860cztM0_level2.evt | modeM0/AS1G05_189T01_9000000492_03860cztM0_level2_quad_clean.evt |
| Size (bytes) | 562,271,040 | 65,894,400 |
| Size | 536.2 MB | 62.8 MB |
| Events in quadrant A | 3,375,571 | 414,855 |
| Events in quadrant B | 3,312,613 | 413,600 |
| Events in quadrant C | 5,046,374 | 400,652 |
| Events in quadrant D | 4,896,792 | 355,840 |
| Mode M0 | |||
|---|---|---|---|
| Quadrant | BADHDUFLAG | Total packets | Discarded packets |
| A | 0 | 14291 | 2 |
| B | 0 | 13886 | 1 |
| C | 0 | 19076 | 1 |
| D | 0 | 18984 | 1 |
| Mode M9 | |||
|---|---|---|---|
| Quadrant | BADHDUFLAG | Total packets | Discarded packets |
| A | 0 | 11 | 0 |
| B | 0 | 11 | 0 |
| C | 0 | 11 | 0 |
| D | 0 | 11 | 0 |
| Mode SS | |||
|---|---|---|---|
| Quadrant | BADHDUFLAG | Total packets | Discarded packets |
| A | 0 | 120 | 0 |
| B | 0 | 120 | 0 |
| C | 0 | 120 | 0 |
| D | 0 | 120 | 0 |
| Quadrant | Total seconds | Saturated seconds | Saturation percentage |
|---|---|---|---|
| A | 5862 | 111 | 1.893552% |
| B | 5862 | 68 | 1.160014% |
| C | 5862 | 284 | 4.844763% |
| D | 5862 | 825 | 14.073695% |
Noise dominated data is calculated using 1-second bins in cleaned event files. If a bin has >2000 counts, and if more than 50% of those come from <1% of pixels, then it is considered to be noise-dominated and hence unusable.
| Quadrant | # 1 sec bins | Bins with >0 counts | Bins with >2000 counts | High rate bins dominated by noise | Noise dominated (total time) | Noise dominated (detector-on time) | Marked lightcurve |
|---|---|---|---|---|---|---|---|
| A | 6942 | 5863 | 6 | 6 | 0.09% | 0.10% | 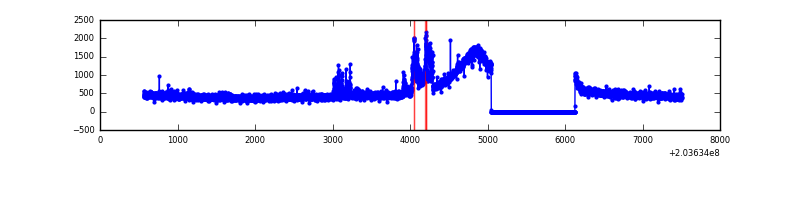 |
| B | 6942 | 5862 | 0 | 0 | 0.00% | 0.00% | 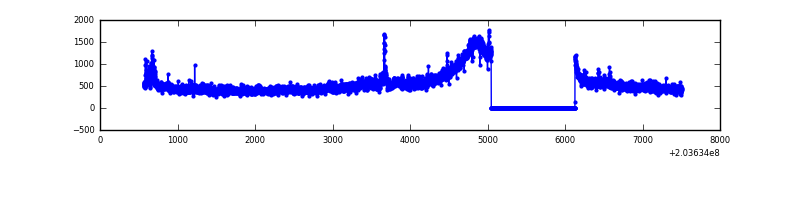 |
| C | 6942 | 5862 | 226 | 226 | 3.26% | 3.86% | 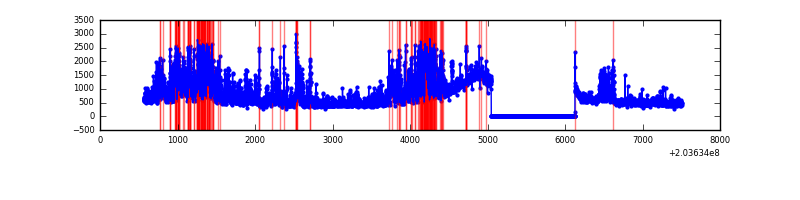 |
| D | 6942 | 5862 | 787 | 787 | 11.34% | 13.43% | 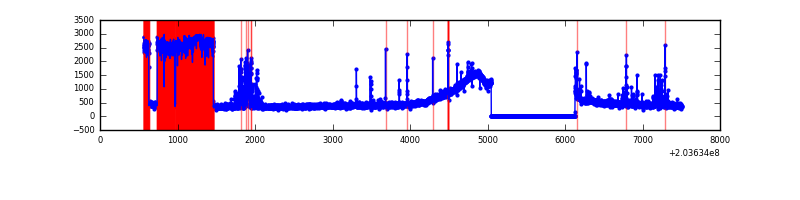 |
Top three noisy pixels from each quadrant. If the there are fewer than three noisy pixels in the level2.evt file, extra rows are filled as -1
| Pixel properties | Quadrant properties | ||||||
|---|---|---|---|---|---|---|---|
| Quadrant | DetID | PixID | Counts | Sigma | Mean | Median | Sigma |
| A | 15 | 234 | 221232 | 1261.44 | 803 | 793 | 174.8 |
| A | 8 | 15 | 66157 | 374.04 | 803 | 793 | 174.8 |
| A | 12 | 194 | 8136 | 42.02 | 803 | 793 | 174.8 |
| B | 15 | 204 | 156168 | 994.87 | 766 | 753 | 156.2 |
| B | 0 | 187 | 103157 | 655.52 | 766 | 753 | 156.2 |
| B | 14 | 167 | 85428 | 542.03 | 766 | 753 | 156.2 |
| C | 2 | 53 | 2121752 | 11277.23 | 746 | 755 | 188.1 |
| C | 13 | 61 | 5913 | 27.42 | 746 | 755 | 188.1 |
| C | 14 | 67 | 5009 | 22.62 | 746 | 755 | 188.1 |
| D | 13 | 137 | 1868013 | 8976.25 | 733 | 721 | 208.0 |
| D | 13 | 238 | 120776 | 577.12 | 733 | 721 | 208.0 |
| D | 12 | 110 | 29324 | 137.5 | 733 | 721 | 208.0 |
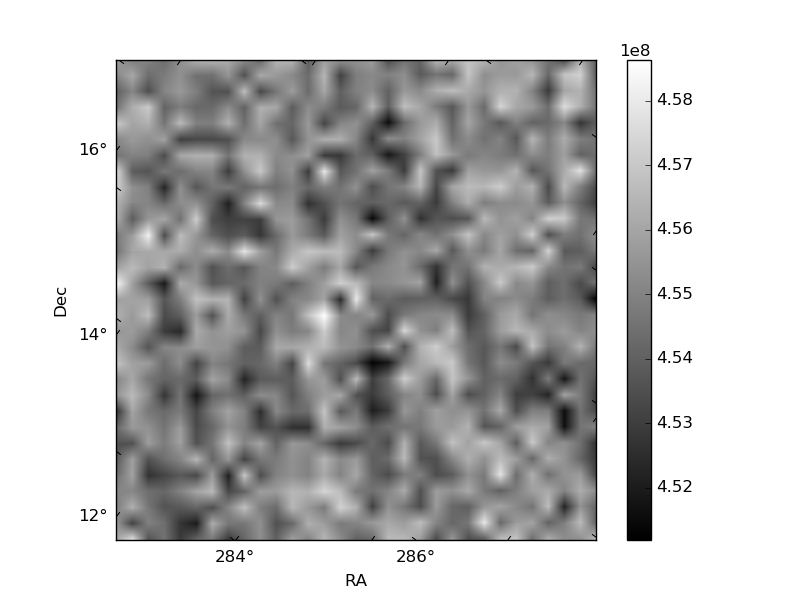
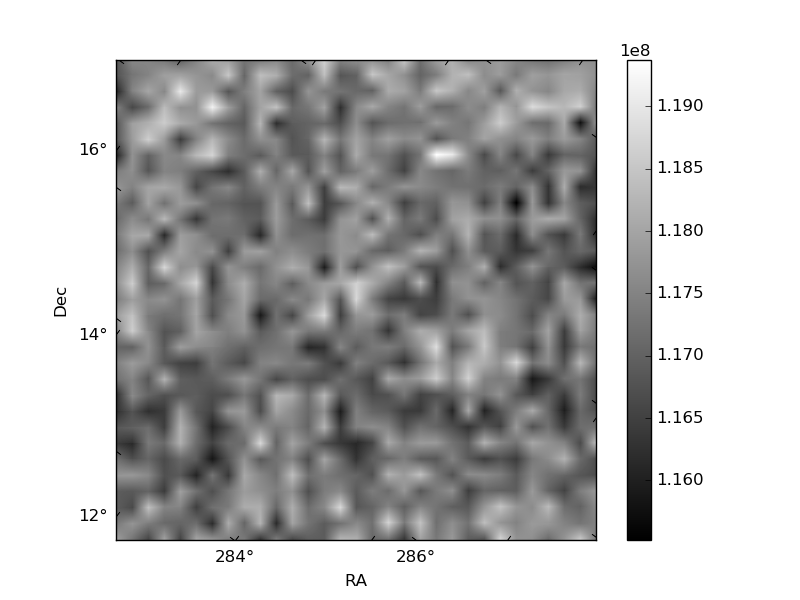
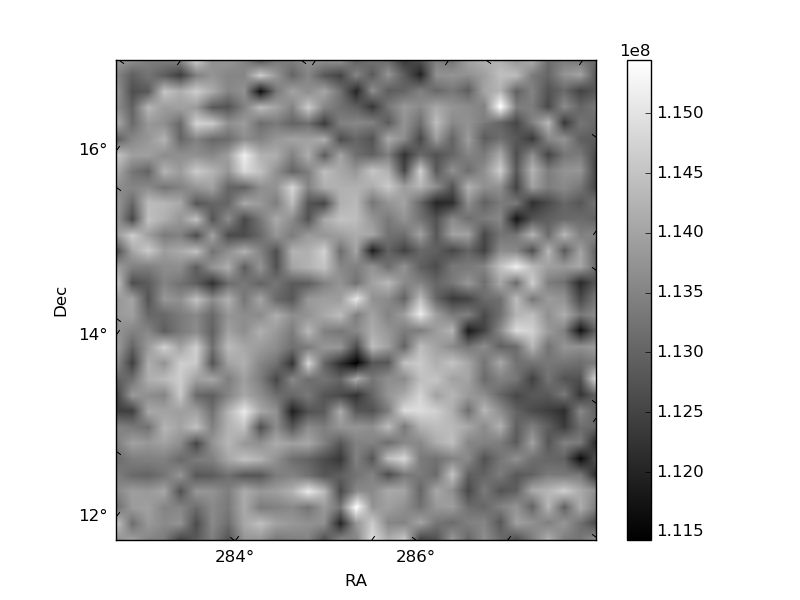
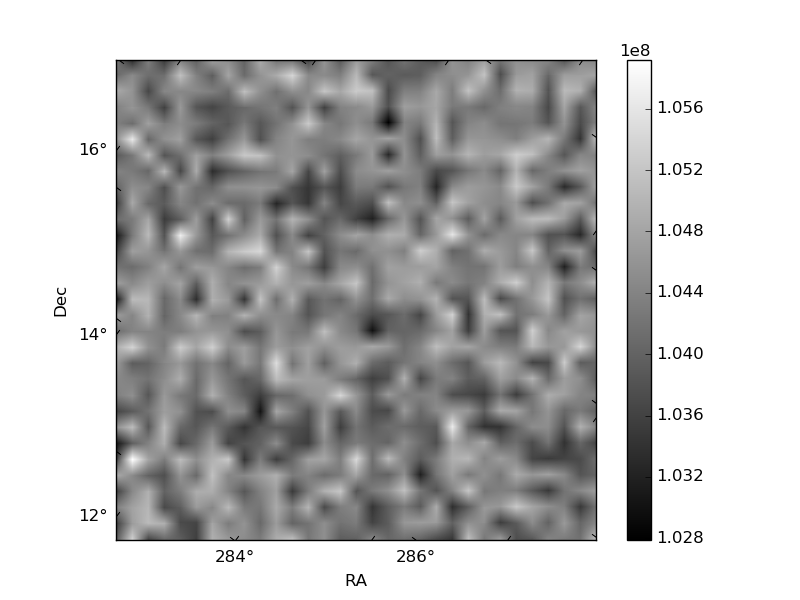
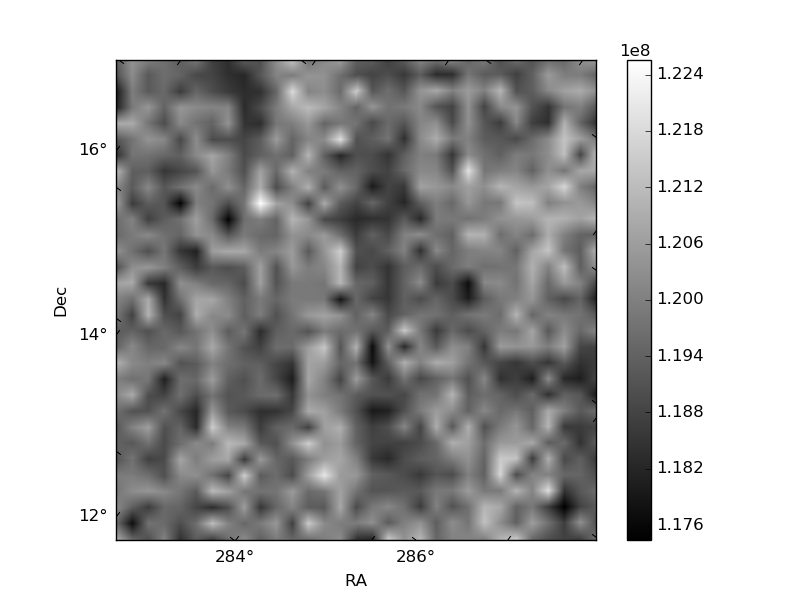
Histogram calculated using DETX and DETY for each event in the final _common_clean file
| Quadrant A | 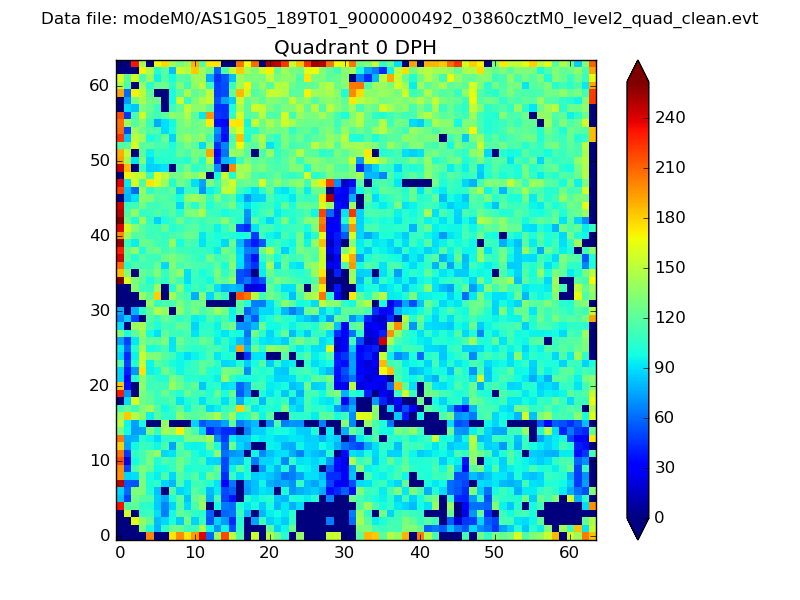 |
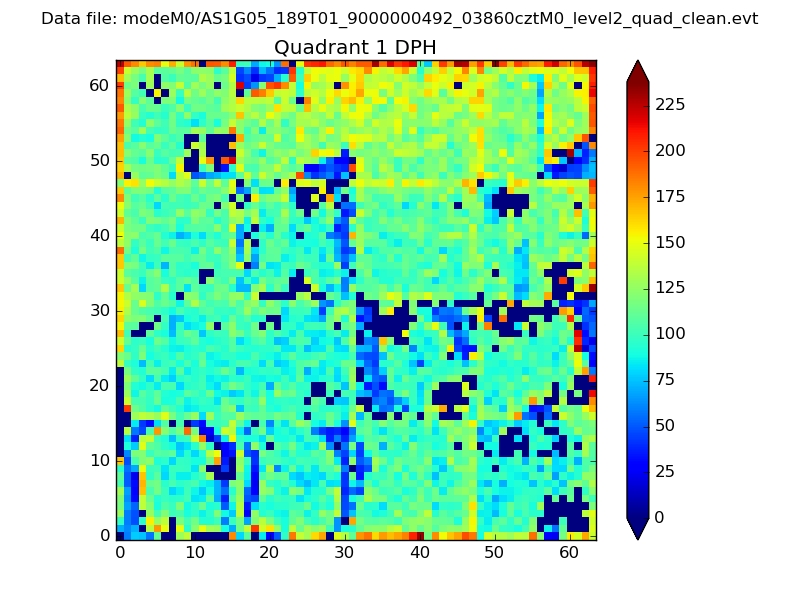 |
Quadrant B |
|---|---|---|---|
| Quadrant D | 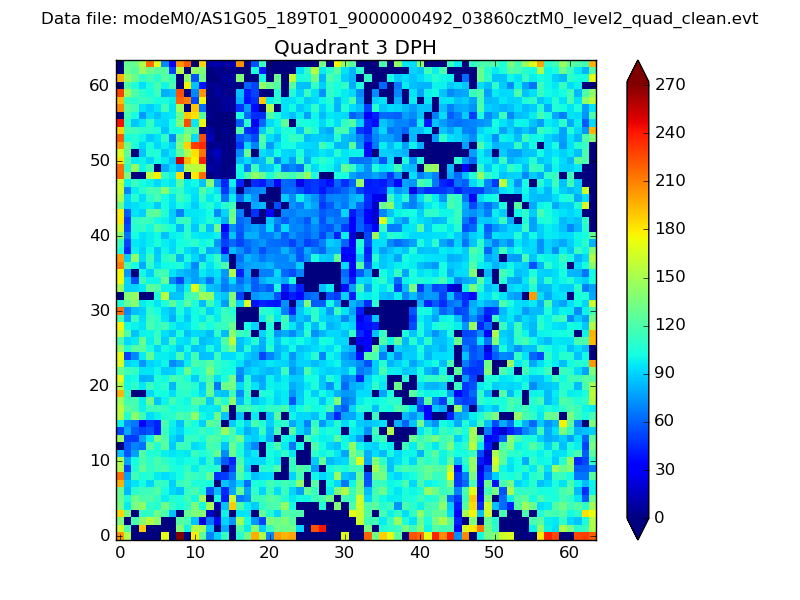 |
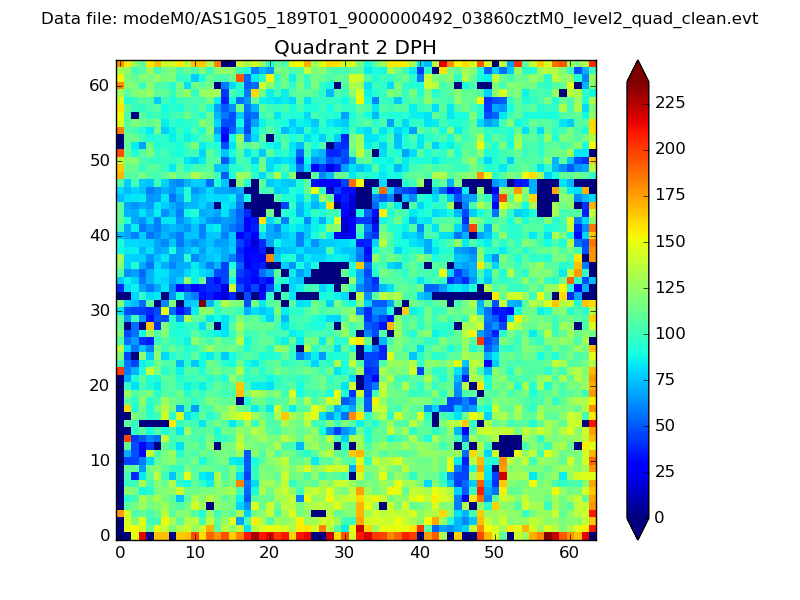 |
Quadrant C |
| Plot type | Count rate plots | Images |
|---|---|---|
| Comparison with Poisson distribution Blue bars denote a histogram of data divided into 1 sec bins. Red curve is a Poisson curve with rate = median count rate of data. |
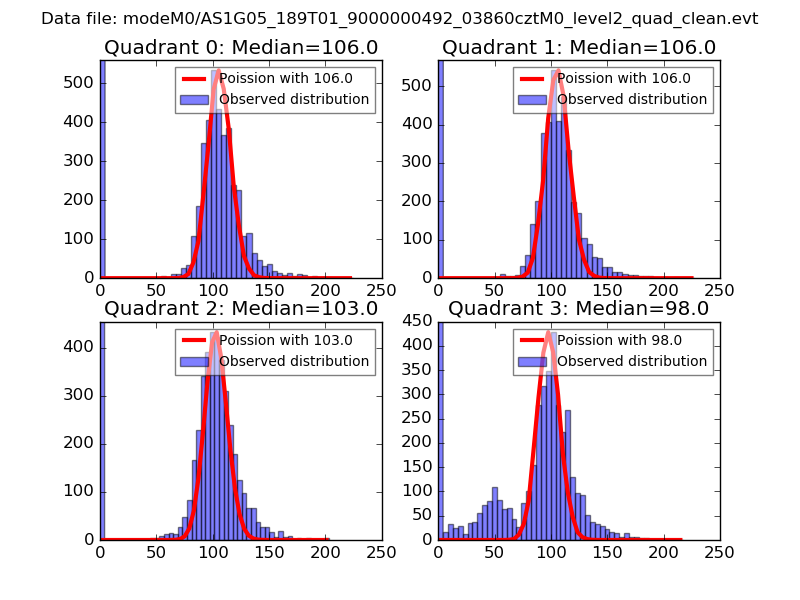 |
 |
| Quadrant-wise count rates Data is divided into 100 sec bins |
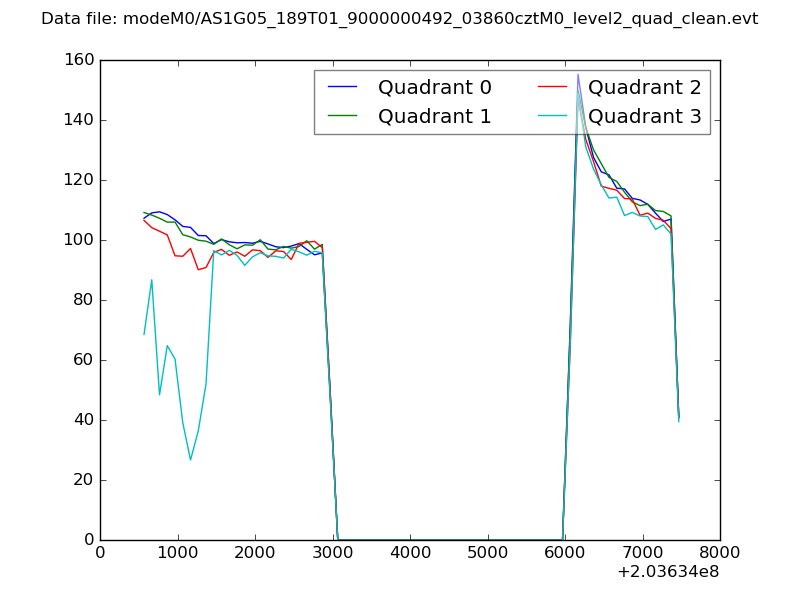 |
|
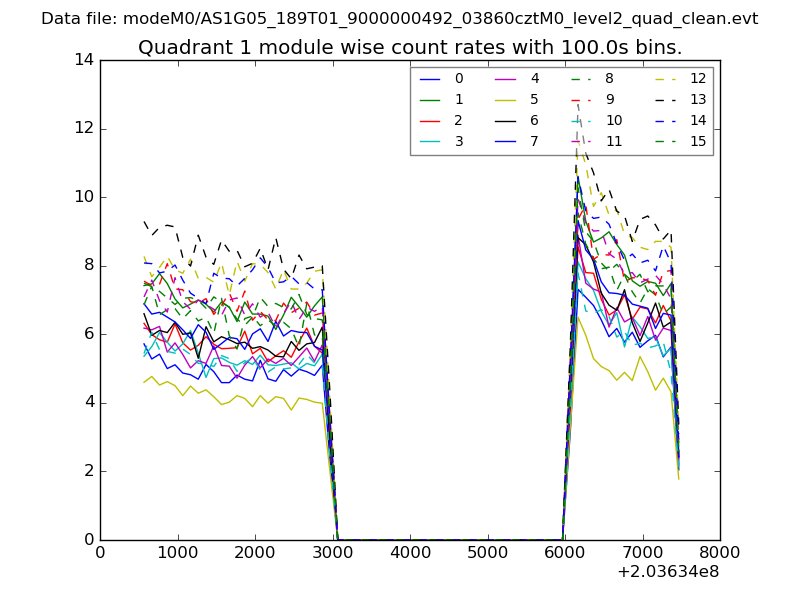
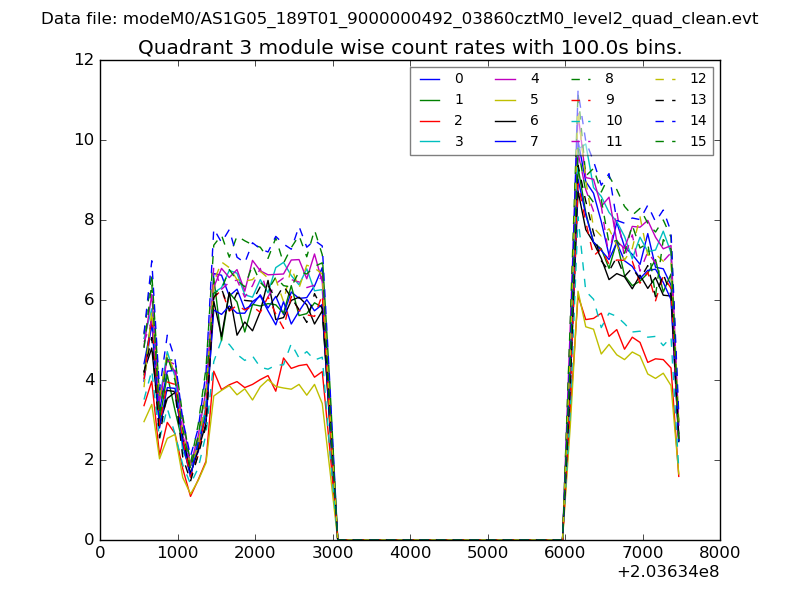
| Module-wise count rates for Quadrant A Data is divided into 100 sec bins |
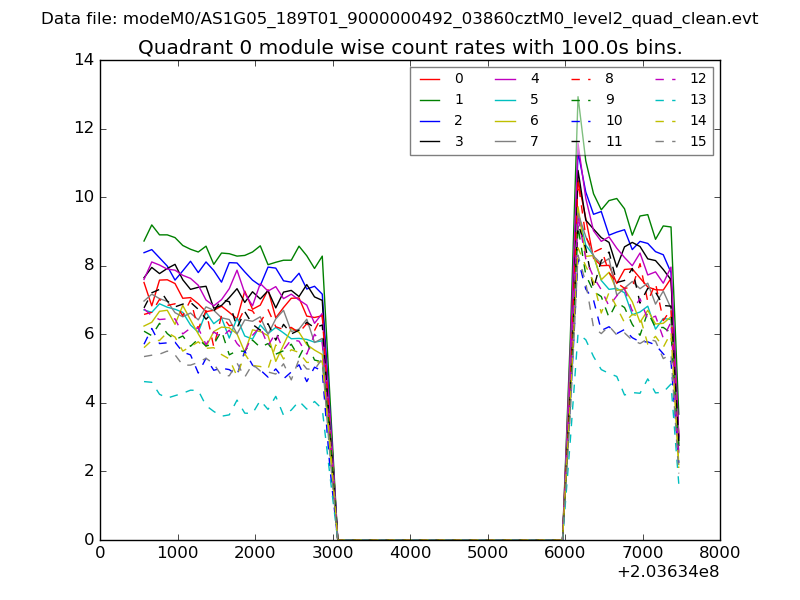 |
 |
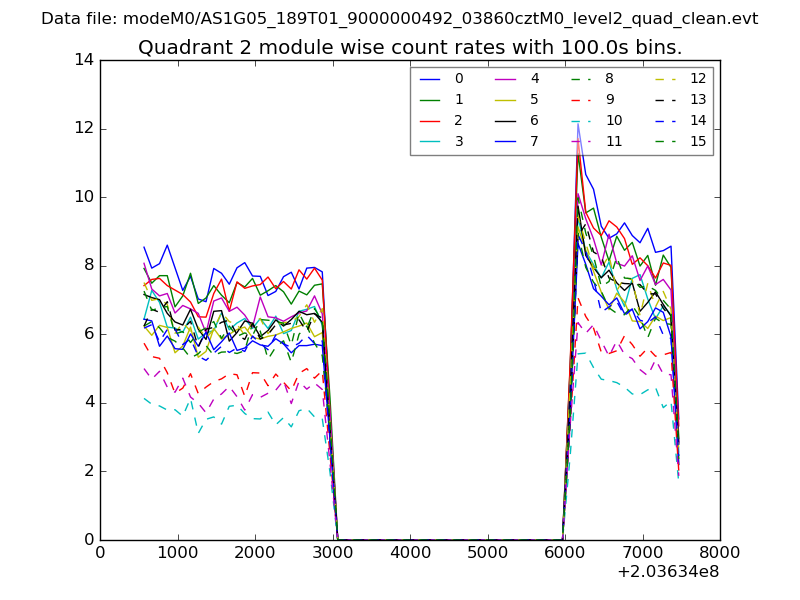
| Module-wise count rates for Quadrant B Data is divided into 100 sec bins |
 |
 |
| Module-wise count rates for Quadrant C Data is divided into 100 sec bins |
 |
 |
| Module-wise count rates for Quadrant D Data is divided into 100 sec bins |
 |
 |
| Parameter | Plot |
|---|---|
| CZT HV Monitor | 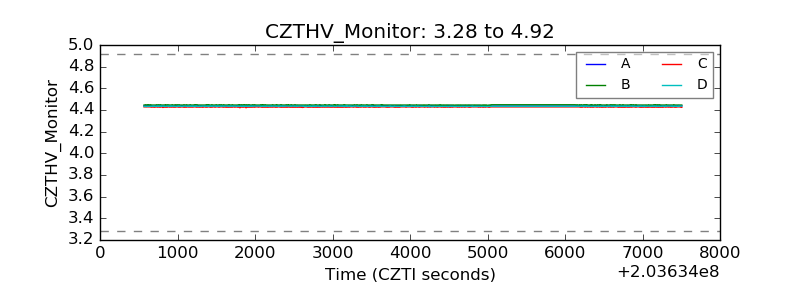 |
| D_VDD | 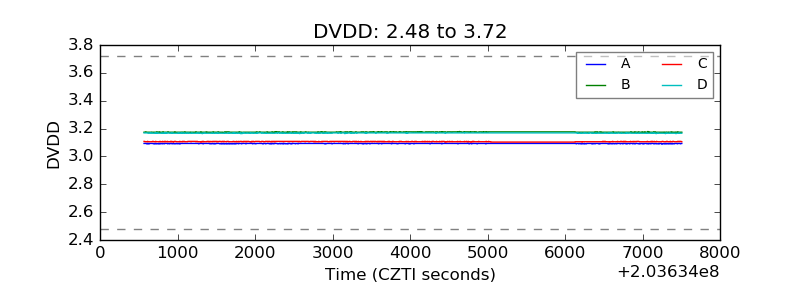 |
| Temperature 1 | 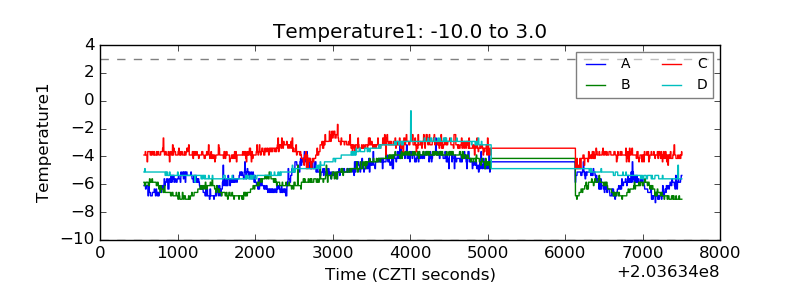 |
| Veto HV Monitor | 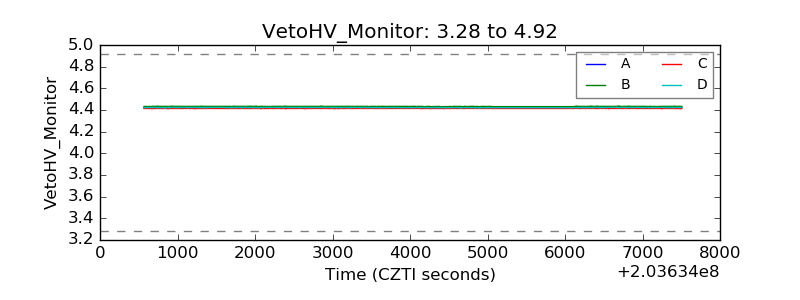 |
| Veto LLD | 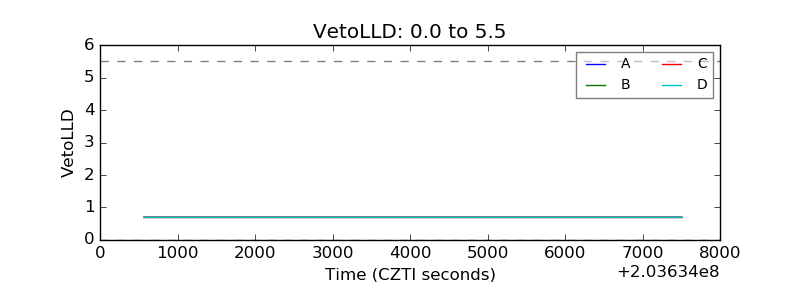 |
| Alpha Counter | 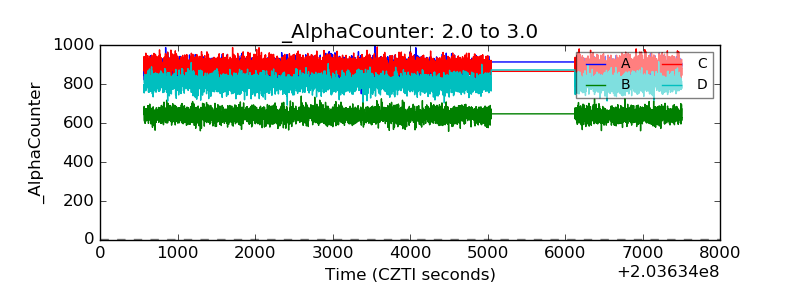 |
| _CPM_Rate | 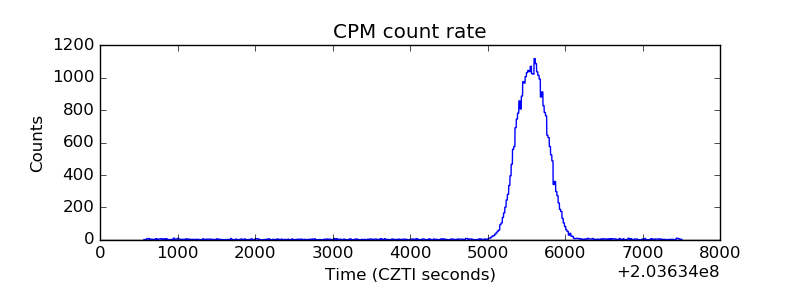 |
| CZT Counter | 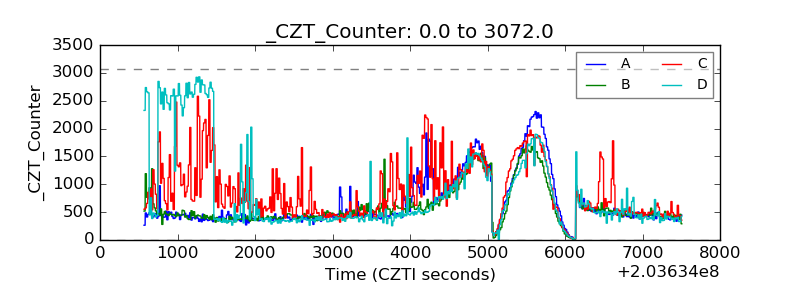 |
| +2.5 Volts monitor |  |
| +5 Volts monitor |  |
| Veto Counter | 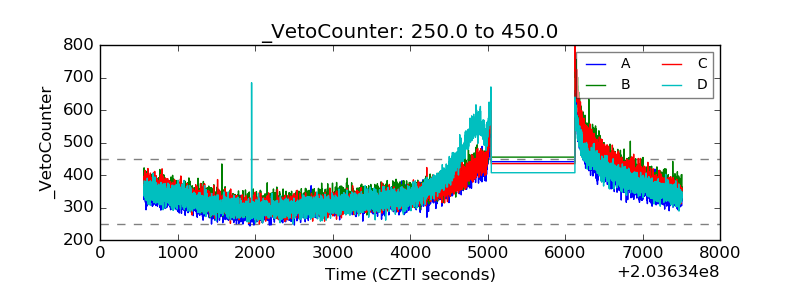 |