| Param | Original file | Final file |
|---|---|---|
| Filename | modeM0/AS1G05_189T01_9000000492_03862cztM0_level2.evt | modeM0/AS1G05_189T01_9000000492_03862cztM0_level2_quad_clean.evt |
| Size (bytes) | 409,754,880 | 68,238,720 |
| Size | 390.8 MB | 65.1 MB |
| Events in quadrant A | 3,149,723 | 419,046 |
| Events in quadrant B | 2,891,177 | 422,160 |
| Events in quadrant C | 3,376,693 | 411,495 |
| Events in quadrant D | 2,594,767 | 405,331 |
| Mode M0 | |||
|---|---|---|---|
| Quadrant | BADHDUFLAG | Total packets | Discarded packets |
| A | 0 | 13453 | 2 |
| B | 0 | 12398 | 1 |
| C | 0 | 13901 | 1 |
| D | 0 | 12212 | 1 |
| Mode M9 | |||
|---|---|---|---|
| Quadrant | BADHDUFLAG | Total packets | Discarded packets |
| A | 0 | 12 | 0 |
| B | 0 | 12 | 0 |
| C | 0 | 12 | 0 |
| D | 0 | 12 | 0 |
| Mode SS | |||
|---|---|---|---|
| Quadrant | BADHDUFLAG | Total packets | Discarded packets |
| A | 0 | 118 | 0 |
| B | 0 | 118 | 0 |
| C | 0 | 118 | 0 |
| D | 0 | 118 | 0 |
| Quadrant | Total seconds | Saturated seconds | Saturation percentage |
|---|---|---|---|
| A | 5841 | 91 | 1.557952% |
| B | 5841 | 59 | 1.010101% |
| C | 5841 | 95 | 1.626434% |
| D | 5841 | 39 | 0.667694% |
Noise dominated data is calculated using 1-second bins in cleaned event files. If a bin has >2000 counts, and if more than 50% of those come from <1% of pixels, then it is considered to be noise-dominated and hence unusable.
| Quadrant | # 1 sec bins | Bins with >0 counts | Bins with >2000 counts | High rate bins dominated by noise | Noise dominated (total time) | Noise dominated (detector-on time) | Marked lightcurve |
|---|---|---|---|---|---|---|---|
| A | 7011 | 5841 | 22 | 22 | 0.31% | 0.38% | 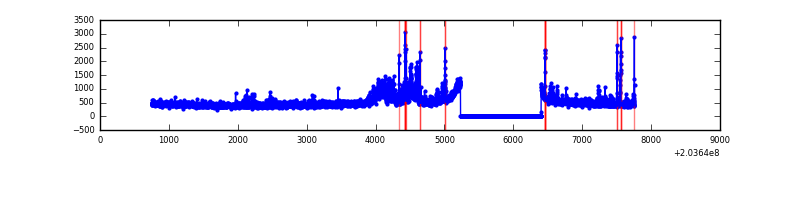 |
| B | 7011 | 5841 | 22 | 22 | 0.31% | 0.38% | 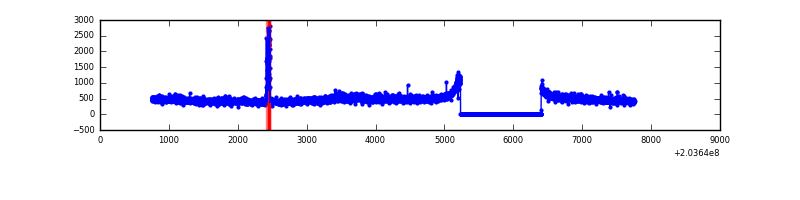 |
| C | 7011 | 5841 | 40 | 40 | 0.57% | 0.68% | 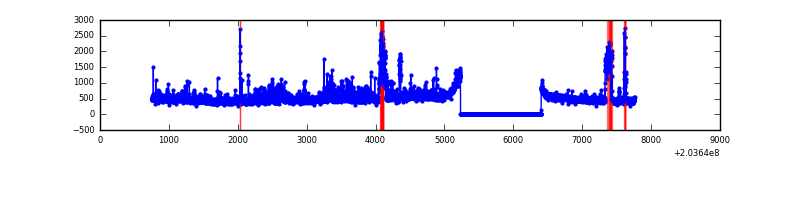 |
| D | 7011 | 5841 | 2 | 2 | 0.03% | 0.03% | 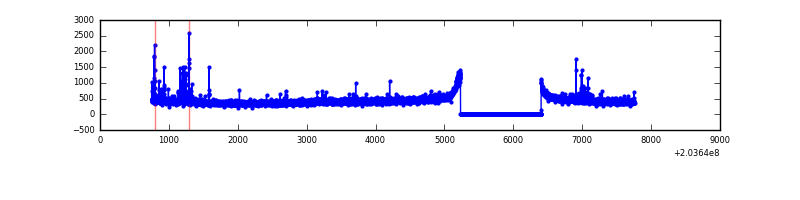 |
Top three noisy pixels from each quadrant. If the there are fewer than three noisy pixels in the level2.evt file, extra rows are filled as -1
| Pixel properties | Quadrant properties | ||||||
|---|---|---|---|---|---|---|---|
| Quadrant | DetID | PixID | Counts | Sigma | Mean | Median | Sigma |
| A | 15 | 234 | 278395 | 1999.49 | 685 | 672 | 138.9 |
| A | 8 | 15 | 109420 | 782.94 | 685 | 672 | 138.9 |
| A | 0 | 50 | 80741 | 576.46 | 685 | 672 | 138.9 |
| B | 14 | 167 | 116111 | 862.86 | 692 | 678 | 133.8 |
| B | 15 | 204 | 93262 | 692.07 | 692 | 678 | 133.8 |
| B | 12 | 111 | 11741 | 82.7 | 692 | 678 | 133.8 |
| C | 2 | 53 | 733249 | 4706.45 | 663 | 669 | 155.7 |
| C | 14 | 67 | 35531 | 223.97 | 663 | 669 | 155.7 |
| C | 1 | 16 | 15075 | 92.55 | 663 | 669 | 155.7 |
| D | 13 | 248 | 38412 | 234.98 | 663 | 645 | 160.7 |
| D | 12 | 110 | 27398 | 166.45 | 663 | 645 | 160.7 |
| D | 2 | 14 | 11939 | 70.27 | 663 | 645 | 160.7 |
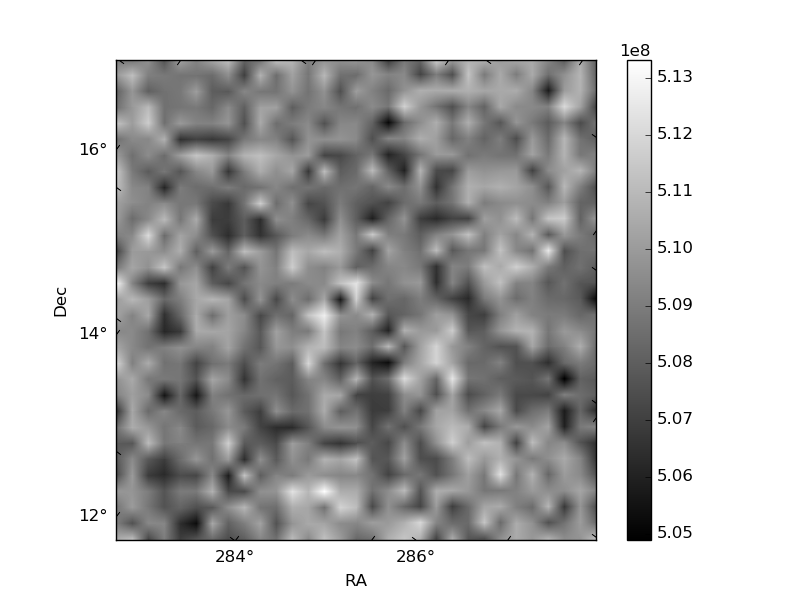
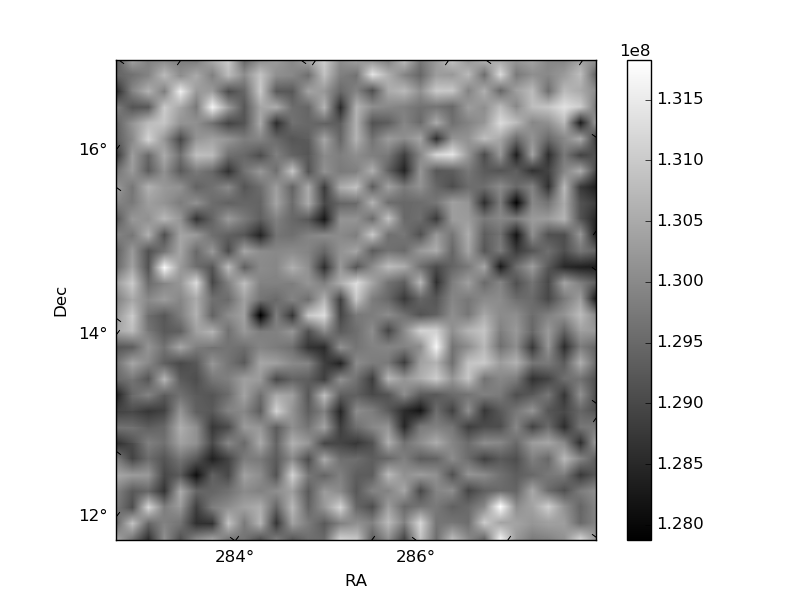
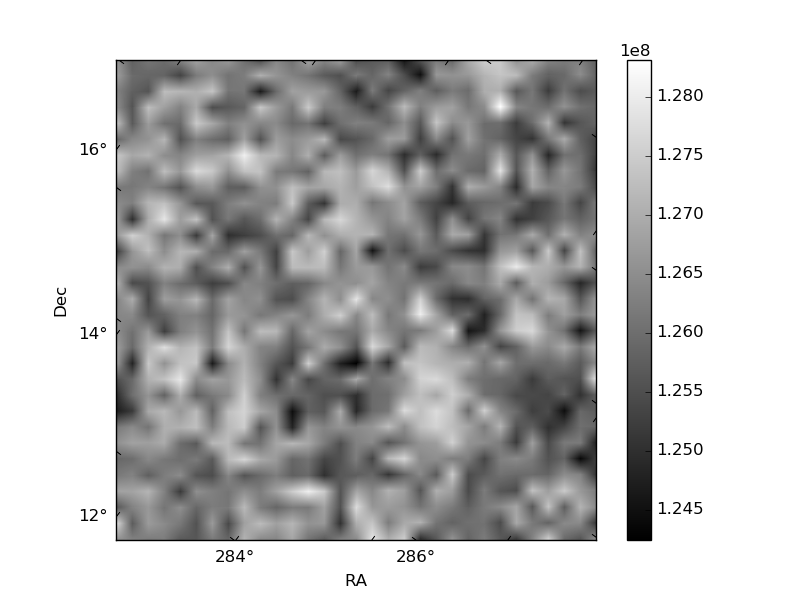
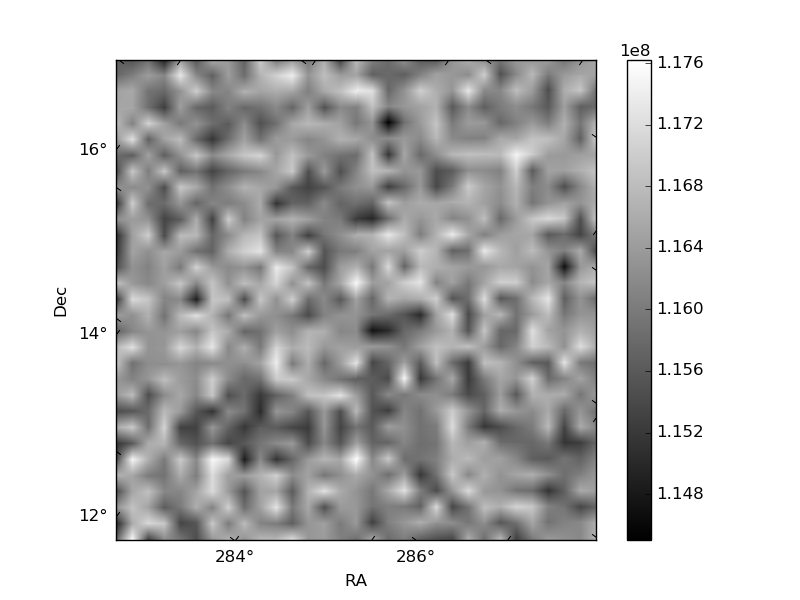
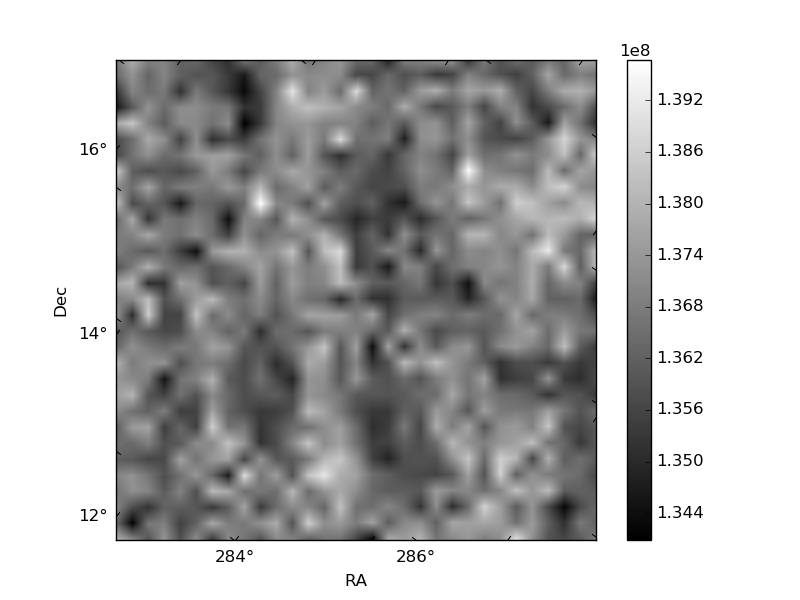
Histogram calculated using DETX and DETY for each event in the final _common_clean file
| Quadrant A | 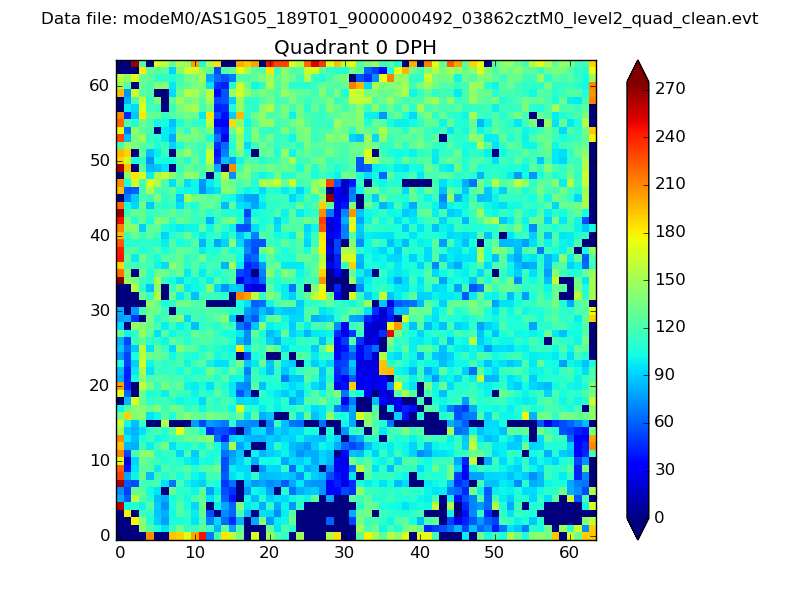 |
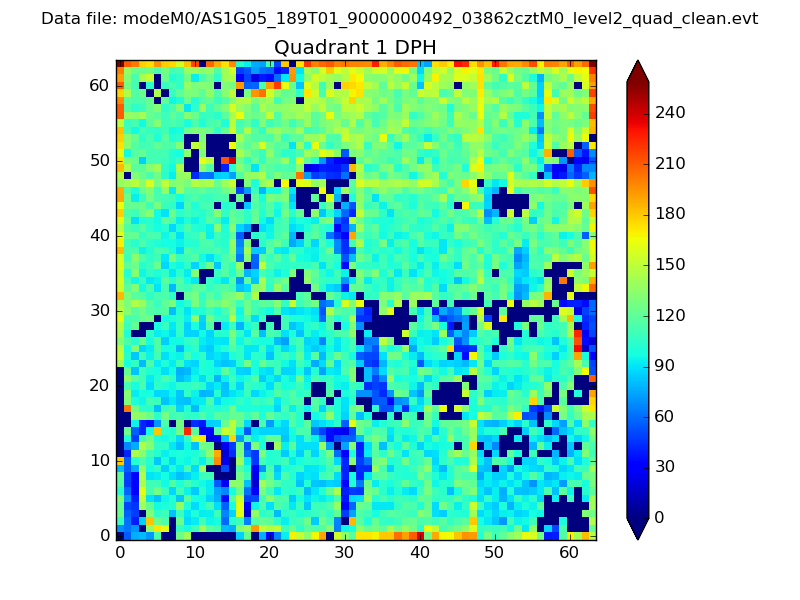 |
Quadrant B |
|---|---|---|---|
| Quadrant D | 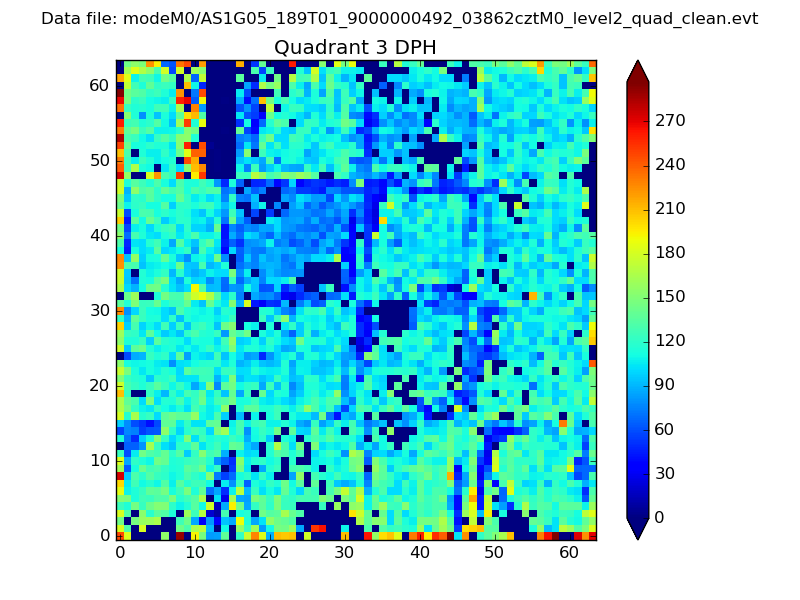 |
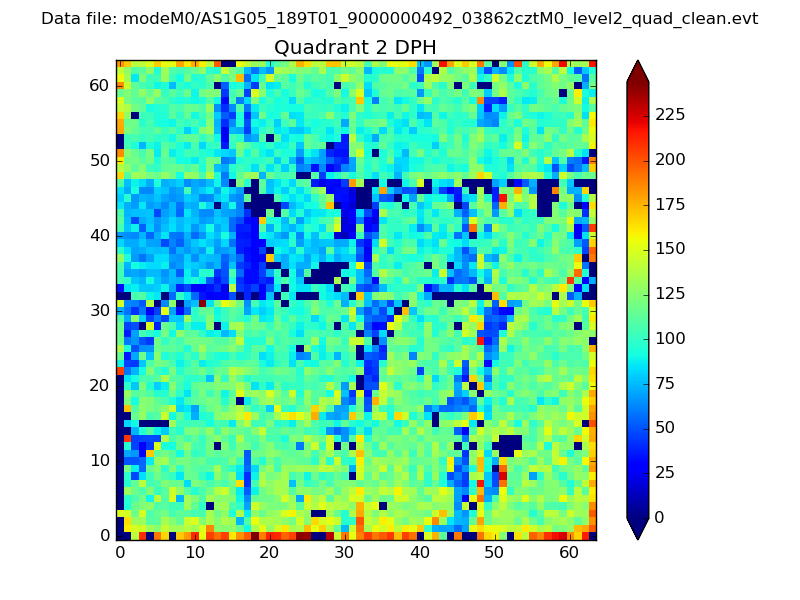 |
Quadrant C |
| Plot type | Count rate plots | Images |
|---|---|---|
| Comparison with Poisson distribution Blue bars denote a histogram of data divided into 1 sec bins. Red curve is a Poisson curve with rate = median count rate of data. |
 |
 |
| Quadrant-wise count rates Data is divided into 100 sec bins |
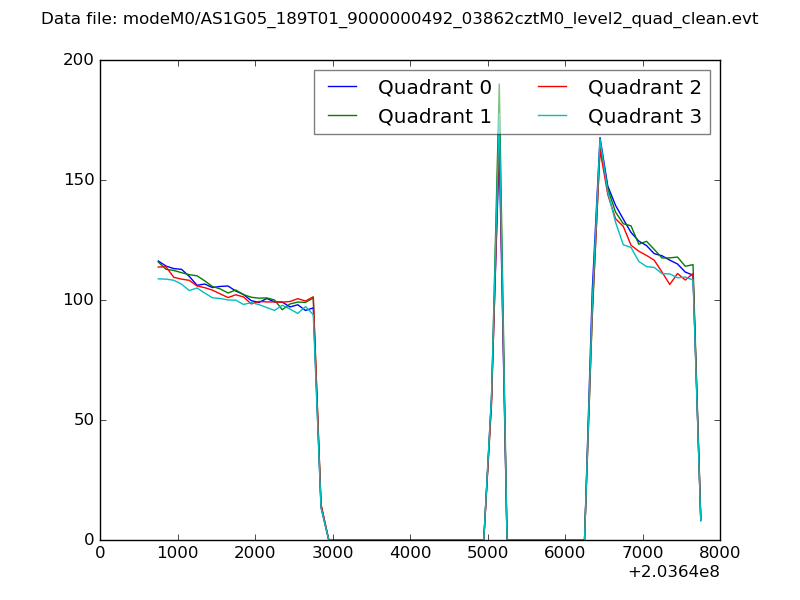 |
|
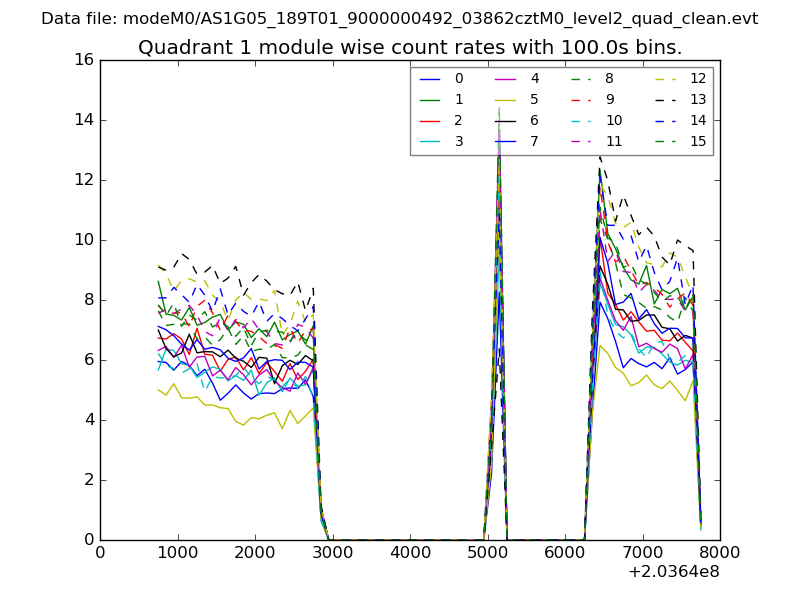
| Module-wise count rates for Quadrant A Data is divided into 100 sec bins |
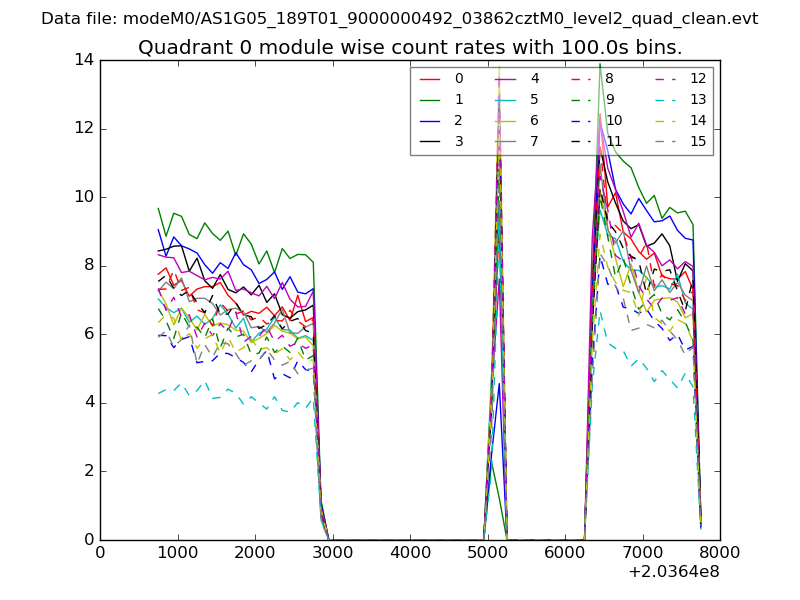 |
 |
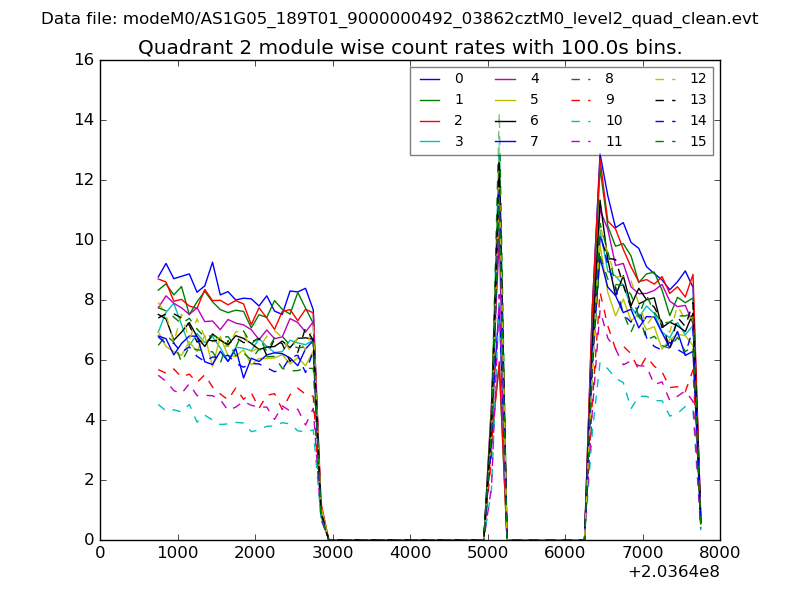
| Module-wise count rates for Quadrant B Data is divided into 100 sec bins |
 |
 |
| Module-wise count rates for Quadrant C Data is divided into 100 sec bins |
 |
 |
| Module-wise count rates for Quadrant D Data is divided into 100 sec bins |
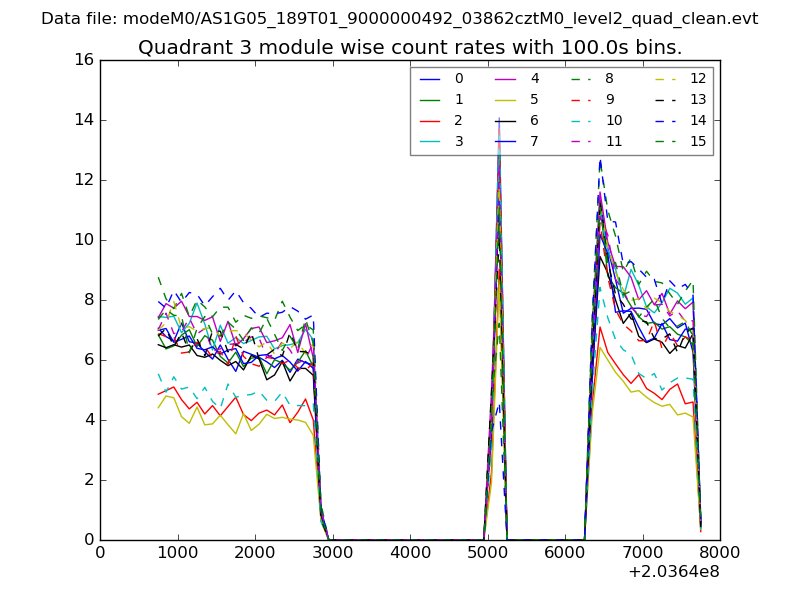 |
 |
| Parameter | Plot |
|---|---|
| CZT HV Monitor | 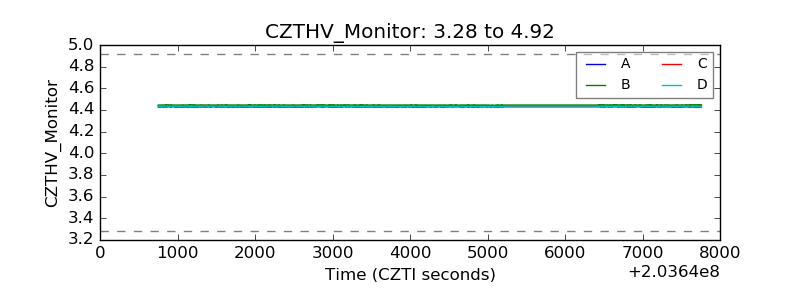 |
| D_VDD | 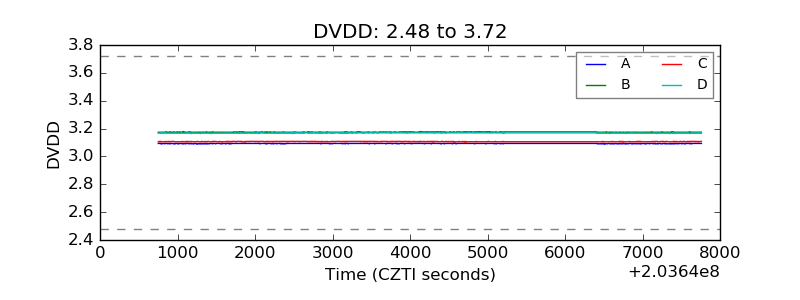 |
| Temperature 1 | 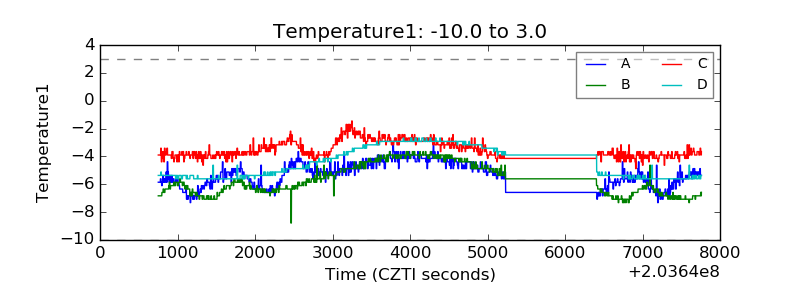 |
| Veto HV Monitor | 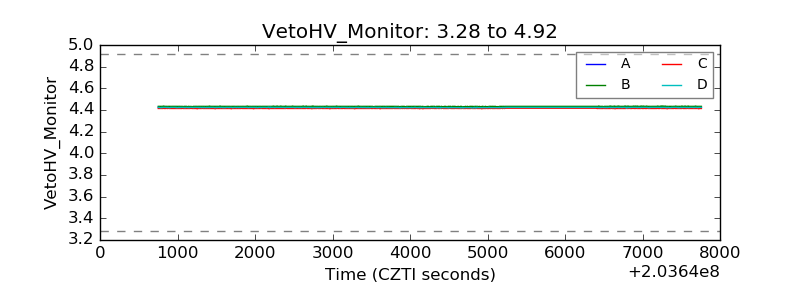 |
| Veto LLD | 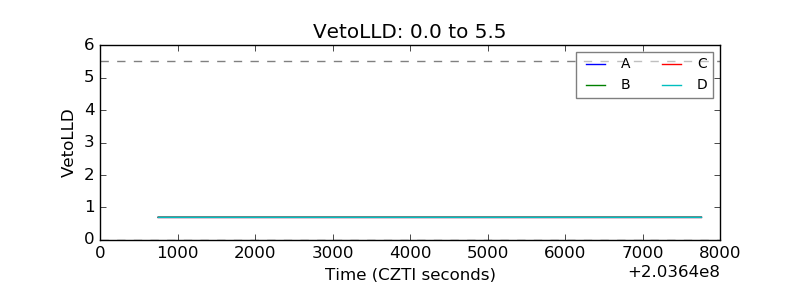 |
| Alpha Counter | 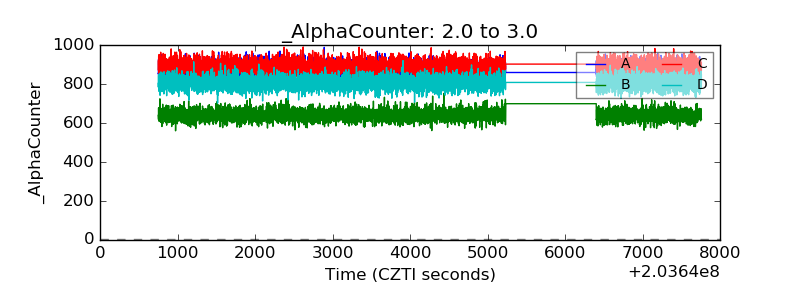 |
| _CPM_Rate | 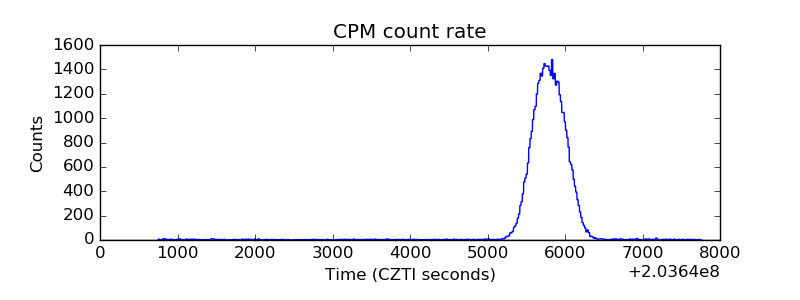 |
| CZT Counter | 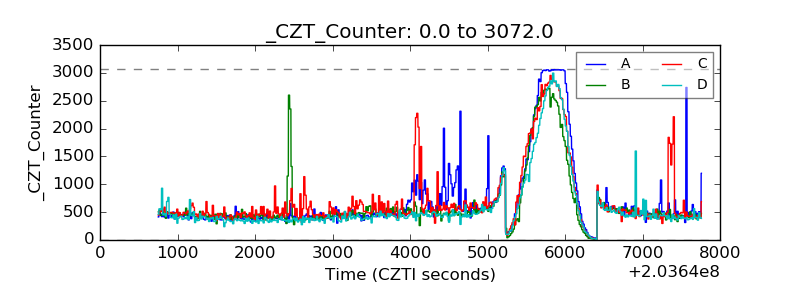 |
| +2.5 Volts monitor |  |
| +5 Volts monitor |  |
| Veto Counter | 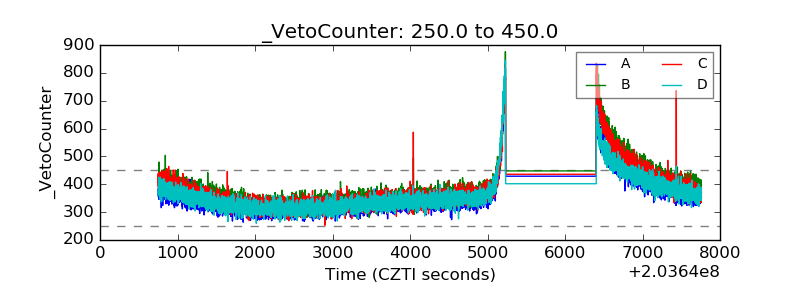 |