| Param | Original file | Final file |
|---|---|---|
| Filename | modeM0/AS1G05_189T01_9000000492_03863cztM0_level2.evt | modeM0/AS1G05_189T01_9000000492_03863cztM0_level2_quad_clean.evt |
| Size (bytes) | 408,378,240 | 72,290,880 |
| Size | 389.5 MB | 68.9 MB |
| Events in quadrant A | 3,134,953 | 449,613 |
| Events in quadrant B | 2,949,188 | 454,001 |
| Events in quadrant C | 3,169,253 | 434,647 |
| Events in quadrant D | 2,703,060 | 428,256 |
| Mode M0 | |||
|---|---|---|---|
| Quadrant | BADHDUFLAG | Total packets | Discarded packets |
| A | 0 | 13278 | 2 |
| B | 0 | 12701 | 1 |
| C | 0 | 13424 | 1 |
| D | 0 | 12523 | 1 |
| Mode M9 | |||
|---|---|---|---|
| Quadrant | BADHDUFLAG | Total packets | Discarded packets |
| A | 0 | 12 | 0 |
| B | 0 | 12 | 0 |
| C | 0 | 12 | 0 |
| D | 0 | 12 | 0 |
| Mode SS | |||
|---|---|---|---|
| Quadrant | BADHDUFLAG | Total packets | Discarded packets |
| A | 0 | 124 | 0 |
| B | 0 | 124 | 0 |
| C | 0 | 124 | 0 |
| D | 0 | 124 | 0 |
| Quadrant | Total seconds | Saturated seconds | Saturation percentage |
|---|---|---|---|
| A | 6044 | 56 | 0.926539% |
| B | 6044 | 57 | 0.943084% |
| C | 6044 | 44 | 0.727995% |
| D | 6044 | 29 | 0.479815% |
Noise dominated data is calculated using 1-second bins in cleaned event files. If a bin has >2000 counts, and if more than 50% of those come from <1% of pixels, then it is considered to be noise-dominated and hence unusable.
| Quadrant | # 1 sec bins | Bins with >0 counts | Bins with >2000 counts | High rate bins dominated by noise | Noise dominated (total time) | Noise dominated (detector-on time) | Marked lightcurve |
|---|---|---|---|---|---|---|---|
| A | 7284 | 6044 | 8 | 8 | 0.11% | 0.13% | 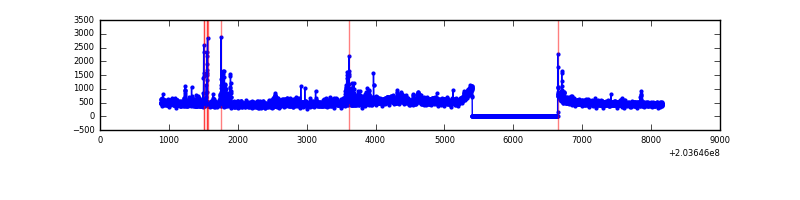 |
| B | 7284 | 6044 | 2 | 2 | 0.03% | 0.03% | 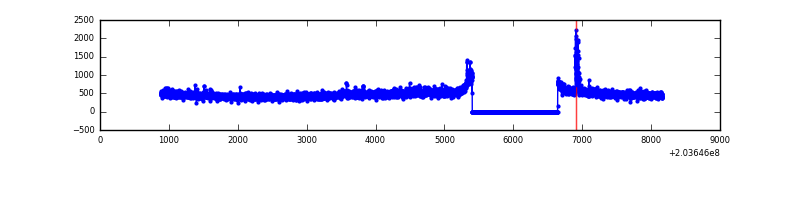 |
| C | 7284 | 6044 | 18 | 18 | 0.25% | 0.30% | 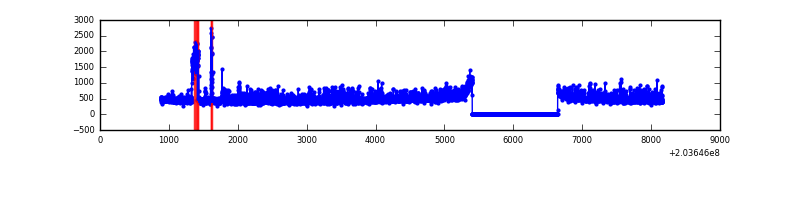 |
| D | 7284 | 6044 | 2 | 2 | 0.03% | 0.03% | 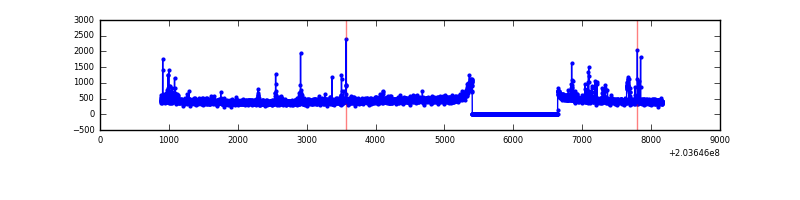 |
Top three noisy pixels from each quadrant. If the there are fewer than three noisy pixels in the level2.evt file, extra rows are filled as -1
| Pixel properties | Quadrant properties | ||||||
|---|---|---|---|---|---|---|---|
| Quadrant | DetID | PixID | Counts | Sigma | Mean | Median | Sigma |
| A | 8 | 15 | 188711 | 1285.56 | 718 | 706 | 146.2 |
| A | 15 | 234 | 129898 | 883.4 | 718 | 706 | 146.2 |
| A | 13 | 251 | 42506 | 285.82 | 718 | 706 | 146.2 |
| B | 15 | 204 | 65142 | 462.96 | 726 | 711 | 139.2 |
| B | 7 | 252 | 35333 | 248.77 | 726 | 711 | 139.2 |
| B | 14 | 167 | 23903 | 166.64 | 726 | 711 | 139.2 |
| C | 2 | 53 | 417966 | 2571.48 | 688 | 692 | 162.3 |
| C | 14 | 67 | 60815 | 370.51 | 688 | 692 | 162.3 |
| C | 13 | 61 | 5911 | 32.16 | 688 | 692 | 162.3 |
| D | 13 | 248 | 41869 | 244.94 | 686 | 669 | 168.2 |
| D | 2 | 206 | 31042 | 180.57 | 686 | 669 | 168.2 |
| D | 2 | 14 | 17036 | 97.31 | 686 | 669 | 168.2 |
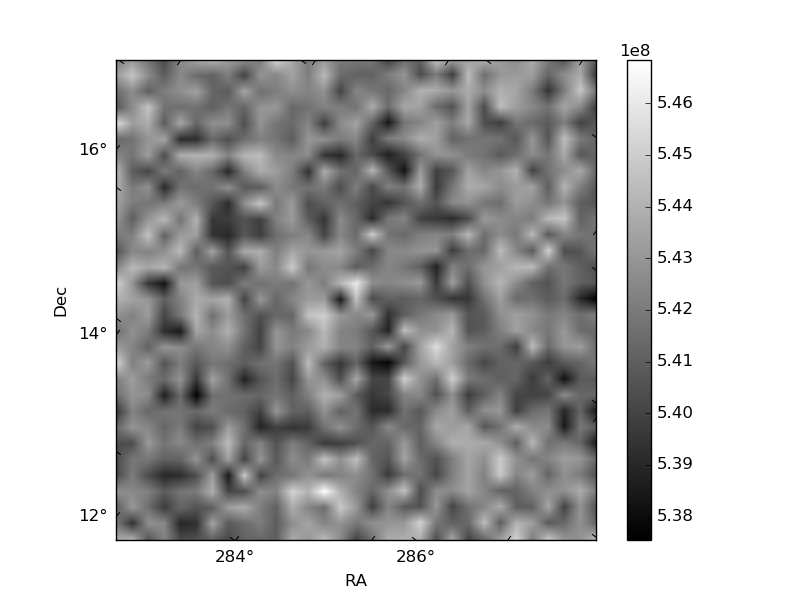
Histogram calculated using DETX and DETY for each event in the final _common_clean file
| Quadrant A | 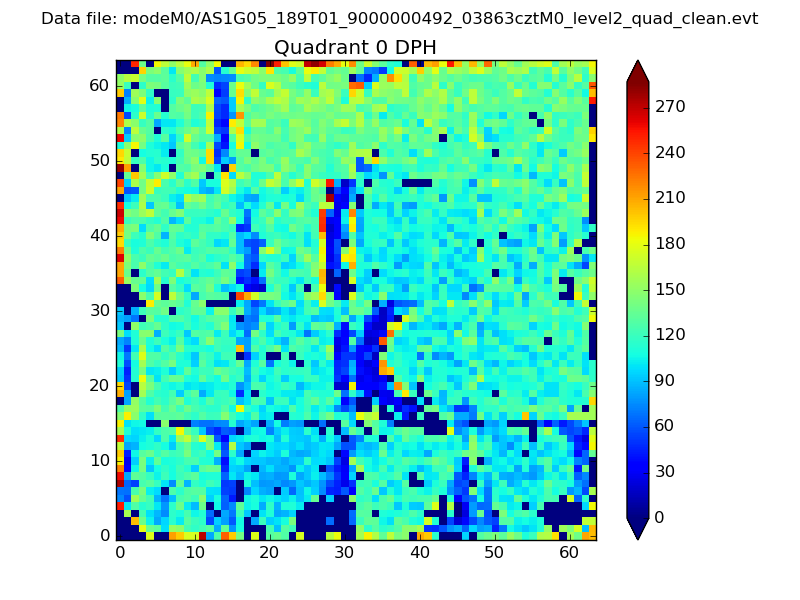 |
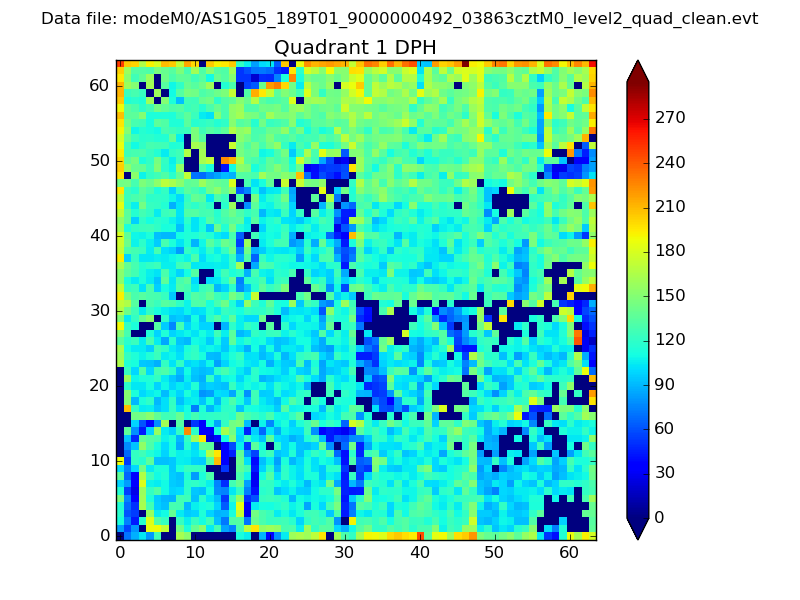 |
Quadrant B |
|---|---|---|---|
| Quadrant D |  |
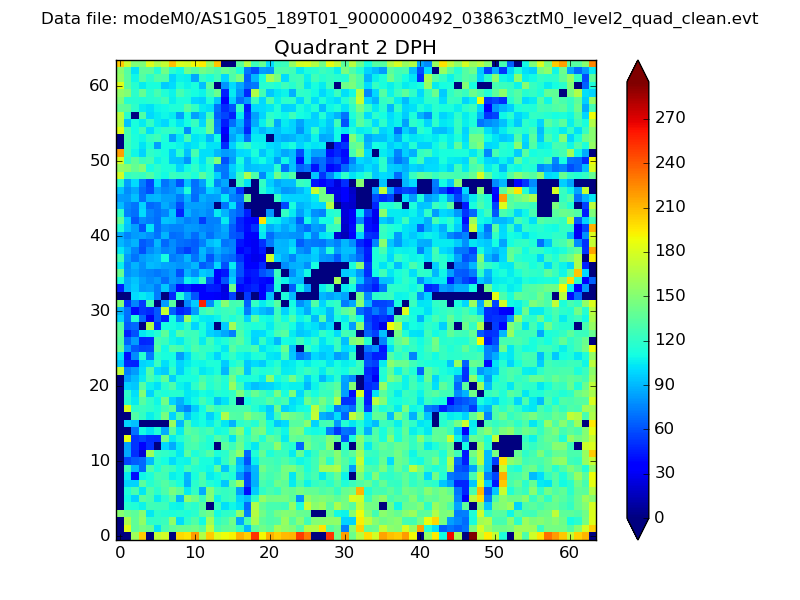 |
Quadrant C |
| Plot type | Count rate plots | Images |
|---|---|---|
| Comparison with Poisson distribution Blue bars denote a histogram of data divided into 1 sec bins. Red curve is a Poisson curve with rate = median count rate of data. |
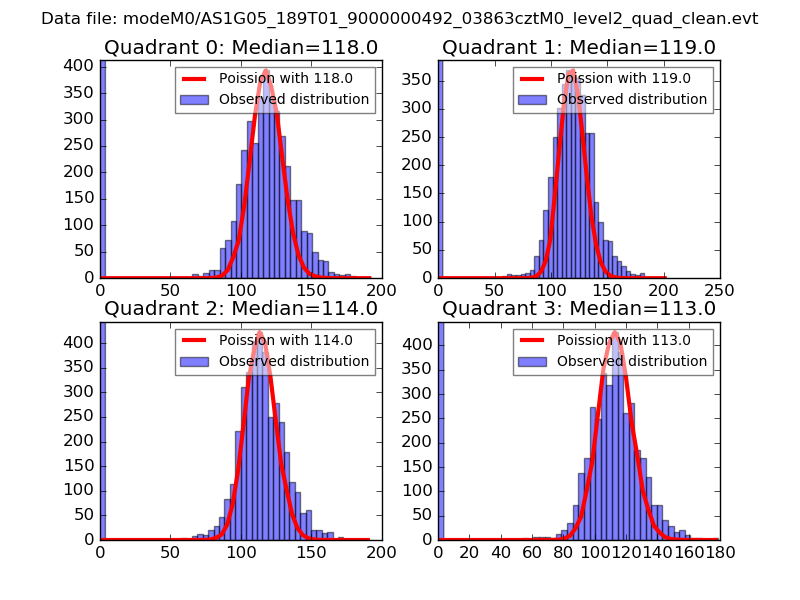 |
 |
| Quadrant-wise count rates Data is divided into 100 sec bins |
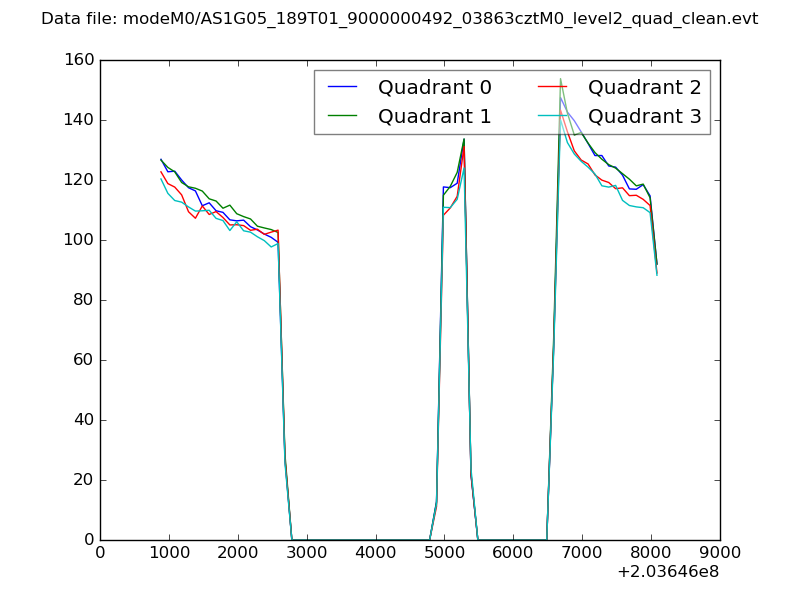 |
|
| Module-wise count rates for Quadrant A Data is divided into 100 sec bins |
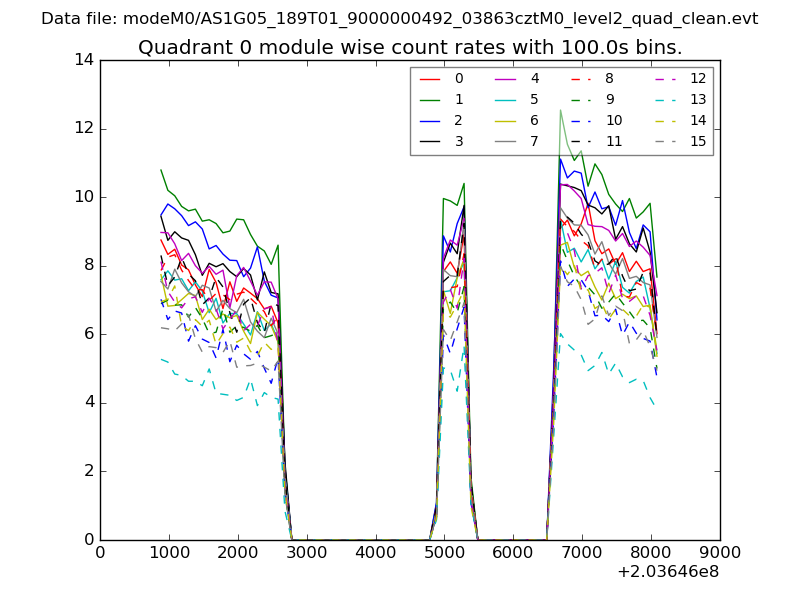 |
 |
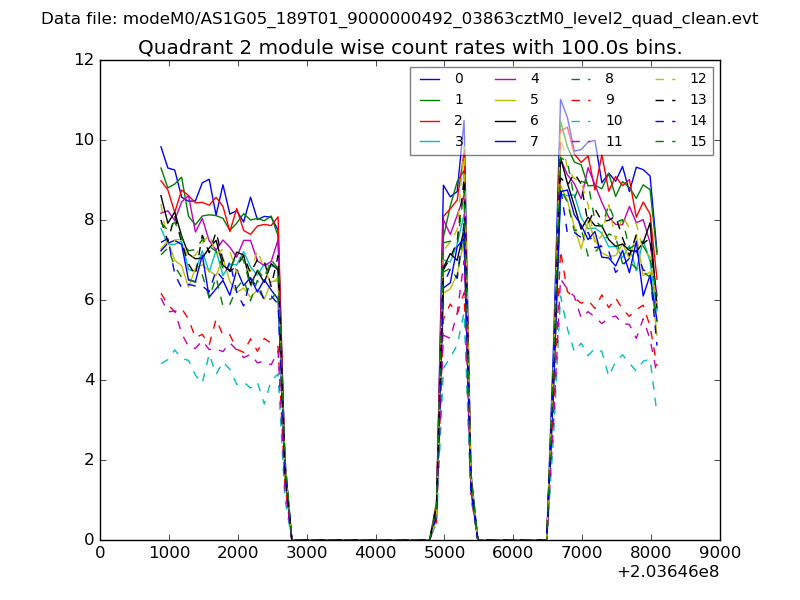
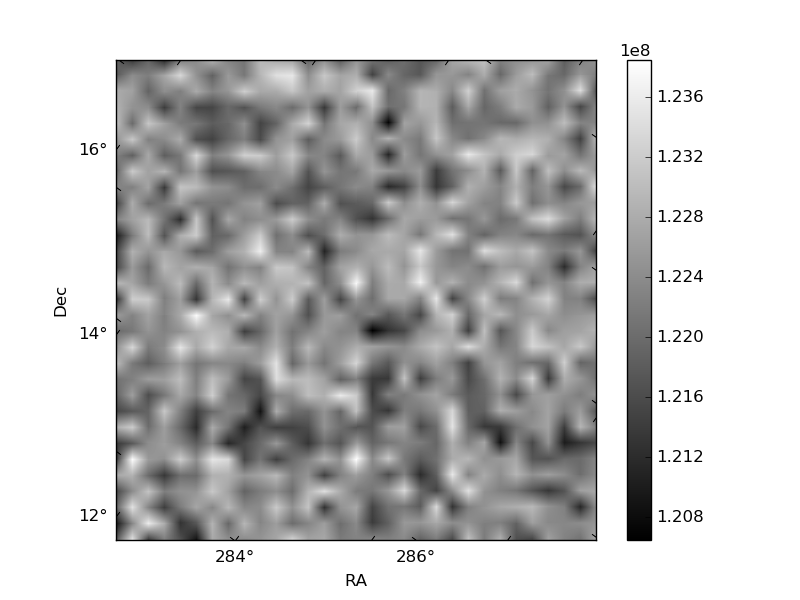
| Module-wise count rates for Quadrant B Data is divided into 100 sec bins |
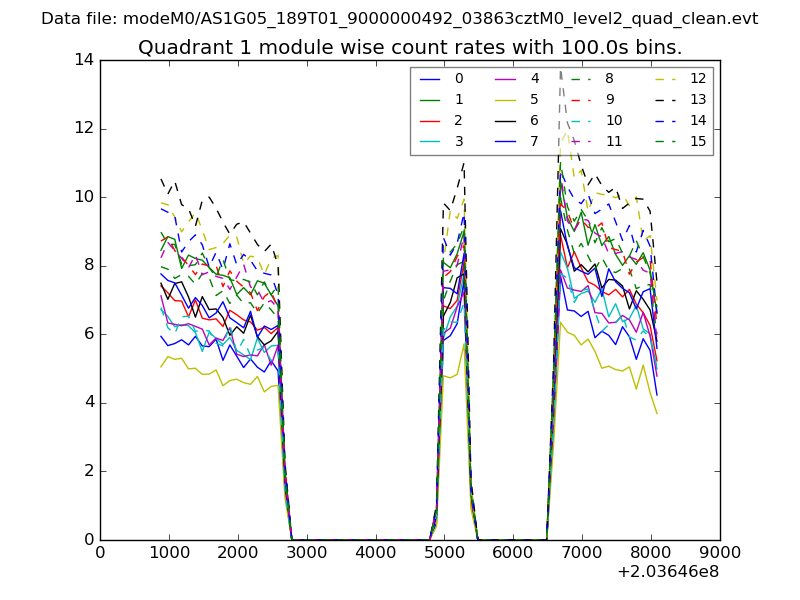 |
 |
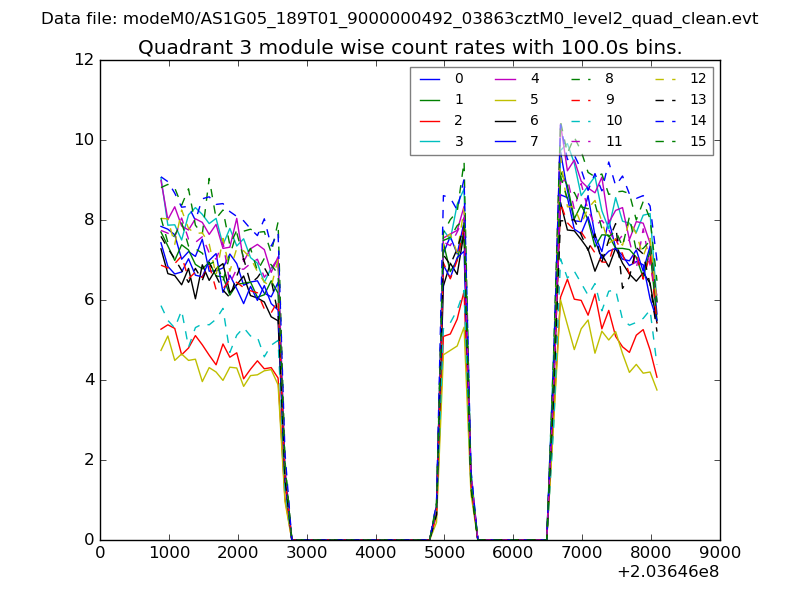
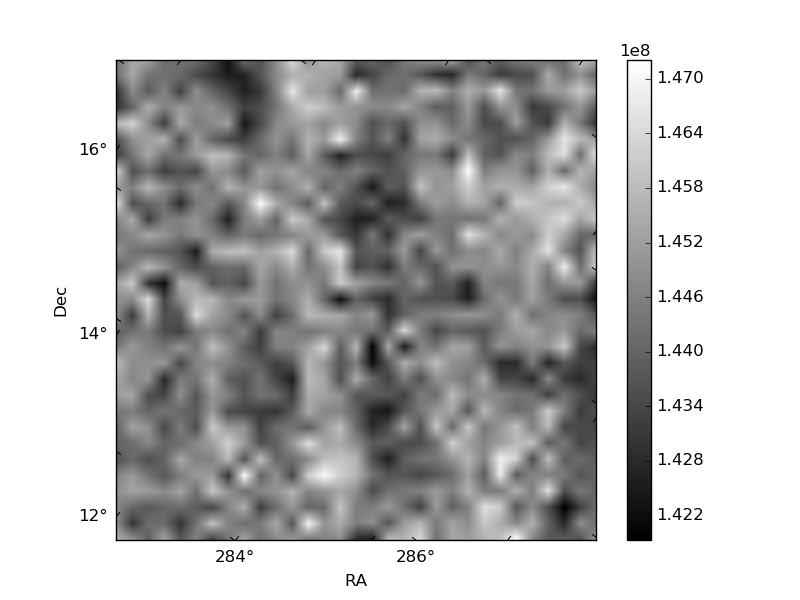
| Module-wise count rates for Quadrant C Data is divided into 100 sec bins |
 |
 |
| Module-wise count rates for Quadrant D Data is divided into 100 sec bins |
 |
 |
| Parameter | Plot |
|---|---|
| CZT HV Monitor | 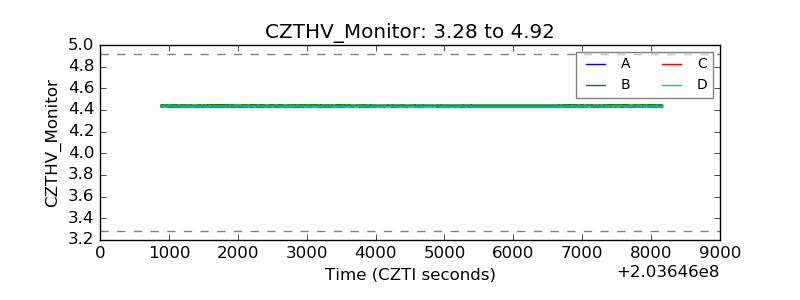 |
| D_VDD | 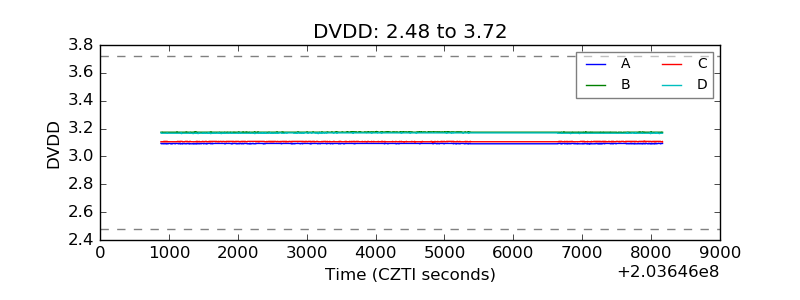 |
| Temperature 1 | 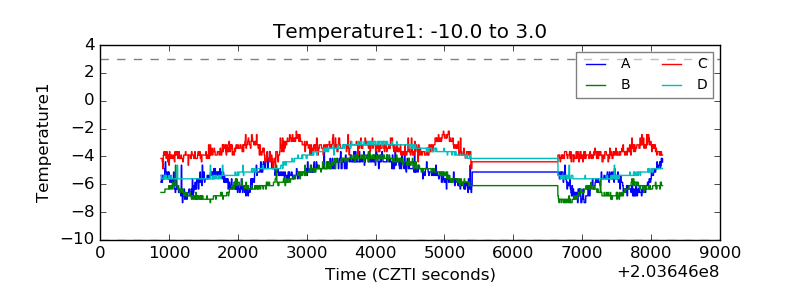 |
| Veto HV Monitor |  |
| Veto LLD | 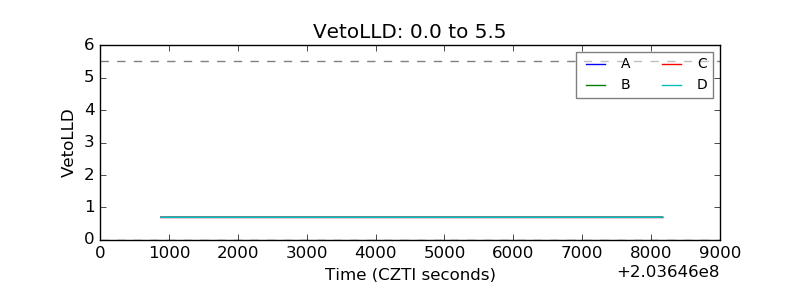 |
| Alpha Counter | 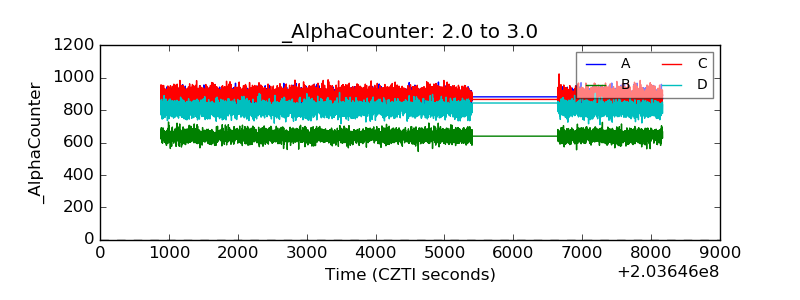 |
| _CPM_Rate | 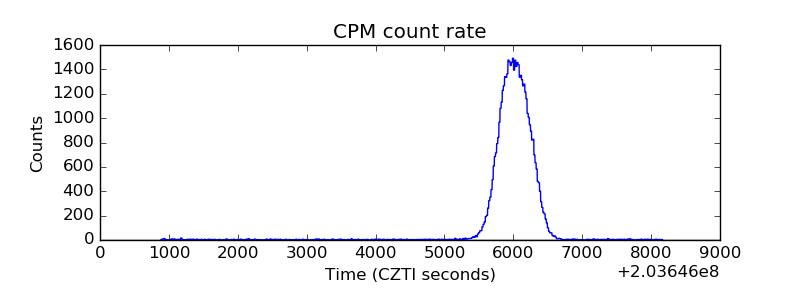 |
| CZT Counter | 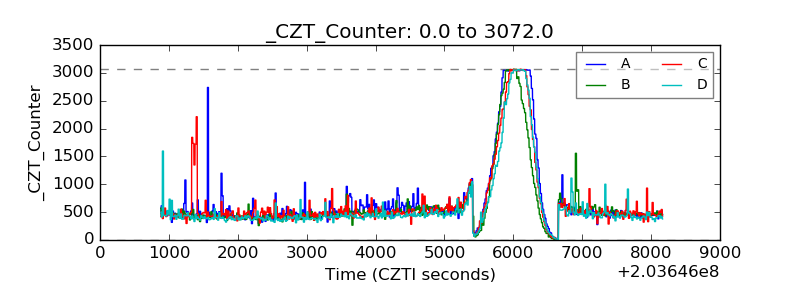 |
| +2.5 Volts monitor |  |
| +5 Volts monitor | 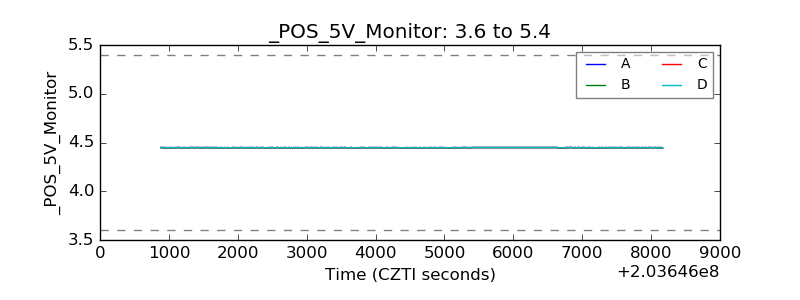 |
| Veto Counter | 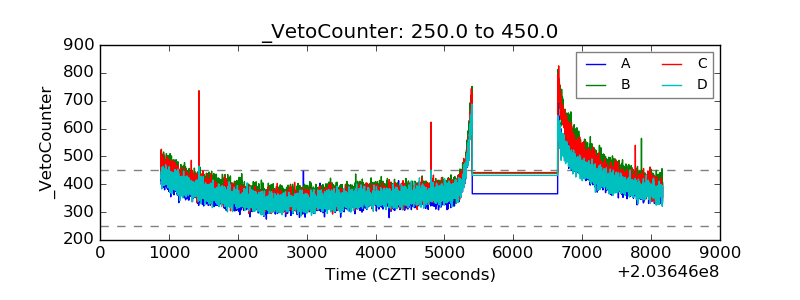 |