| Param | Original file | Final file |
|---|---|---|
| Filename | modeM0/AS1G05_189T01_9000000492_03864cztM0_level2.evt | modeM0/AS1G05_189T01_9000000492_03864cztM0_level2_quad_clean.evt |
| Size (bytes) | 378,135,360 | 66,870,720 |
| Size | 360.6 MB | 63.8 MB |
| Events in quadrant A | 2,762,618 | 415,953 |
| Events in quadrant B | 2,773,674 | 419,893 |
| Events in quadrant C | 2,974,460 | 401,468 |
| Events in quadrant D | 2,559,064 | 394,749 |
| Mode M0 | |||
|---|---|---|---|
| Quadrant | BADHDUFLAG | Total packets | Discarded packets |
| A | 0 | 11808 | 2 |
| B | 0 | 11672 | 1 |
| C | 0 | 12509 | 1 |
| D | 0 | 11715 | 1 |
| Mode M9 | |||
|---|---|---|---|
| Quadrant | BADHDUFLAG | Total packets | Discarded packets |
| A | 0 | 12 | 0 |
| B | 0 | 12 | 0 |
| C | 0 | 12 | 0 |
| D | 0 | 12 | 0 |
| Mode SS | |||
|---|---|---|---|
| Quadrant | BADHDUFLAG | Total packets | Discarded packets |
| A | 0 | 116 | 0 |
| B | 0 | 116 | 0 |
| C | 0 | 116 | 0 |
| D | 0 | 116 | 0 |
| Quadrant | Total seconds | Saturated seconds | Saturation percentage |
|---|---|---|---|
| A | 5605 | 67 | 1.195361% |
| B | 5605 | 73 | 1.302409% |
| C | 5605 | 107 | 1.909010% |
| D | 5605 | 51 | 0.909902% |
Noise dominated data is calculated using 1-second bins in cleaned event files. If a bin has >2000 counts, and if more than 50% of those come from <1% of pixels, then it is considered to be noise-dominated and hence unusable.
| Quadrant | # 1 sec bins | Bins with >0 counts | Bins with >2000 counts | High rate bins dominated by noise | Noise dominated (total time) | Noise dominated (detector-on time) | Marked lightcurve |
|---|---|---|---|---|---|---|---|
| A | 6891 | 5605 | 0 | 0 | 0.00% | 0.00% | 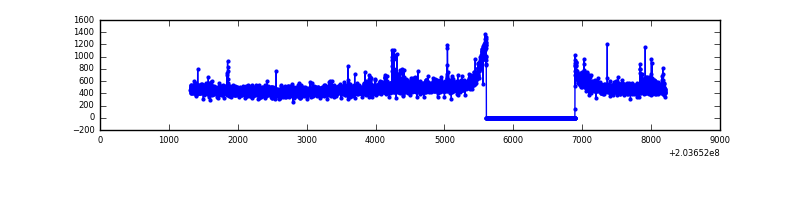 |
| B | 6891 | 5605 | 1 | 1 | 0.01% | 0.02% | 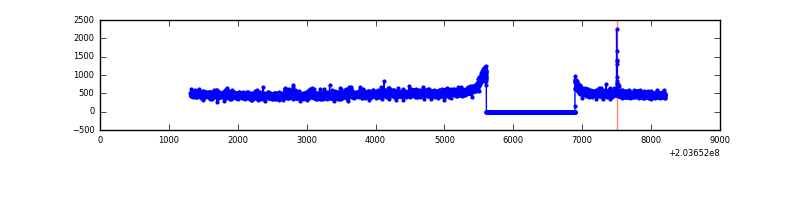 |
| C | 6891 | 5605 | 35 | 35 | 0.51% | 0.62% | 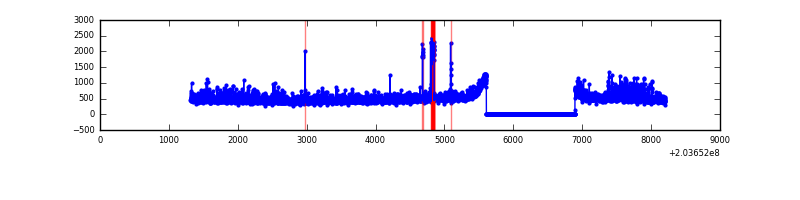 |
| D | 6891 | 5605 | 10 | 10 | 0.15% | 0.18% | 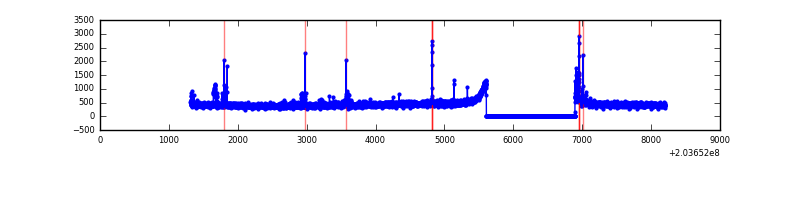 |
Top three noisy pixels from each quadrant. If the there are fewer than three noisy pixels in the level2.evt file, extra rows are filled as -1
| Pixel properties | Quadrant properties | ||||||
|---|---|---|---|---|---|---|---|
| Quadrant | DetID | PixID | Counts | Sigma | Mean | Median | Sigma |
| A | 8 | 15 | 74118 | 526.91 | 687 | 674 | 139.4 |
| A | 15 | 234 | 27214 | 190.41 | 687 | 674 | 139.4 |
| A | 15 | 174 | 12088 | 81.89 | 687 | 674 | 139.4 |
| B | 15 | 204 | 71180 | 528.6 | 691 | 678 | 133.4 |
| B | 14 | 167 | 21594 | 156.82 | 691 | 678 | 133.4 |
| B | 12 | 111 | 11986 | 84.78 | 691 | 678 | 133.4 |
| C | 2 | 53 | 403961 | 2639.92 | 653 | 658 | 152.8 |
| C | 14 | 67 | 7382 | 44.01 | 653 | 658 | 152.8 |
| C | 9 | 247 | 7088 | 42.09 | 653 | 658 | 152.8 |
| D | 2 | 206 | 40483 | 252.63 | 655 | 640 | 157.7 |
| D | 13 | 248 | 34098 | 212.14 | 655 | 640 | 157.7 |
| D | 7 | 223 | 17559 | 107.28 | 655 | 640 | 157.7 |
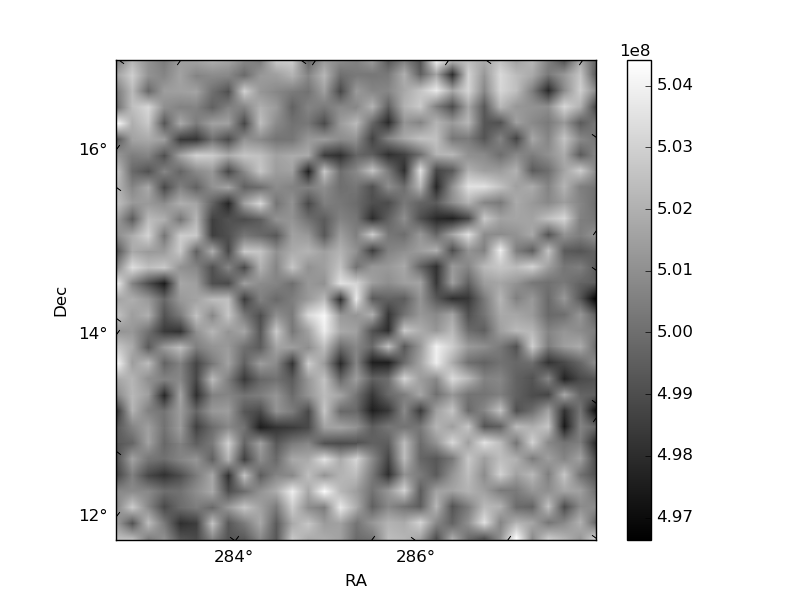
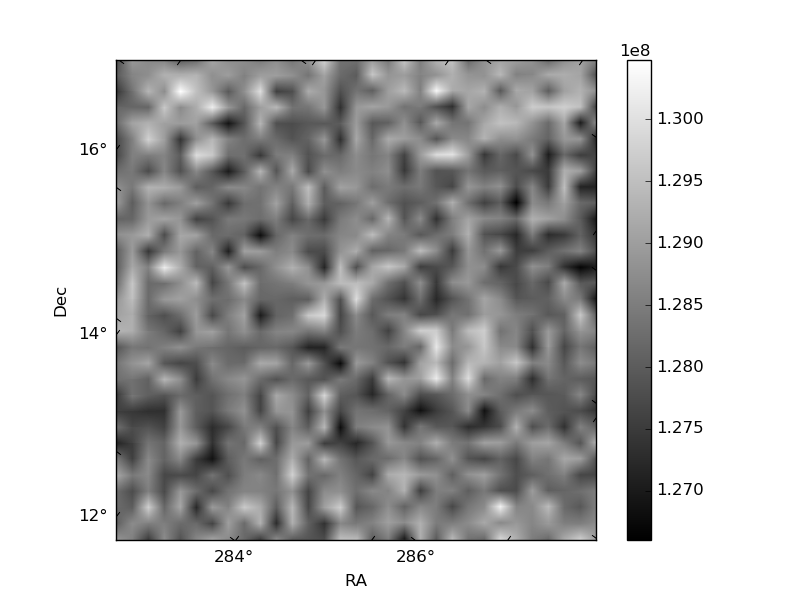
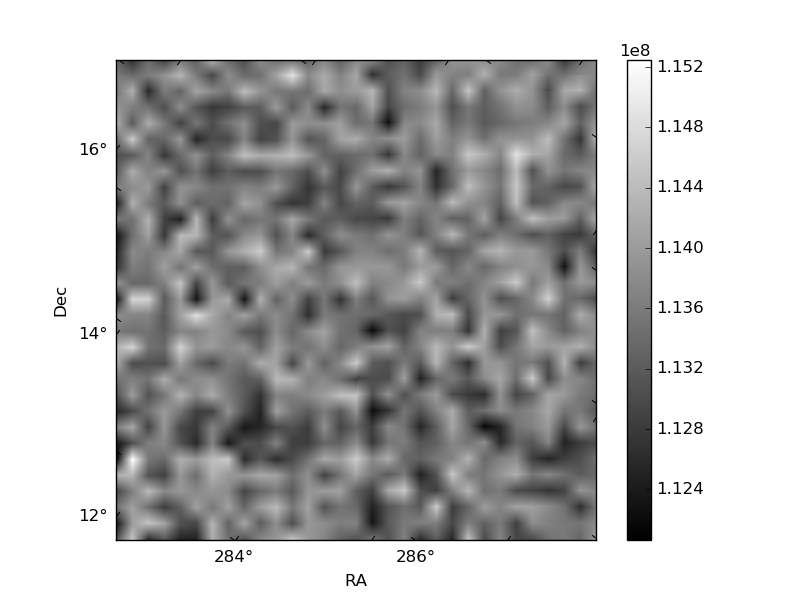
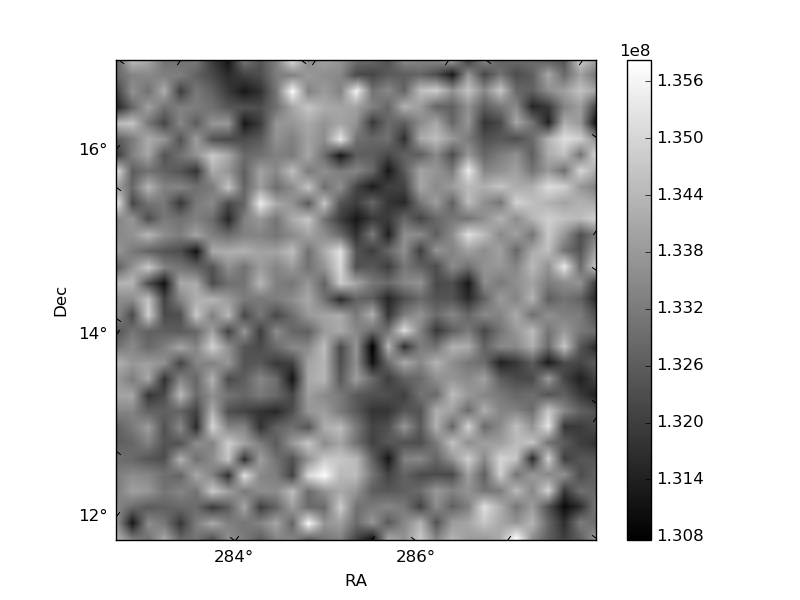
Histogram calculated using DETX and DETY for each event in the final _common_clean file
| Quadrant A | 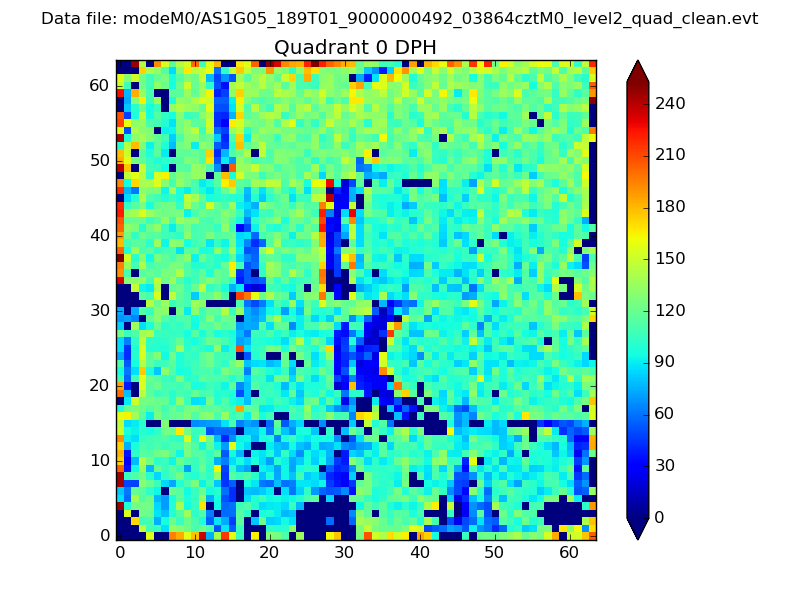 |
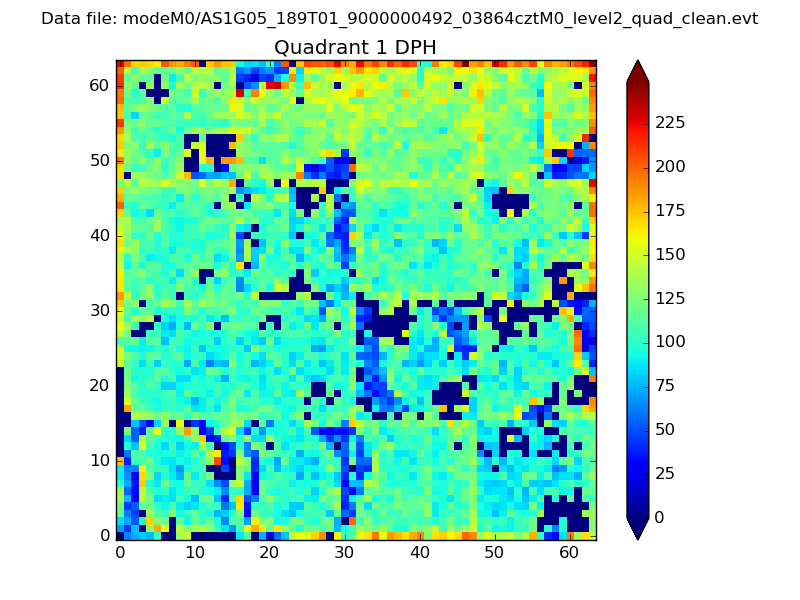 |
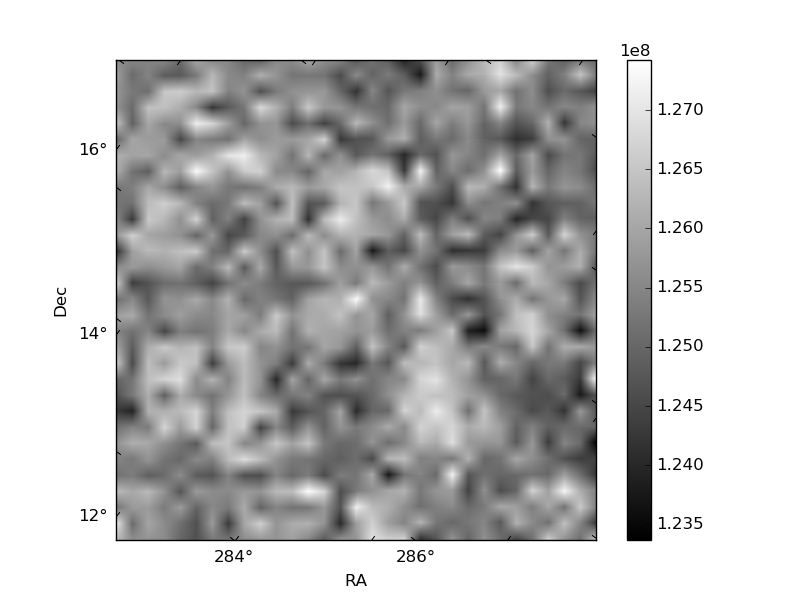
Quadrant B |
|---|---|---|---|
| Quadrant D | 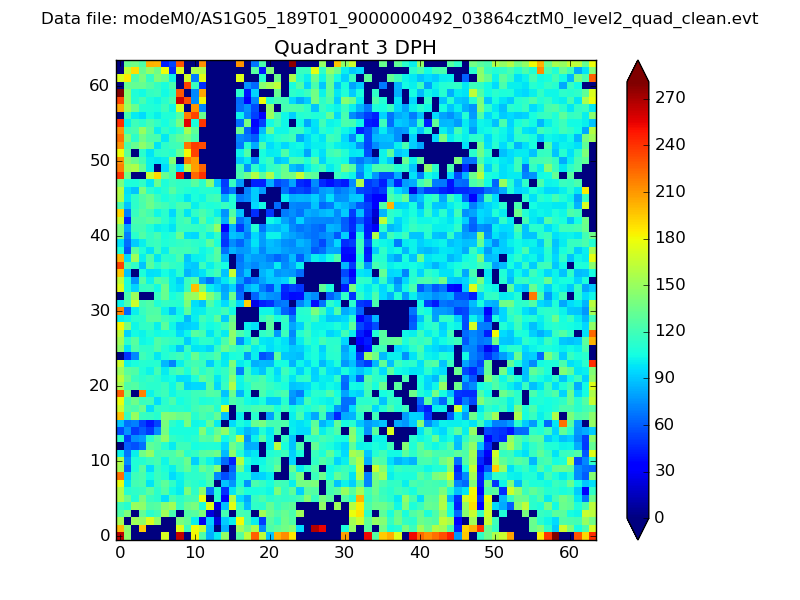 |
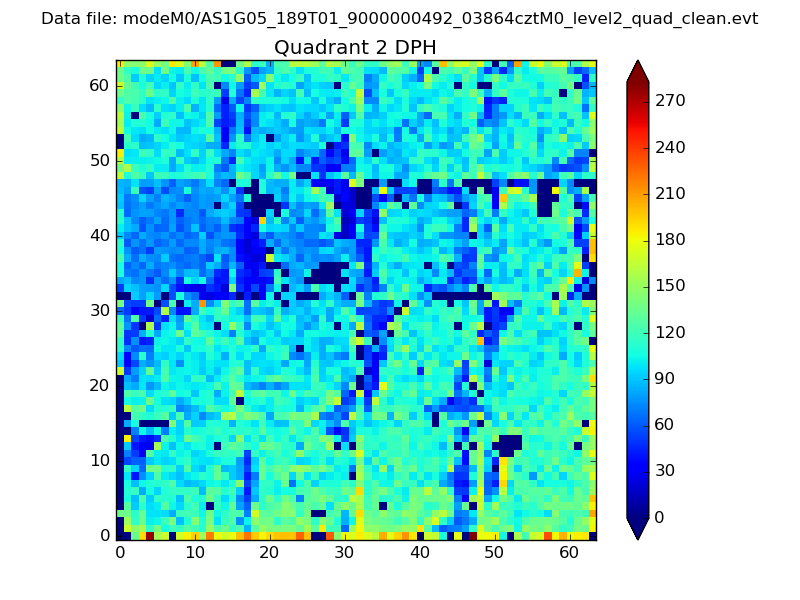 |
Quadrant C |
| Plot type | Count rate plots | Images |
|---|---|---|
| Comparison with Poisson distribution Blue bars denote a histogram of data divided into 1 sec bins. Red curve is a Poisson curve with rate = median count rate of data. |
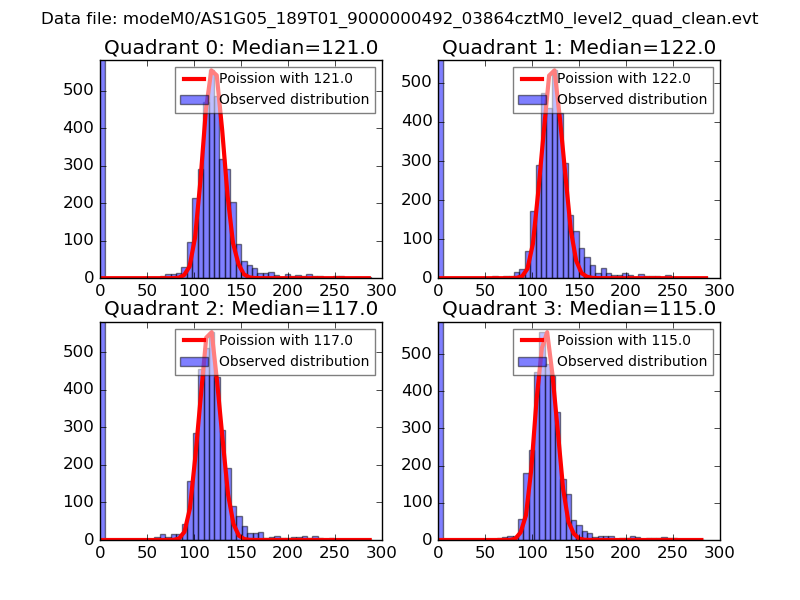 |
 |
| Quadrant-wise count rates Data is divided into 100 sec bins |
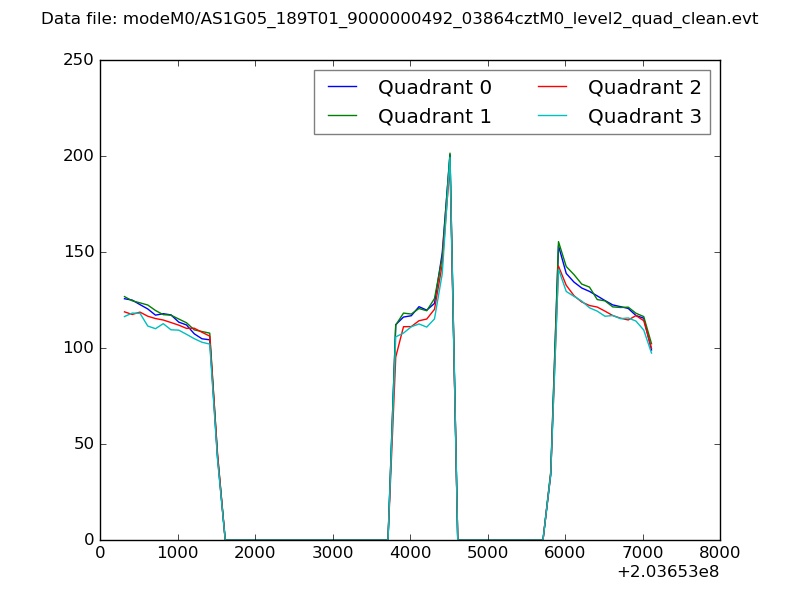 |
|
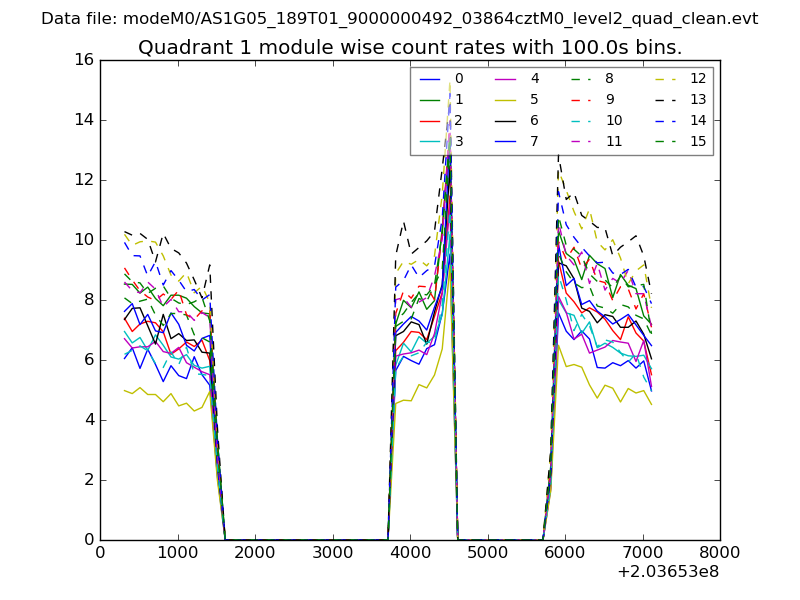
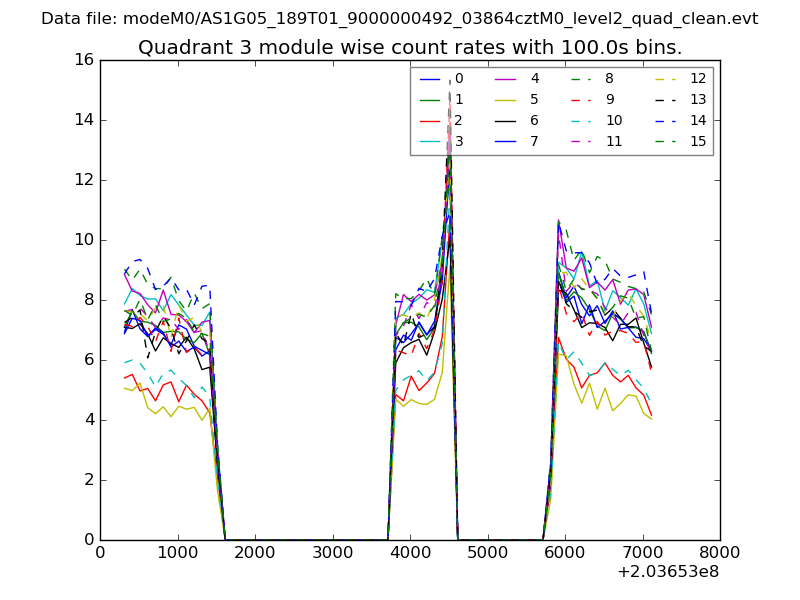
| Module-wise count rates for Quadrant A Data is divided into 100 sec bins |
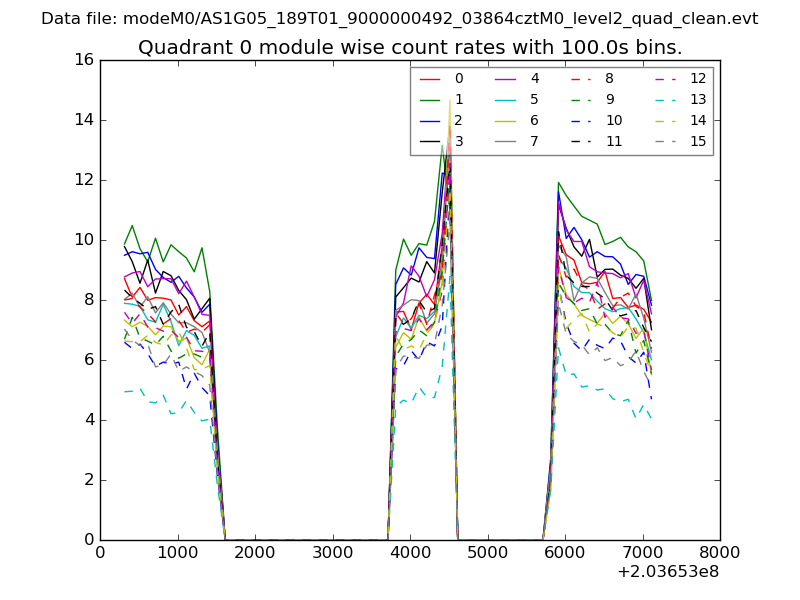 |
 |
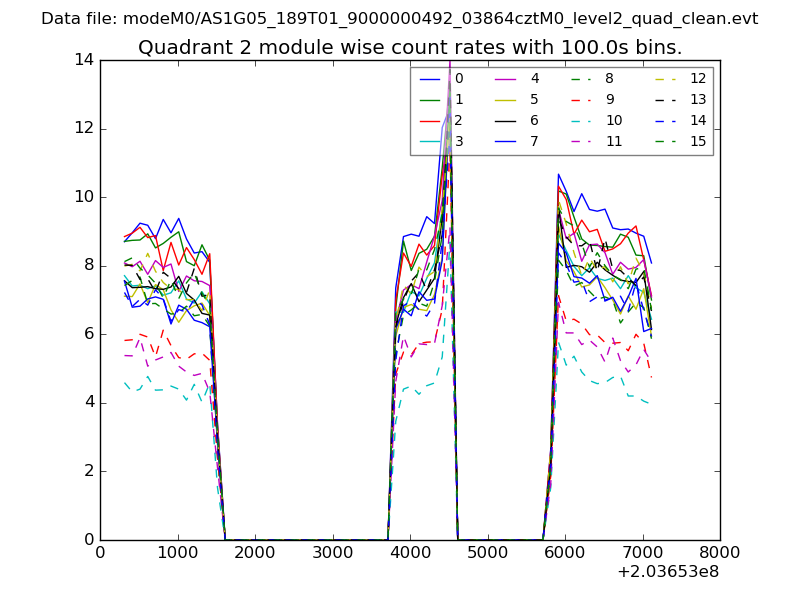
| Module-wise count rates for Quadrant B Data is divided into 100 sec bins |
 |
 |
| Module-wise count rates for Quadrant C Data is divided into 100 sec bins |
 |
 |
| Module-wise count rates for Quadrant D Data is divided into 100 sec bins |
 |
 |
| Parameter | Plot |
|---|---|
| CZT HV Monitor | 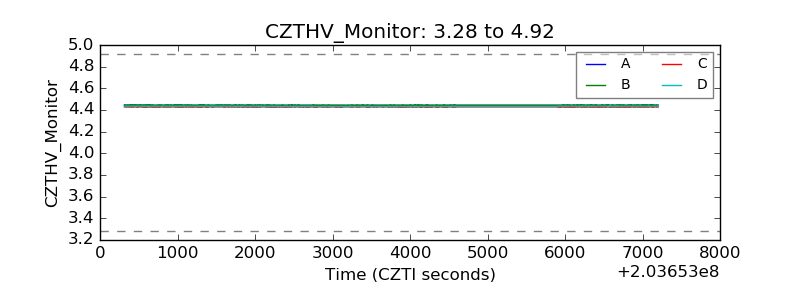 |
| D_VDD | 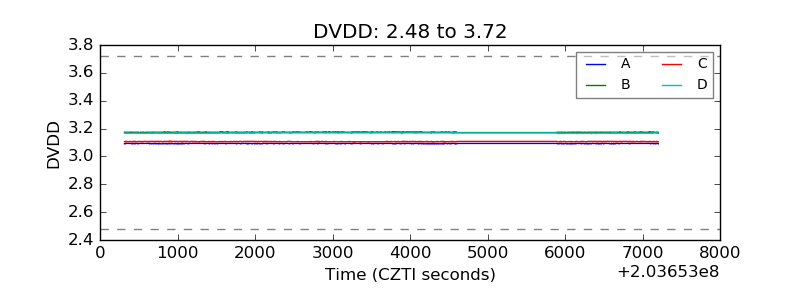 |
| Temperature 1 | 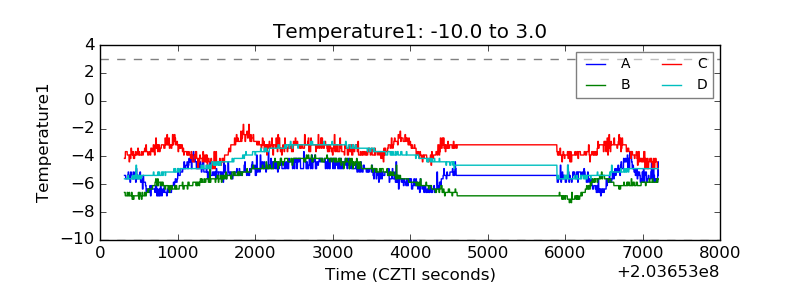 |
| Veto HV Monitor | 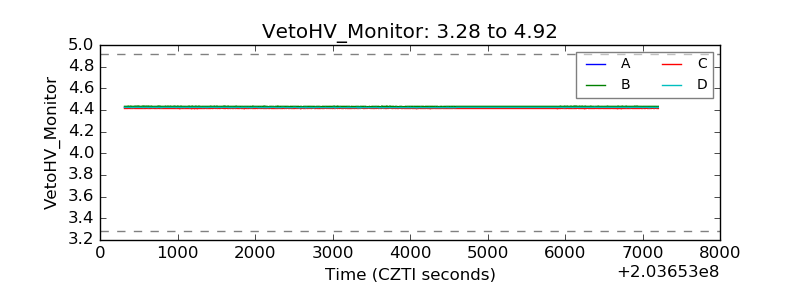 |
| Veto LLD | 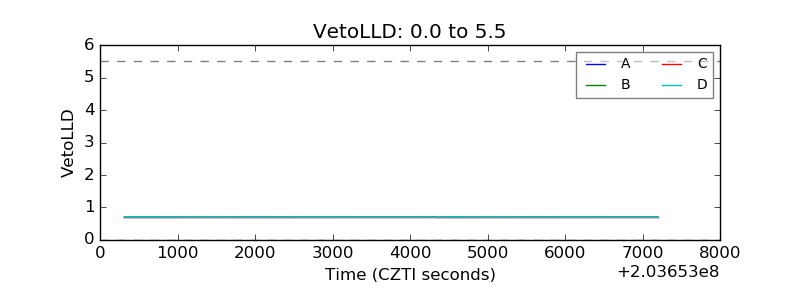 |
| Alpha Counter | 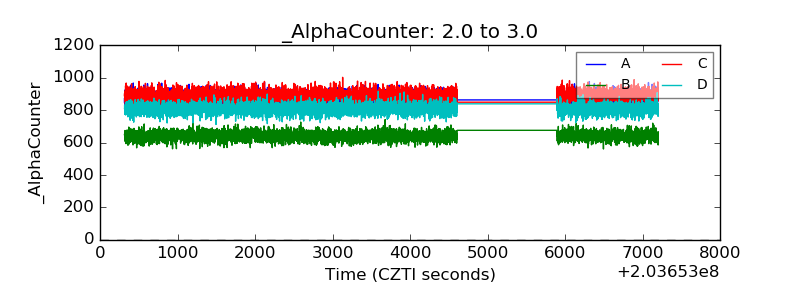 |
| _CPM_Rate | 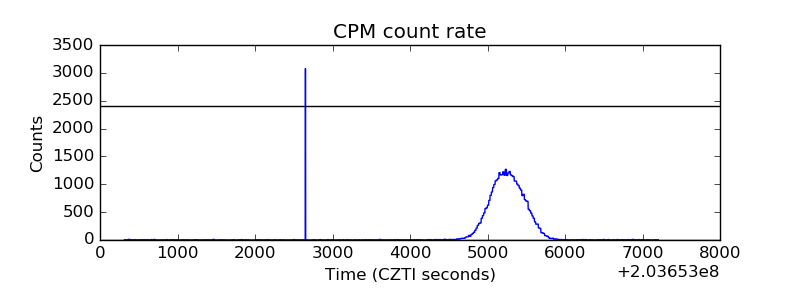 |
| CZT Counter | 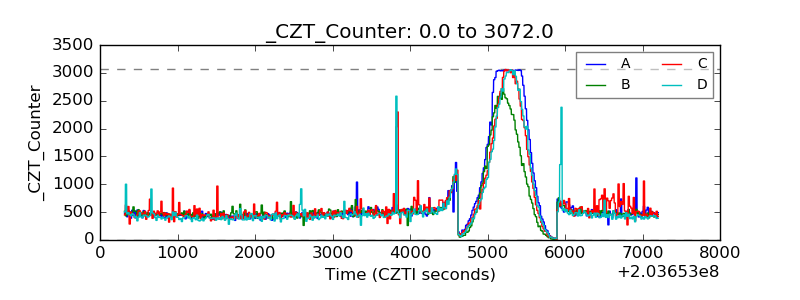 |
| +2.5 Volts monitor | 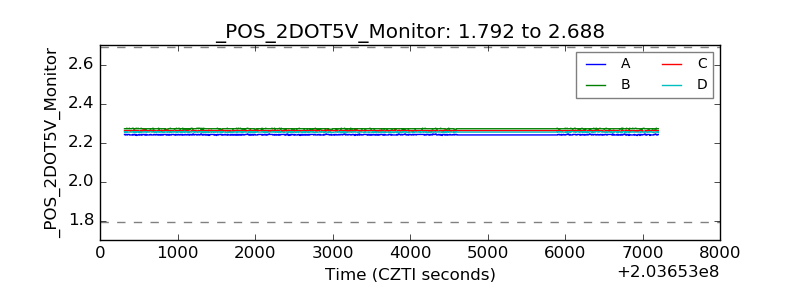 |
| +5 Volts monitor |  |
| Veto Counter | 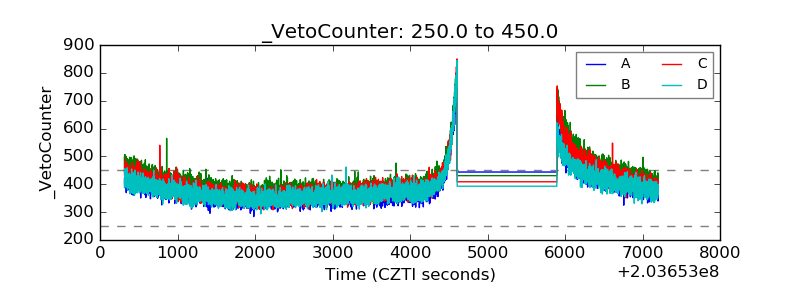 |