| Param | Original file | Final file |
|---|---|---|
| Filename | modeM0/AS1G05_189T01_9000000492_03865cztM0_level2.evt | modeM0/AS1G05_189T01_9000000492_03865cztM0_level2_quad_clean.evt |
| Size (bytes) | 451,753,920 | 75,248,640 |
| Size | 430.8 MB | 71.8 MB |
| Events in quadrant A | 3,356,280 | 464,899 |
| Events in quadrant B | 3,232,306 | 474,622 |
| Events in quadrant C | 3,742,529 | 448,958 |
| Events in quadrant D | 2,917,082 | 445,156 |
| Mode M0 | |||
|---|---|---|---|
| Quadrant | BADHDUFLAG | Total packets | Discarded packets |
| A | 0 | 14015 | 2 |
| B | 0 | 13482 | 1 |
| C | 0 | 15381 | 1 |
| D | 0 | 13299 | 1 |
| Mode M9 | |||
|---|---|---|---|
| Quadrant | BADHDUFLAG | Total packets | Discarded packets |
| A | 0 | 13 | 0 |
| B | 0 | 13 | 0 |
| C | 0 | 13 | 0 |
| D | 0 | 13 | 0 |
| Mode SS | |||
|---|---|---|---|
| Quadrant | BADHDUFLAG | Total packets | Discarded packets |
| A | 0 | 128 | 0 |
| B | 0 | 128 | 0 |
| C | 0 | 128 | 0 |
| D | 0 | 128 | 0 |
| Quadrant | Total seconds | Saturated seconds | Saturation percentage |
|---|---|---|---|
| A | 6382 | 93 | 1.457223% |
| B | 6382 | 97 | 1.519900% |
| C | 6382 | 98 | 1.535569% |
| D | 6382 | 61 | 0.955813% |
Noise dominated data is calculated using 1-second bins in cleaned event files. If a bin has >2000 counts, and if more than 50% of those come from <1% of pixels, then it is considered to be noise-dominated and hence unusable.
| Quadrant | # 1 sec bins | Bins with >0 counts | Bins with >2000 counts | High rate bins dominated by noise | Noise dominated (total time) | Noise dominated (detector-on time) | Marked lightcurve |
|---|---|---|---|---|---|---|---|
| A | 7667 | 6382 | 0 | 0 | 0.00% | 0.00% | 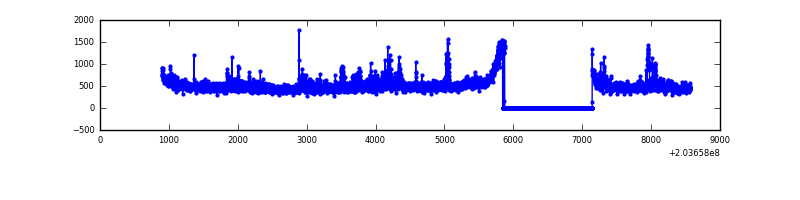 |
| B | 7667 | 6382 | 1 | 1 | 0.01% | 0.02% | 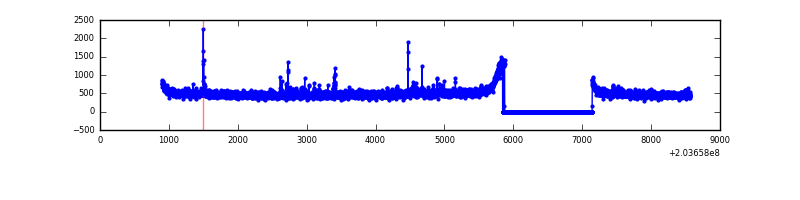 |
| C | 7667 | 6382 | 22 | 22 | 0.29% | 0.34% | 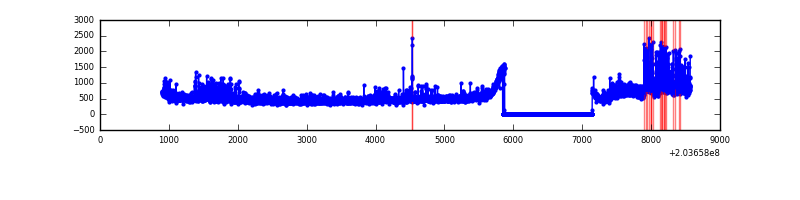 |
| D | 7667 | 6382 | 4 | 4 | 0.05% | 0.06% | 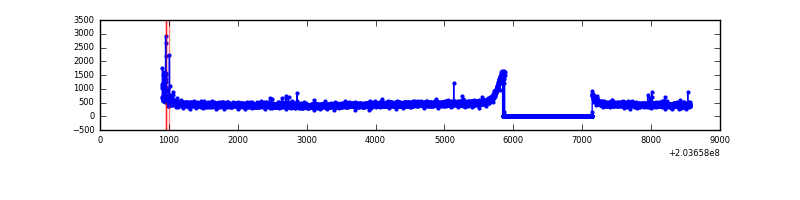 |
Top three noisy pixels from each quadrant. If the there are fewer than three noisy pixels in the level2.evt file, extra rows are filled as -1
| Pixel properties | Quadrant properties | ||||||
|---|---|---|---|---|---|---|---|
| Quadrant | DetID | PixID | Counts | Sigma | Mean | Median | Sigma |
| A | 8 | 15 | 127500 | 783.01 | 798 | 785 | 161.8 |
| A | 15 | 234 | 105427 | 646.62 | 798 | 785 | 161.8 |
| A | 0 | 149 | 21961 | 130.85 | 798 | 785 | 161.8 |
| B | 15 | 204 | 93058 | 595.0 | 799 | 785 | 155.1 |
| B | 14 | 167 | 42228 | 267.24 | 799 | 785 | 155.1 |
| B | 4 | 81 | 13620 | 82.76 | 799 | 785 | 155.1 |
| C | 2 | 53 | 763756 | 4336.44 | 753 | 761 | 175.9 |
| C | 14 | 67 | 15034 | 81.12 | 753 | 761 | 175.9 |
| C | 9 | 247 | 8263 | 42.64 | 753 | 761 | 175.9 |
| D | 13 | 248 | 28610 | 138.28 | 755 | 745 | 201.5 |
| D | 2 | 206 | 12560 | 58.63 | 755 | 745 | 201.5 |
| D | 14 | 226 | 8256 | 37.27 | 755 | 745 | 201.5 |
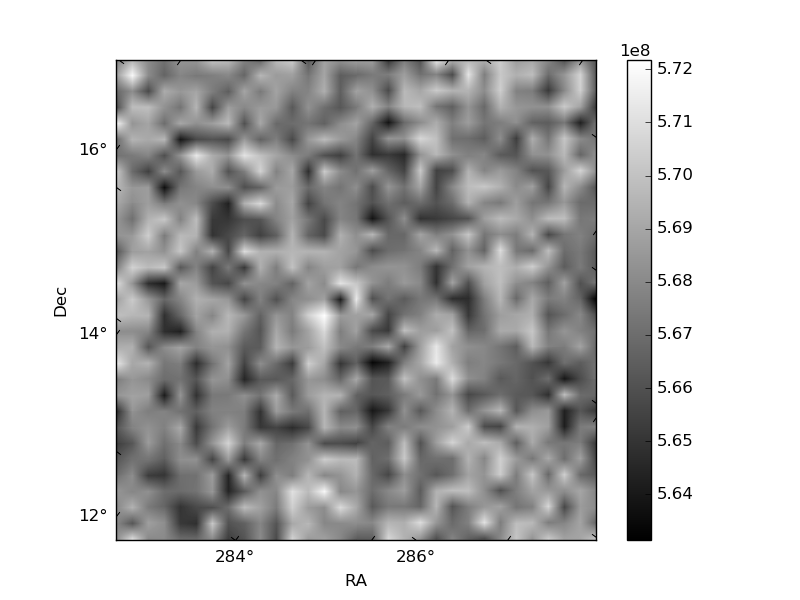
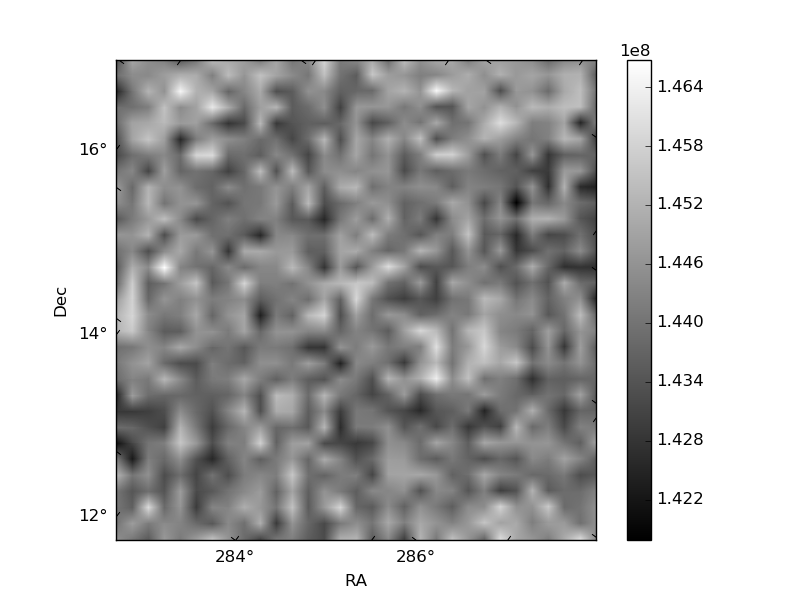
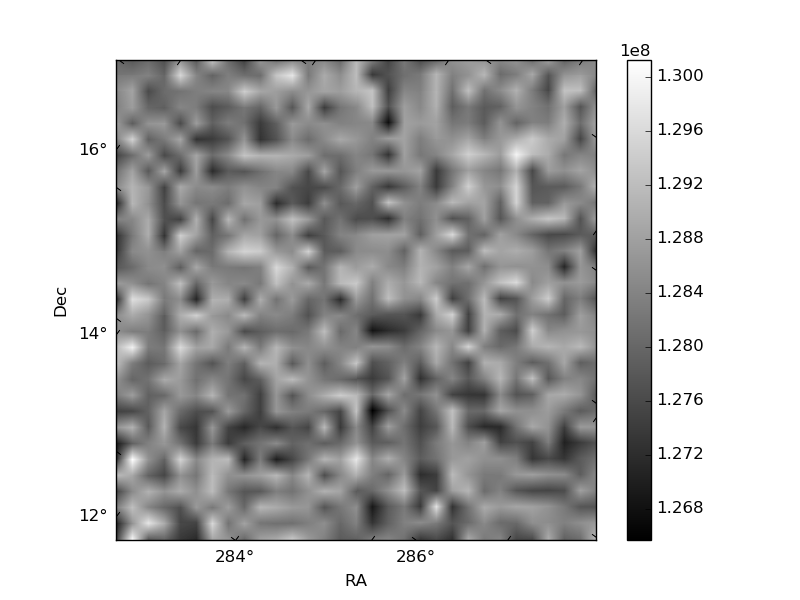
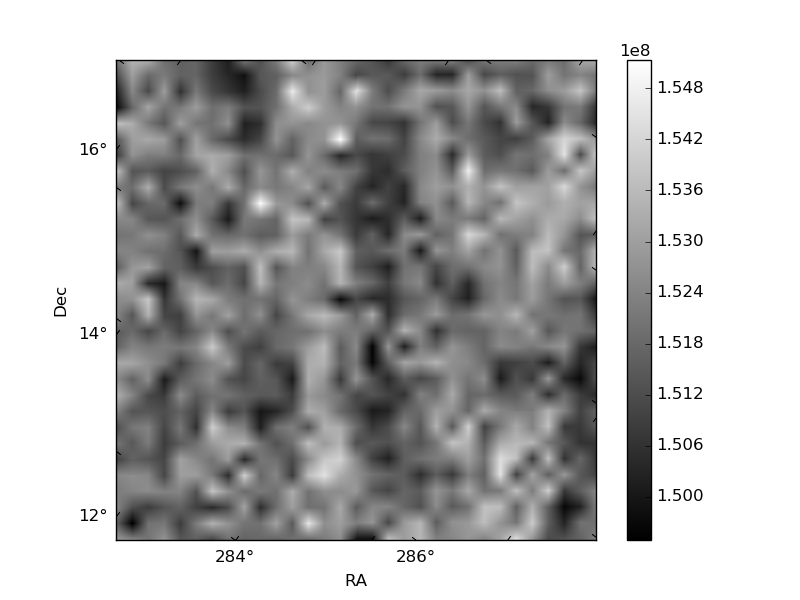
Histogram calculated using DETX and DETY for each event in the final _common_clean file
| Quadrant A | 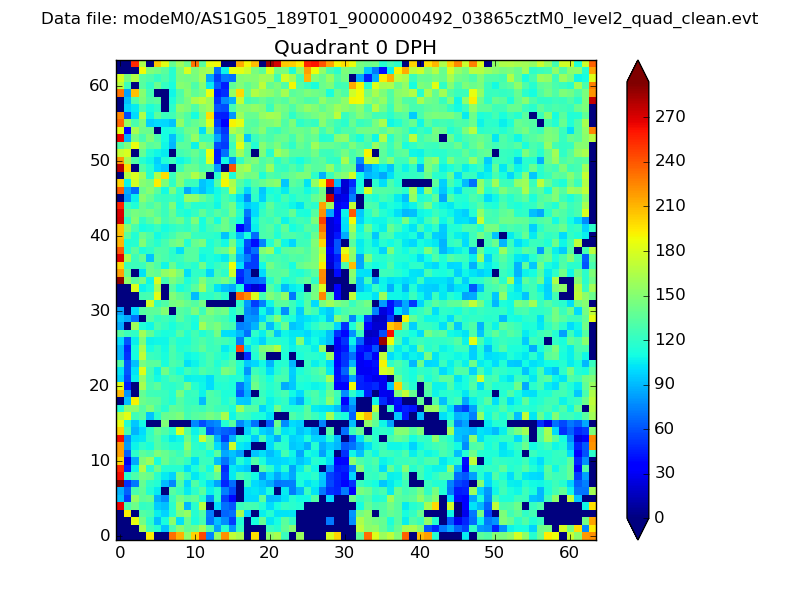 |
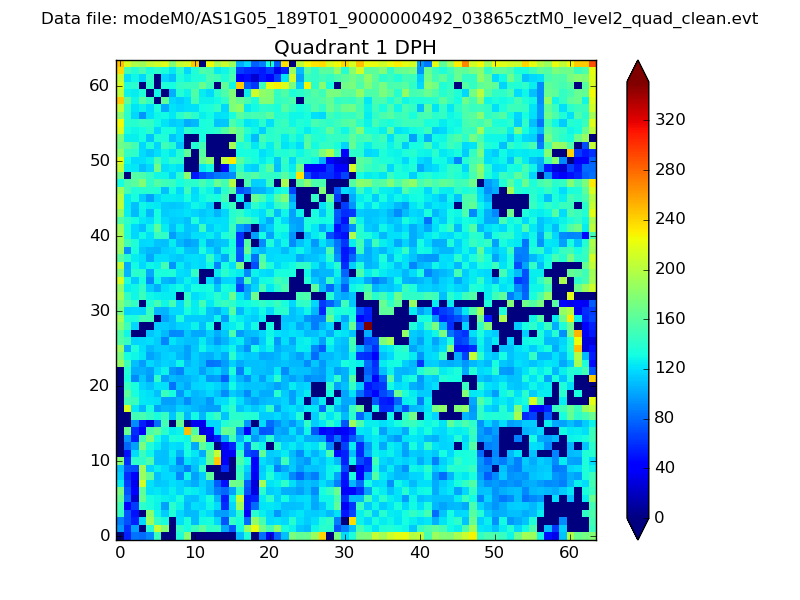 |
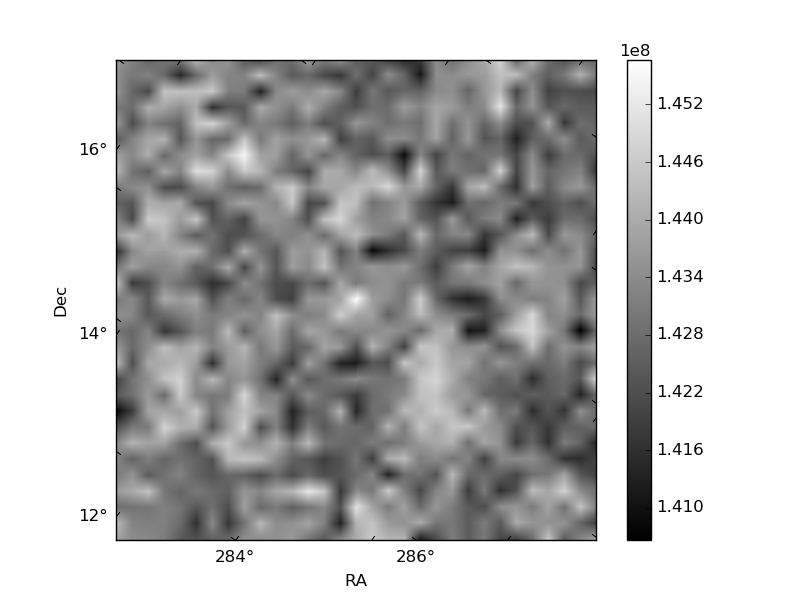
Quadrant B |
|---|---|---|---|
| Quadrant D | 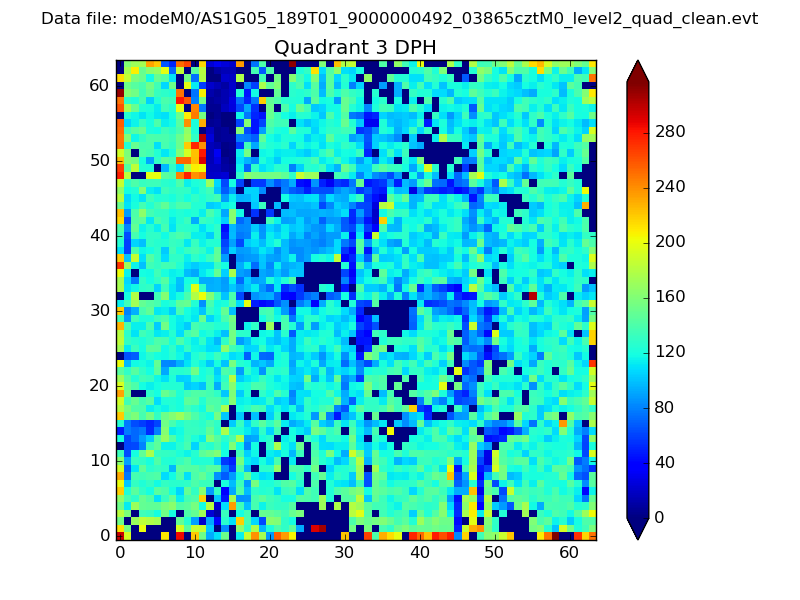 |
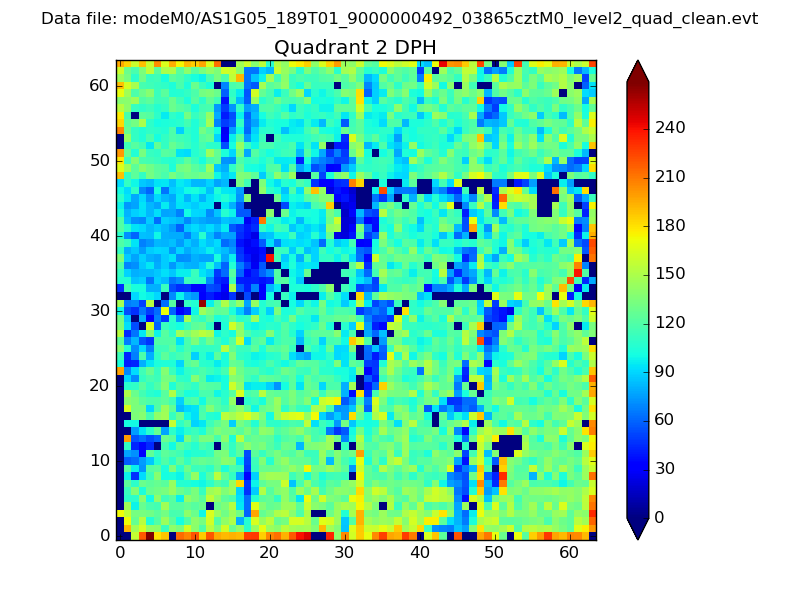 |
Quadrant C |
| Plot type | Count rate plots | Images |
|---|---|---|
| Comparison with Poisson distribution Blue bars denote a histogram of data divided into 1 sec bins. Red curve is a Poisson curve with rate = median count rate of data. |
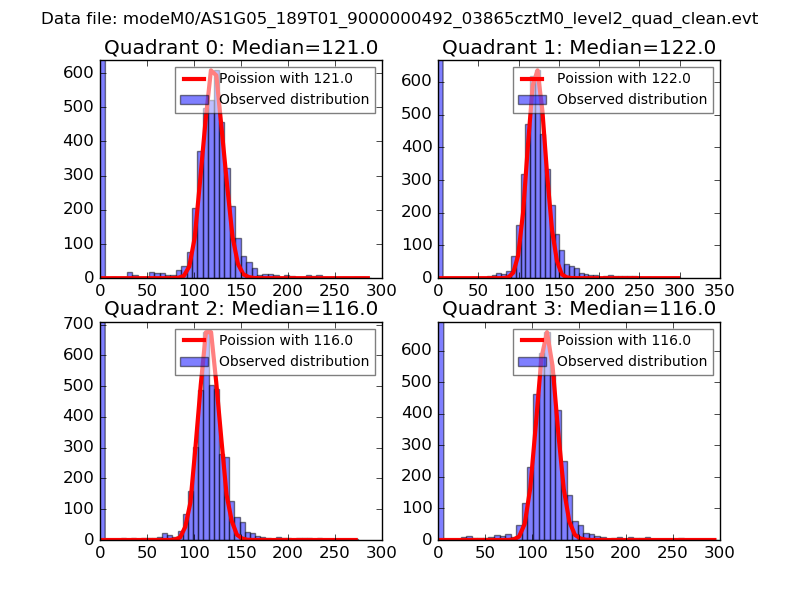 |
 |
| Quadrant-wise count rates Data is divided into 100 sec bins |
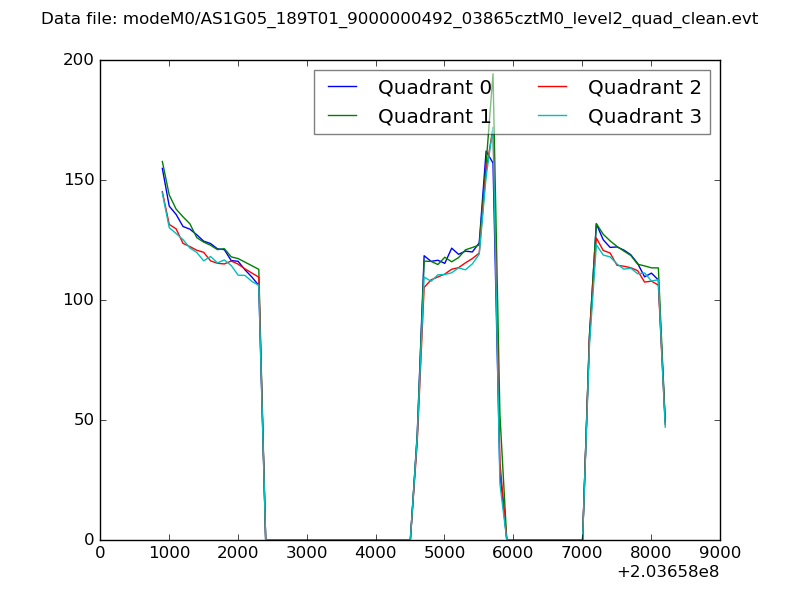 |
|
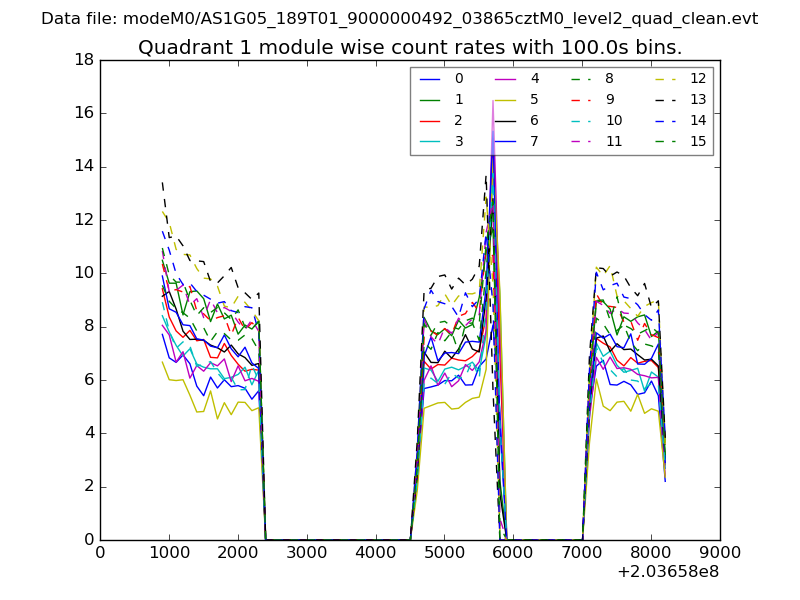
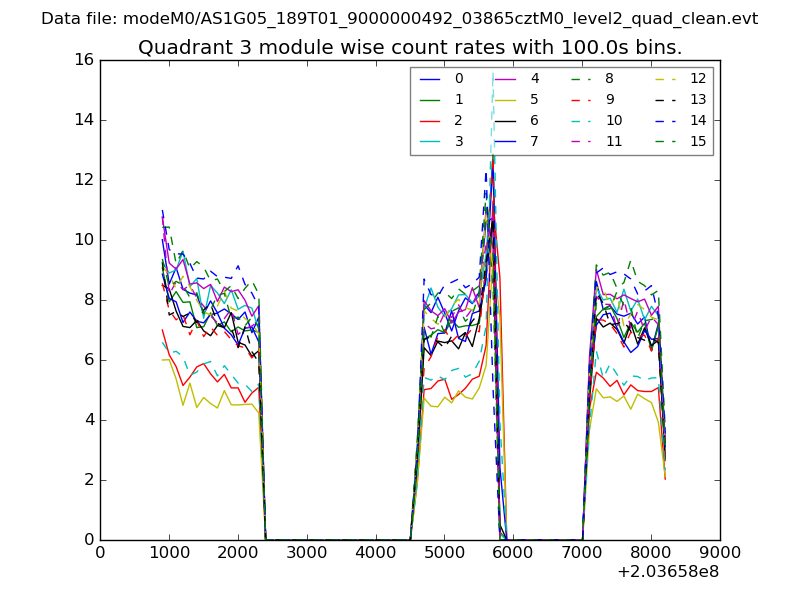
| Module-wise count rates for Quadrant A Data is divided into 100 sec bins |
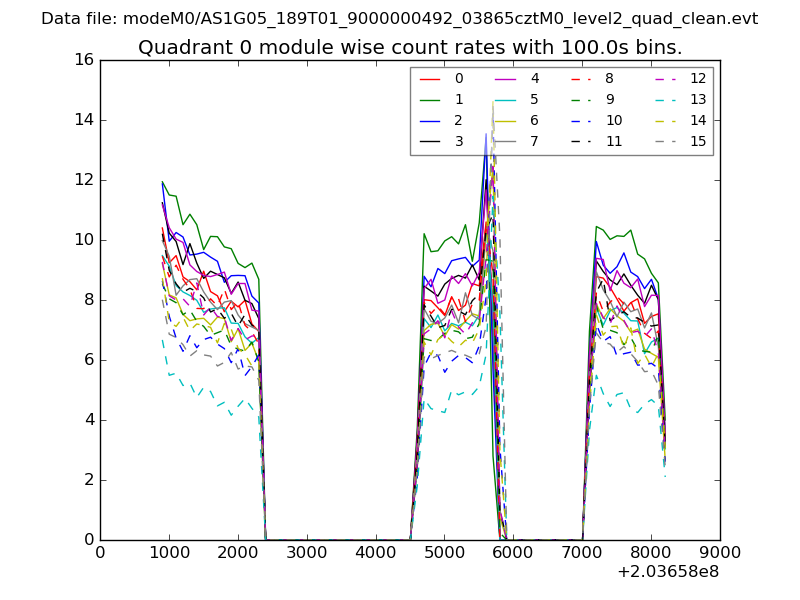 |
 |
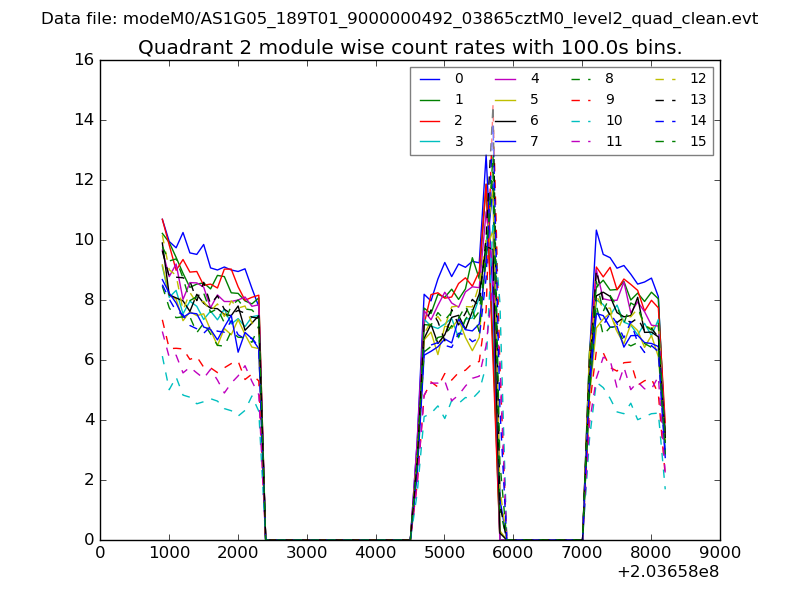
| Module-wise count rates for Quadrant B Data is divided into 100 sec bins |
 |
 |
| Module-wise count rates for Quadrant C Data is divided into 100 sec bins |
 |
 |
| Module-wise count rates for Quadrant D Data is divided into 100 sec bins |
 |
 |
| Parameter | Plot |
|---|---|
| CZT HV Monitor | 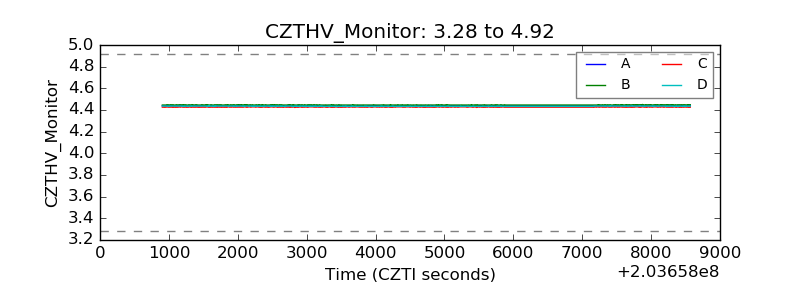 |
| D_VDD | 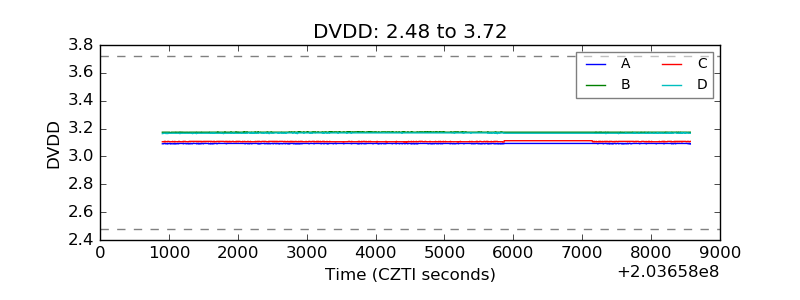 |
| Temperature 1 | 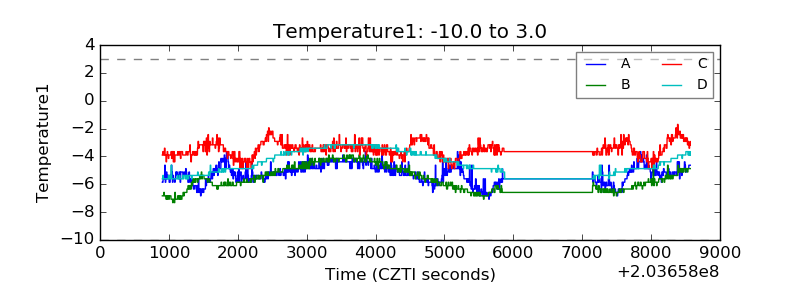 |
| Veto HV Monitor |  |
| Veto LLD | 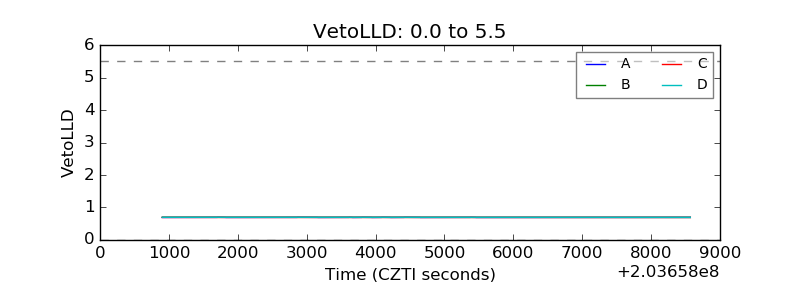 |
| Alpha Counter | 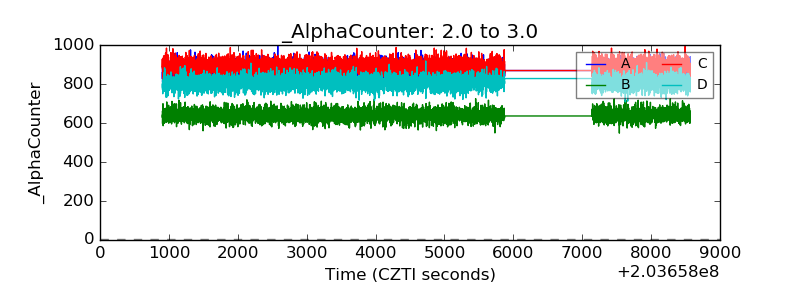 |
| _CPM_Rate | 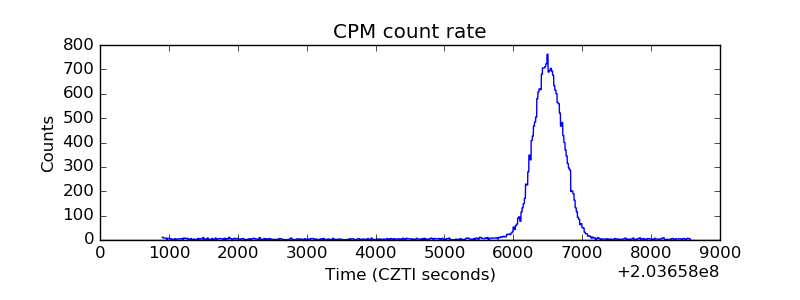 |
| CZT Counter | 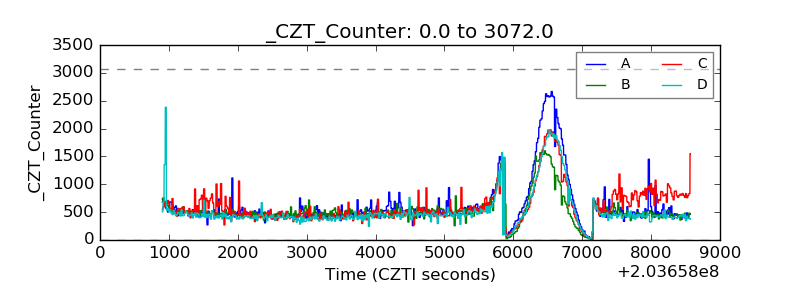 |
| +2.5 Volts monitor |  |
| +5 Volts monitor |  |
| Veto Counter | 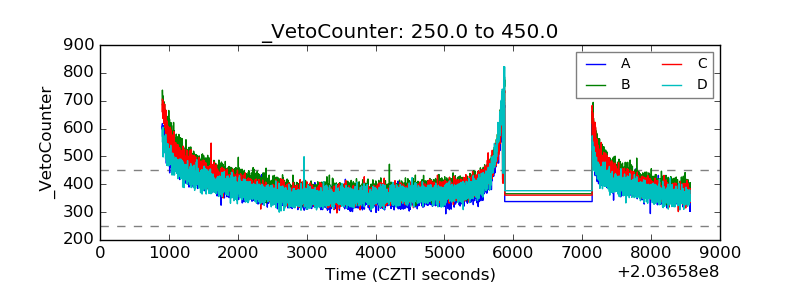 |