| Param | Original file | Final file |
|---|---|---|
| Filename | modeM0/AS1G05_083T01_9000000494cztM0_level2.fits | modeM0/AS1G05_083T01_9000000494cztM0_level2_quad_clean.evt |
| Size (bytes) | 751,907,520 | 944,112,960 |
| Size | 717.1 MB | 900.4 MB |
| Events in quadrant A | 4,465,116 | 5,951,000 |
| Events in quadrant B | 4,363,348 | 6,111,984 |
| Events in quadrant C | 4,213,752 | 5,224,568 |
| Events in quadrant D | 3,768,086 | 5,353,555 |
| Mode M0 | |||
|---|---|---|---|
| Quadrant | BADHDUFLAG | Total packets | Discarded packets |
| A | 0 | 206357 | 0 |
| B | 0 | 191301 | 0 |
| C | 0 | 261822 | 0 |
| D | 0 | 205156 | 0 |
| Mode M9 | |||
|---|---|---|---|
| Quadrant | BADHDUFLAG | Total packets | Discarded packets |
| A | 0 | 127 | 0 |
| B | 0 | 127 | 0 |
| C | 0 | 127 | 0 |
| D | 0 | 127 | 0 |
| Mode SS | |||
|---|---|---|---|
| Quadrant | BADHDUFLAG | Total packets | Discarded packets |
| A | 0 | 1758 | 0 |
| B | 0 | 1764 | 0 |
| C | 0 | 1756 | 0 |
| D | 0 | 1762 | 0 |
| Quadrant | Total seconds | Saturated seconds | Saturation percentage |
|---|---|---|---|
| A | 86844 | 3883 | 4.471236% |
| B | 86884 | 1418 | 1.632061% |
| C | 86871 | 9614 | 11.066984% |
| D | 86865 | 2422 | 2.788235% |
Noise dominated data is calculated using 1-second bins in cleaned event files. If a bin has >2000 counts, and if more than 50% of those come from <1% of pixels, then it is considered to be noise-dominated and hence unusable.
| Quadrant | # 1 sec bins | Bins with >0 counts | Bins with >2000 counts | High rate bins dominated by noise | Noise dominated (total time) | Noise dominated (detector-on time) | Marked lightcurve |
|---|---|---|---|---|---|---|---|
| A | 104393 | 86863 | 0 | 0 | 0.00% | 0.00% |  |
| B | 104393 | 86928 | 0 | 0 | 0.00% | 0.00% |  |
| C | 104393 | 86904 | 0 | 0 | 0.00% | 0.00% |  |
| D | 104393 | 86905 | 0 | 0 | 0.00% | 0.00% |  |
Top three noisy pixels from each quadrant. If the there are fewer than three noisy pixels in the level2.evt file, extra rows are filled as -1
| Pixel properties | Quadrant properties | ||||||
|---|---|---|---|---|---|---|---|
| Quadrant | DetID | PixID | Counts | Sigma | Mean | Median | Sigma |
| A | 14 | 188 | 4544 | 11.52 | 1159 | 1083 | 300.4 |
| A | 0 | 29 | 4330 | 10.81 | 1159 | 1083 | 300.4 |
| A | 14 | 204 | 3931 | 9.48 | 1159 | 1083 | 300.4 |
| B | 2 | 9 | 3901 | 12.1 | 1155 | 1100 | 231.5 |
| B | 12 | 226 | 3305 | 9.52 | 1155 | 1100 | 231.5 |
| B | 14 | 254 | 3103 | 8.65 | 1155 | 1100 | 231.5 |
| C | 1 | 81 | 3163 | 7.2 | 1111 | 1026 | 296.7 |
| C | 1 | 80 | 3102 | 7.0 | 1111 | 1026 | 296.7 |
| C | 12 | 241 | 2933 | 6.43 | 1111 | 1026 | 296.7 |
| D | 3 | 14 | 2871 | 6.49 | 1080 | 978 | 291.8 |
| D | 3 | 31 | 2751 | 6.08 | 1080 | 978 | 291.8 |
| D | 6 | 231 | 2746 | 6.06 | 1080 | 978 | 291.8 |
Histogram calculated using DETX and DETY for each event in the final _common_clean file
| Quadrant A | 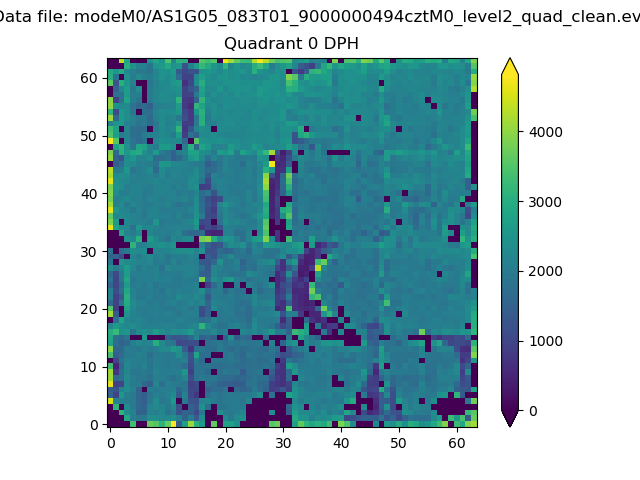 |
 |
Quadrant B |
|---|---|---|---|
| Quadrant D |  |
 |
Quadrant C |
| Plot type | Count rate plots | Images |
|---|---|---|
| Comparison with Poisson distribution Blue bars denote a histogram of data divided into 1 sec bins. Red curve is a Poisson curve with rate = median count rate of data. |
 |
 |
| Quadrant-wise count rates Data is divided into 100 sec bins |
 |
|
| Module-wise count rates for Quadrant A Data is divided into 100 sec bins |
 |
 |
| Module-wise count rates for Quadrant B Data is divided into 100 sec bins |
 |
 |
| Module-wise count rates for Quadrant C Data is divided into 100 sec bins |
 |
 |
| Module-wise count rates for Quadrant D Data is divided into 100 sec bins |
 |
 |
| Parameter | Plot |
|---|---|
| CZT HV Monitor |  |
| D_VDD |  |
| Temperature 1 |  |
| Veto HV Monitor |  |
| Veto LLD |  |
| Alpha Counter |  |
| _CPM_Rate |  |
| CZT Counter |  |
| +2.5 Volts monitor |  |
| +5 Volts monitor |  |
| _ROLL_ROT |  |
| _Roll_DEC |  |
| _Roll_RA |  |
| Veto Counter |  |