| Param | Original file | Final file |
|---|---|---|
| Filename | modeM0/AS1G05_083T01_9000000494_03866cztM0_level2.evt | modeM0/AS1G05_083T01_9000000494_03866cztM0_level2_quad_clean.evt |
| Size (bytes) | 121,080,960 | 21,116,160 |
| Size | 115.5 MB | 20.1 MB |
| Events in quadrant A | 890,163 | 128,877 |
| Events in quadrant B | 801,667 | 134,641 |
| Events in quadrant C | 1,058,590 | 132,861 |
| Events in quadrant D | 807,666 | 127,096 |
| Mode M0 | |||
|---|---|---|---|
| Quadrant | BADHDUFLAG | Total packets | Discarded packets |
| A | 0 | 3640 | 2 |
| B | 0 | 3428 | 1 |
| C | 0 | 4249 | 1 |
| D | 0 | 3598 | 1 |
| Mode M9 | |||
|---|---|---|---|
| Quadrant | BADHDUFLAG | Total packets | Discarded packets |
| A | 0 | 11 | 0 |
| B | 0 | 11 | 0 |
| C | 0 | 11 | 0 |
| D | 0 | 11 | 0 |
| Mode SS | |||
|---|---|---|---|
| Quadrant | BADHDUFLAG | Total packets | Discarded packets |
| A | 0 | 34 | 0 |
| B | 0 | 34 | 0 |
| C | 0 | 34 | 0 |
| D | 0 | 34 | 0 |
| Quadrant | Total seconds | Saturated seconds | Saturation percentage |
|---|---|---|---|
| A | 1559 | 113 | 7.248236% |
| B | 1559 | 105 | 6.735087% |
| C | 1559 | 134 | 8.595253% |
| D | 1559 | 89 | 5.708788% |
Noise dominated data is calculated using 1-second bins in cleaned event files. If a bin has >2000 counts, and if more than 50% of those come from <1% of pixels, then it is considered to be noise-dominated and hence unusable.
| Quadrant | # 1 sec bins | Bins with >0 counts | Bins with >2000 counts | High rate bins dominated by noise | Noise dominated (total time) | Noise dominated (detector-on time) | Marked lightcurve |
|---|---|---|---|---|---|---|---|
| A | 2674 | 1559 | 1 | 1 | 0.04% | 0.06% | 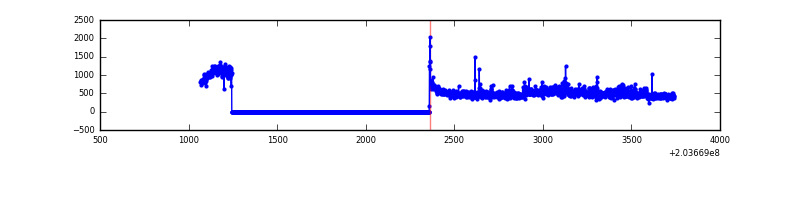 |
| B | 2674 | 1559 | 0 | 0 | 0.00% | 0.00% | 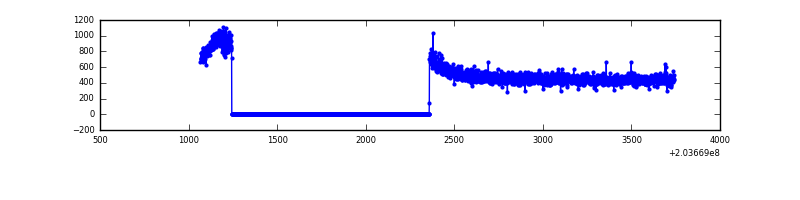 |
| C | 2674 | 1559 | 4 | 4 | 0.15% | 0.26% | 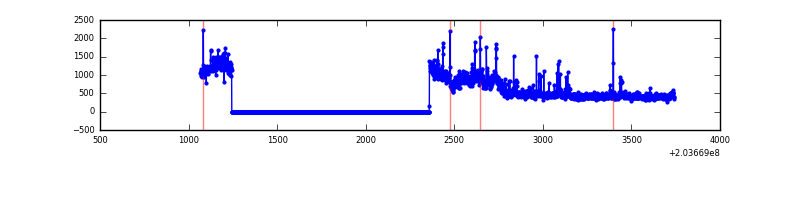 |
| D | 2674 | 1559 | 4 | 4 | 0.15% | 0.26% | 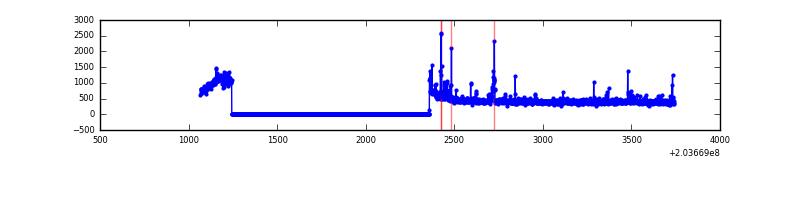 |
Top three noisy pixels from each quadrant. If the there are fewer than three noisy pixels in the level2.evt file, extra rows are filled as -1
| Pixel properties | Quadrant properties | ||||||
|---|---|---|---|---|---|---|---|
| Quadrant | DetID | PixID | Counts | Sigma | Mean | Median | Sigma |
| A | 8 | 15 | 84435 | 1871.87 | 205 | 200 | 45.0 |
| A | 15 | 234 | 8411 | 182.45 | 205 | 200 | 45.0 |
| A | 0 | 50 | 6828 | 147.28 | 205 | 200 | 45.0 |
| B | 15 | 204 | 14977 | 358.65 | 201 | 196 | 41.2 |
| B | 0 | 219 | 3632 | 83.37 | 201 | 196 | 41.2 |
| B | 12 | 111 | 3552 | 81.43 | 201 | 196 | 41.2 |
| C | 2 | 53 | 291924 | 6460.81 | 189 | 189 | 45.2 |
| C | 14 | 67 | 20099 | 440.93 | 189 | 189 | 45.2 |
| C | 7 | 202 | 6281 | 134.91 | 189 | 189 | 45.2 |
| D | 13 | 248 | 35556 | 641.75 | 196 | 192 | 55.1 |
| D | 2 | 33 | 10631 | 189.44 | 196 | 192 | 55.1 |
| D | 14 | 34 | 4661 | 81.1 | 196 | 192 | 55.1 |
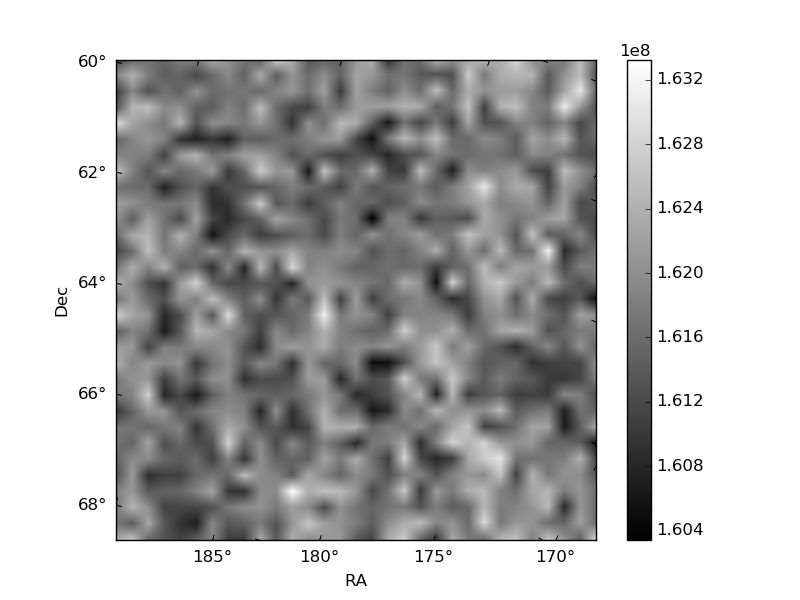
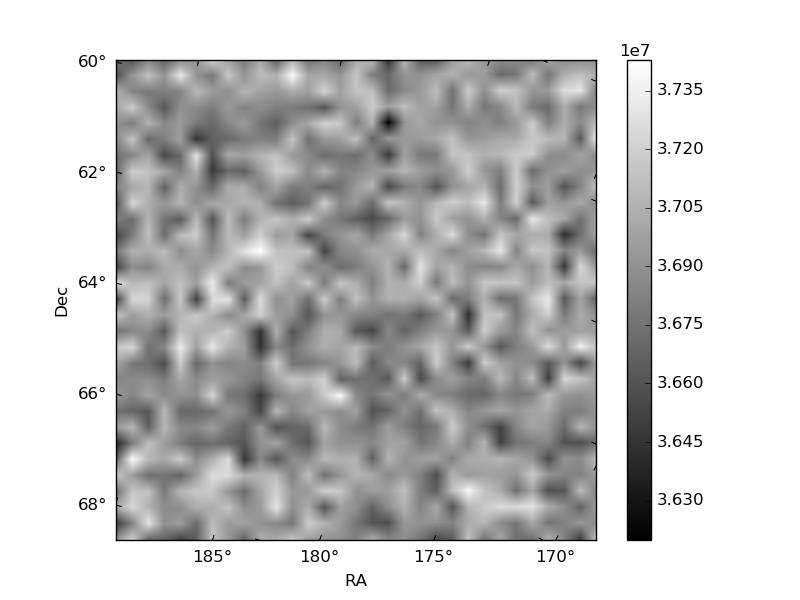
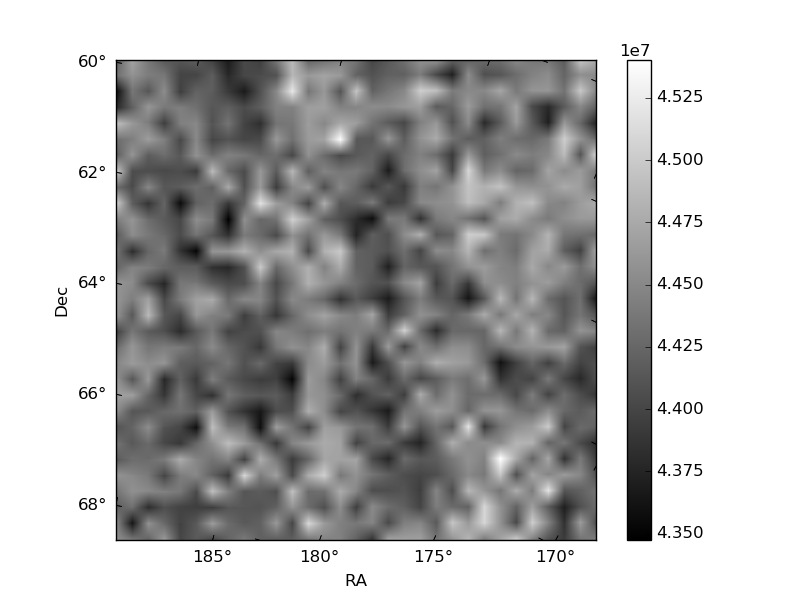
Histogram calculated using DETX and DETY for each event in the final _common_clean file
| Quadrant A | 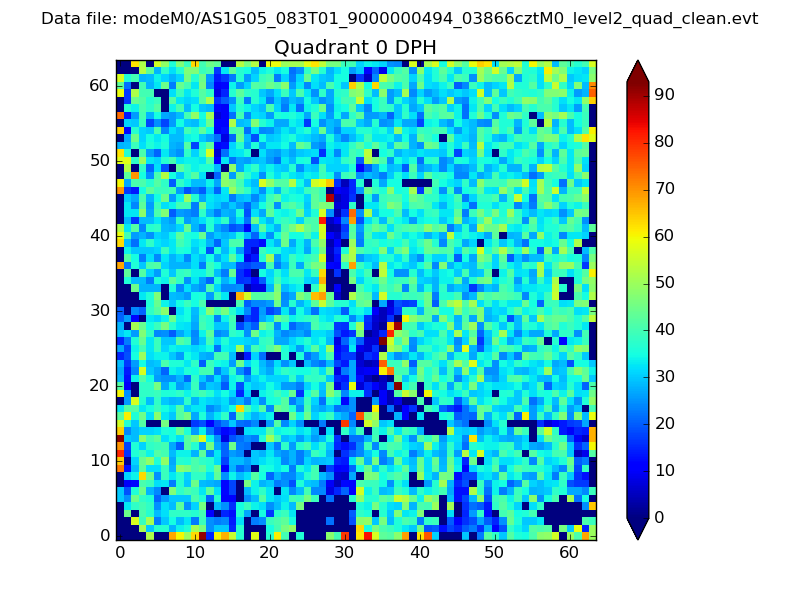 |
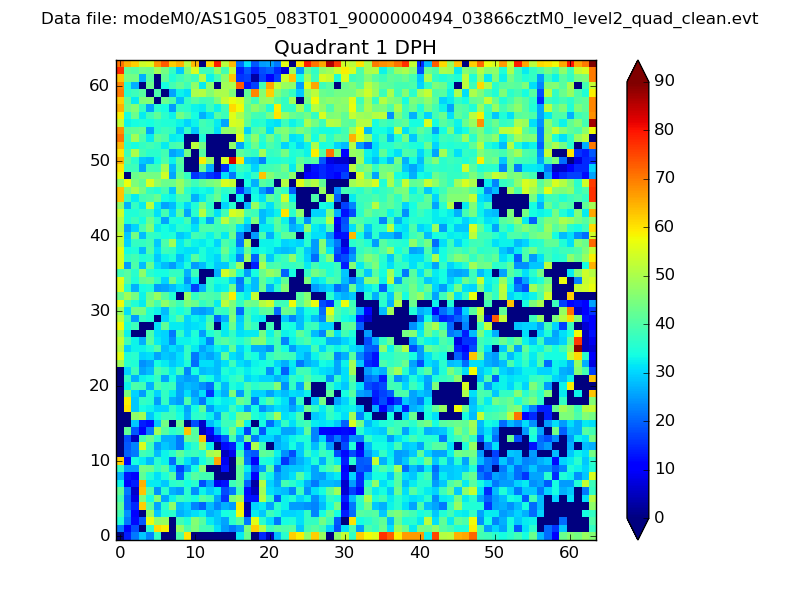 |
Quadrant B |
|---|---|---|---|
| Quadrant D | 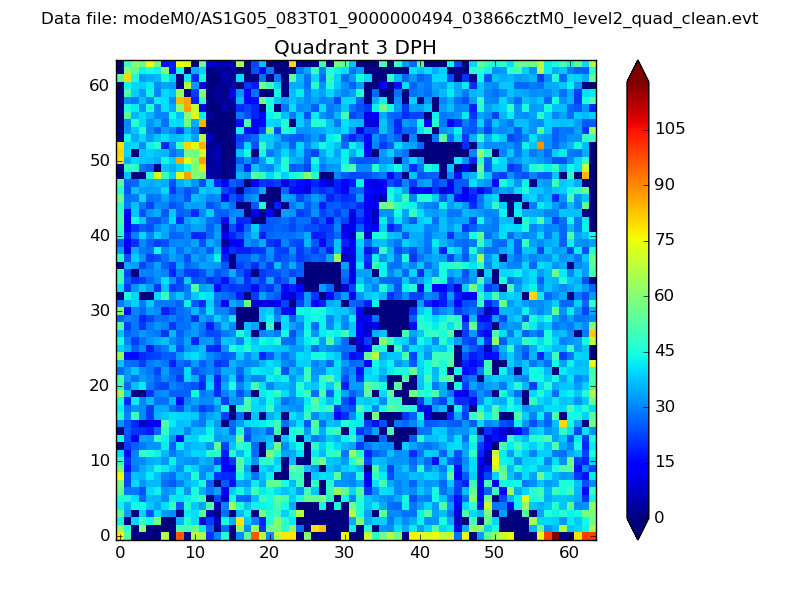 |
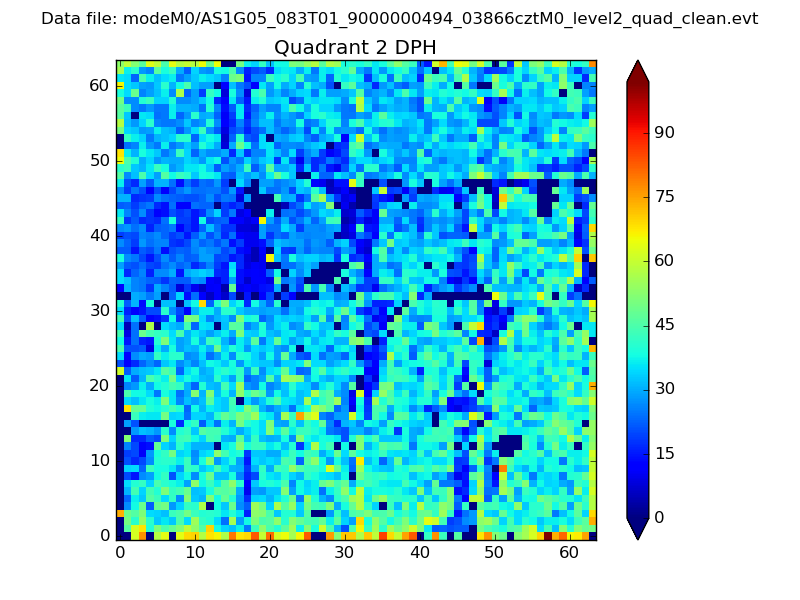 |
Quadrant C |
| Plot type | Count rate plots | Images |
|---|---|---|
| Comparison with Poisson distribution Blue bars denote a histogram of data divided into 1 sec bins. Red curve is a Poisson curve with rate = median count rate of data. |
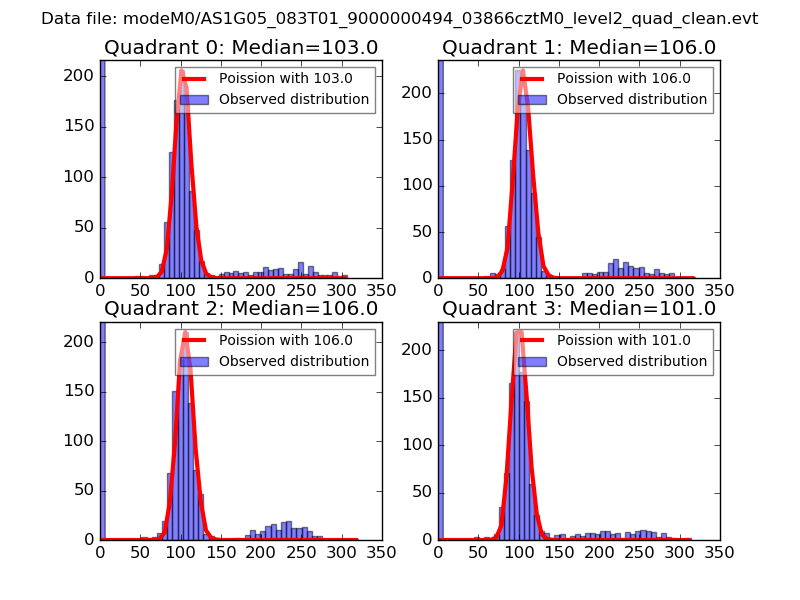 |
 |
| Quadrant-wise count rates Data is divided into 100 sec bins |
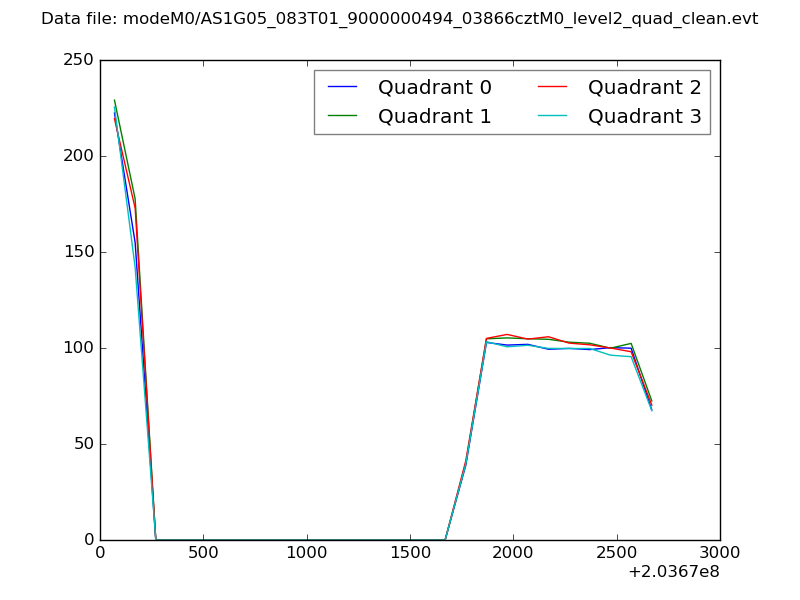 |
|
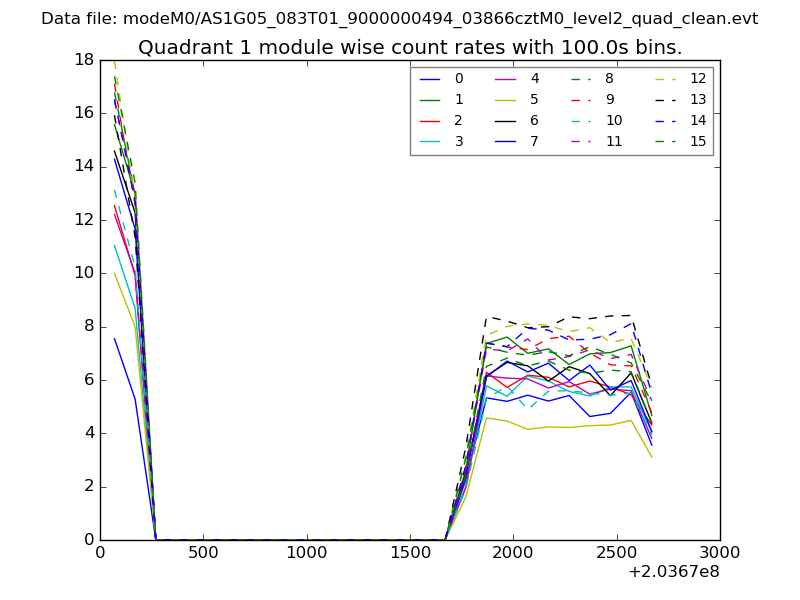
| Module-wise count rates for Quadrant A Data is divided into 100 sec bins |
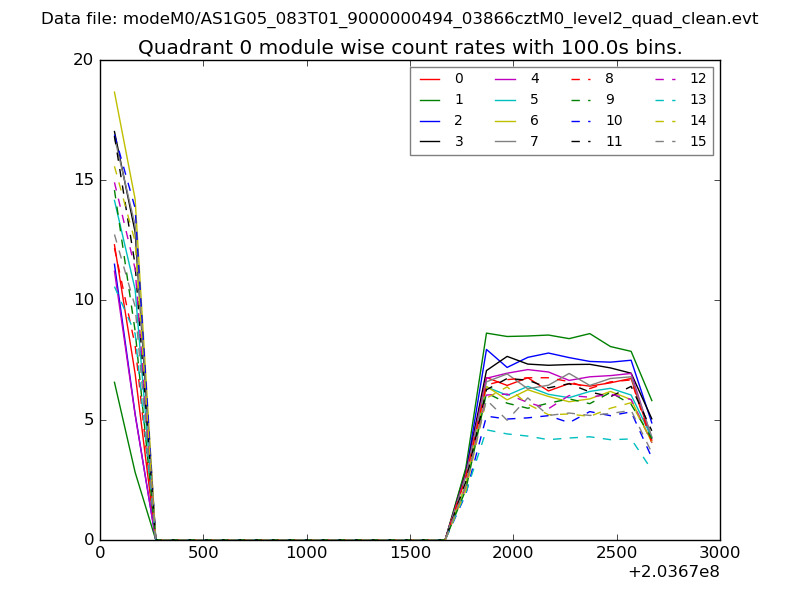 |
 |
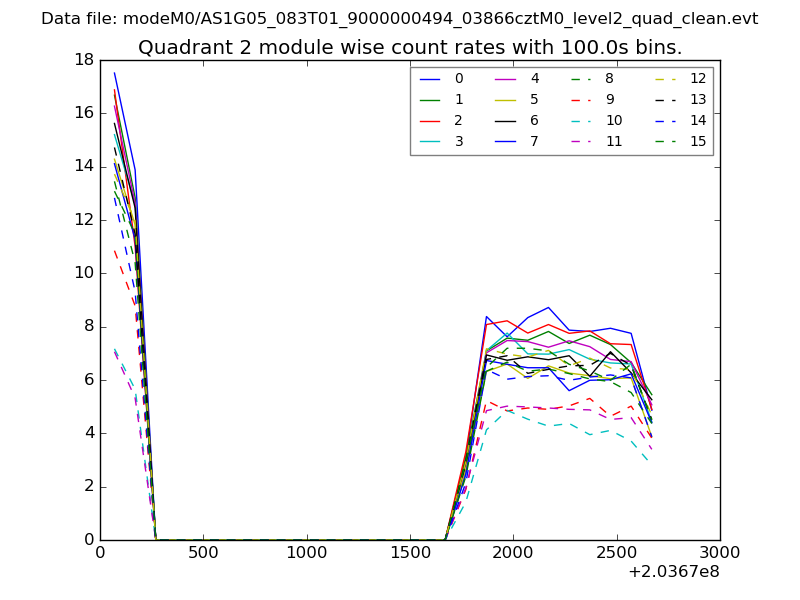
| Module-wise count rates for Quadrant B Data is divided into 100 sec bins |
 |
 |
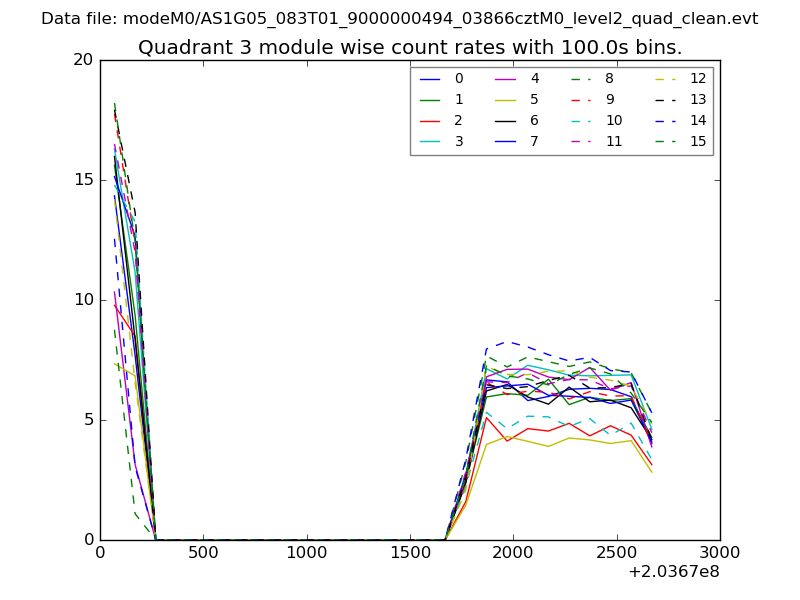
| Module-wise count rates for Quadrant C Data is divided into 100 sec bins |
 |
 |
| Module-wise count rates for Quadrant D Data is divided into 100 sec bins |
 |
 |
| Parameter | Plot |
|---|---|
| CZT HV Monitor | 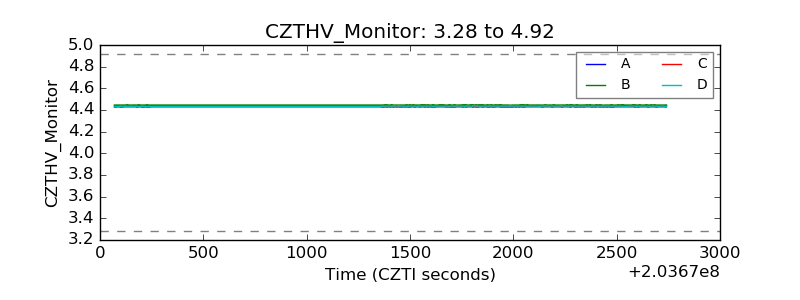 |
| D_VDD |  |
| Temperature 1 |  |
| Veto HV Monitor | 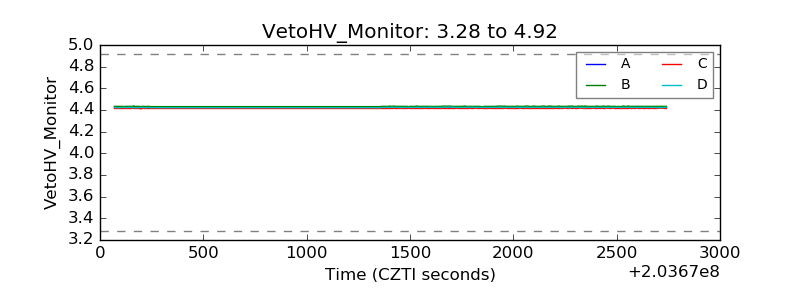 |
| Veto LLD | 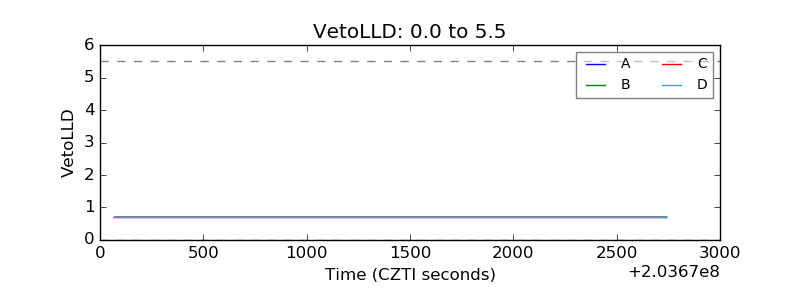 |
| Alpha Counter | 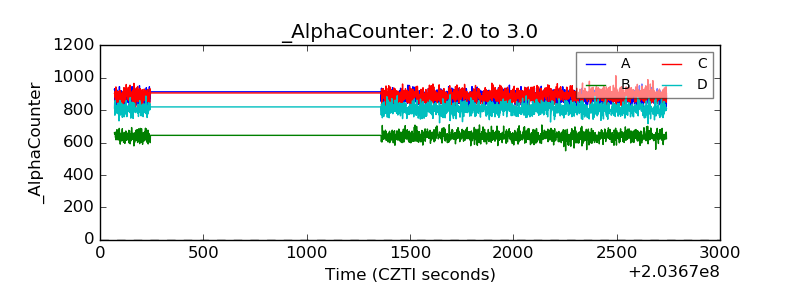 |
| _CPM_Rate | 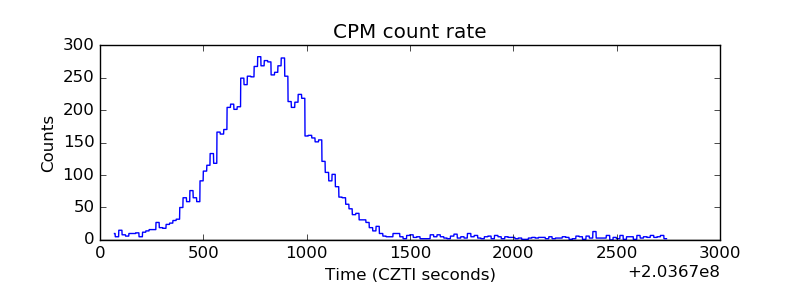 |
| CZT Counter | 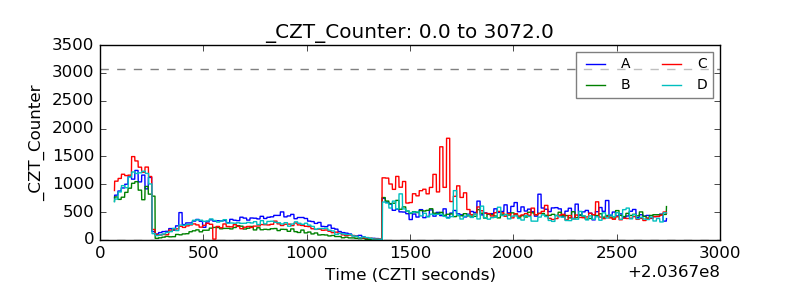 |
| +2.5 Volts monitor |  |
| +5 Volts monitor | 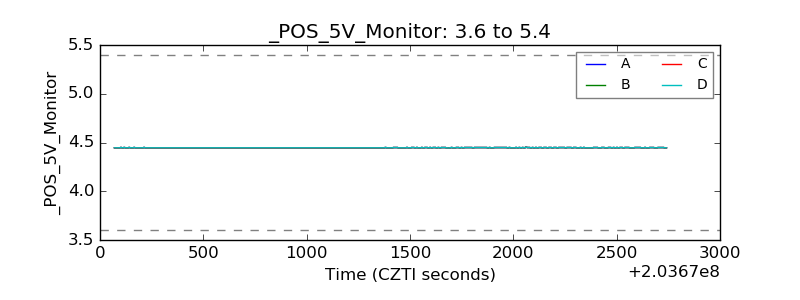 |
| Veto Counter | 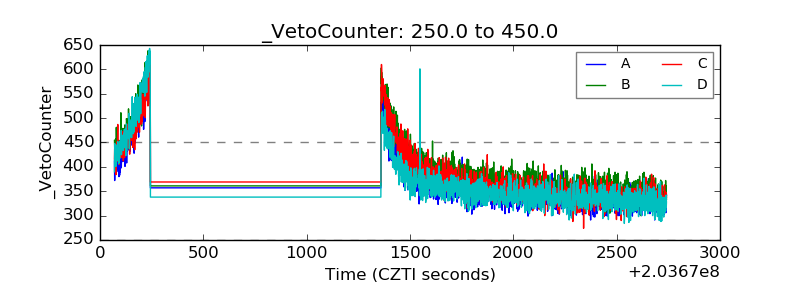 |