| Param | Original file | Final file |
|---|---|---|
| Filename | modeM0/AS1G05_083T01_9000000494_03867cztM0_level2.evt | modeM0/AS1G05_083T01_9000000494_03867cztM0_level2_quad_clean.evt |
| Size (bytes) | 497,597,760 | 97,896,960 |
| Size | 474.5 MB | 93.4 MB |
| Events in quadrant A | 3,496,768 | 630,991 |
| Events in quadrant B | 3,449,902 | 627,079 |
| Events in quadrant C | 4,142,218 | 617,024 |
| Events in quadrant D | 3,510,614 | 607,295 |
| Mode M0 | |||
|---|---|---|---|
| Quadrant | BADHDUFLAG | Total packets | Discarded packets |
| A | 0 | 15230 | 3 |
| B | 0 | 14837 | 2 |
| C | 0 | 17335 | 2 |
| D | 0 | 15648 | 2 |
| Mode M9 | |||
|---|---|---|---|
| Quadrant | BADHDUFLAG | Total packets | Discarded packets |
| A | 0 | 15 | 0 |
| B | 0 | 15 | 0 |
| C | 0 | 15 | 0 |
| D | 0 | 16 | 0 |
| Mode SS | |||
|---|---|---|---|
| Quadrant | BADHDUFLAG | Total packets | Discarded packets |
| A | 0 | 142 | 0 |
| B | 0 | 142 | 0 |
| C | 0 | 142 | 0 |
| D | 0 | 142 | 0 |
| Quadrant | Total seconds | Saturated seconds | Saturation percentage |
|---|---|---|---|
| A | 6917 | 185 | 2.674570% |
| B | 6917 | 132 | 1.908342% |
| C | 6917 | 192 | 2.775770% |
| D | 6917 | 179 | 2.587827% |
Noise dominated data is calculated using 1-second bins in cleaned event files. If a bin has >2000 counts, and if more than 50% of those come from <1% of pixels, then it is considered to be noise-dominated and hence unusable.
| Quadrant | # 1 sec bins | Bins with >0 counts | Bins with >2000 counts | High rate bins dominated by noise | Noise dominated (total time) | Noise dominated (detector-on time) | Marked lightcurve |
|---|---|---|---|---|---|---|---|
| A | 7657 | 6917 | 39 | 39 | 0.51% | 0.56% | 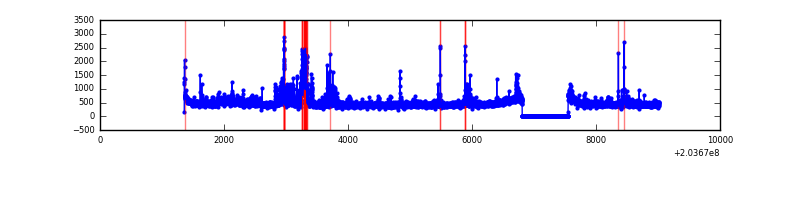 |
| B | 7657 | 6917 | 6 | 6 | 0.08% | 0.09% | 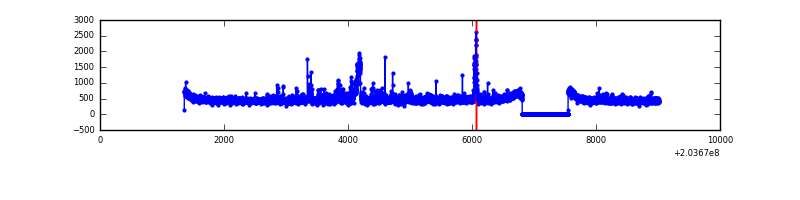 |
| C | 7657 | 6917 | 16 | 16 | 0.21% | 0.23% | 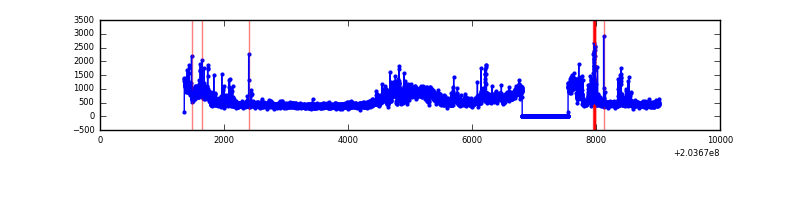 |
| D | 7657 | 6917 | 91 | 91 | 1.19% | 1.32% | 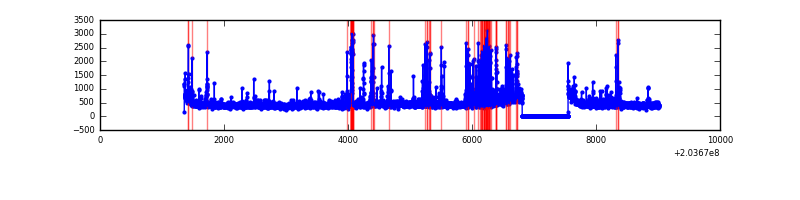 |
Top three noisy pixels from each quadrant. If the there are fewer than three noisy pixels in the level2.evt file, extra rows are filled as -1
| Pixel properties | Quadrant properties | ||||||
|---|---|---|---|---|---|---|---|
| Quadrant | DetID | PixID | Counts | Sigma | Mean | Median | Sigma |
| A | 15 | 234 | 233499 | 1462.36 | 779 | 761 | 159.2 |
| A | 8 | 15 | 122507 | 764.96 | 779 | 761 | 159.2 |
| A | 0 | 118 | 76933 | 478.61 | 779 | 761 | 159.2 |
| B | 15 | 204 | 224640 | 1509.44 | 783 | 764 | 148.3 |
| B | 0 | 187 | 72575 | 484.17 | 783 | 764 | 148.3 |
| B | 15 | 85 | 59765 | 397.8 | 783 | 764 | 148.3 |
| C | 2 | 53 | 1169080 | 6760.88 | 747 | 751 | 172.8 |
| C | 14 | 67 | 27263 | 153.42 | 747 | 751 | 172.8 |
| C | 8 | 128 | 7708 | 40.26 | 747 | 751 | 172.8 |
| D | 2 | 32 | 232587 | 1275.56 | 751 | 729 | 181.8 |
| D | 2 | 33 | 118384 | 647.27 | 751 | 729 | 181.8 |
| D | 13 | 248 | 111474 | 609.26 | 751 | 729 | 181.8 |
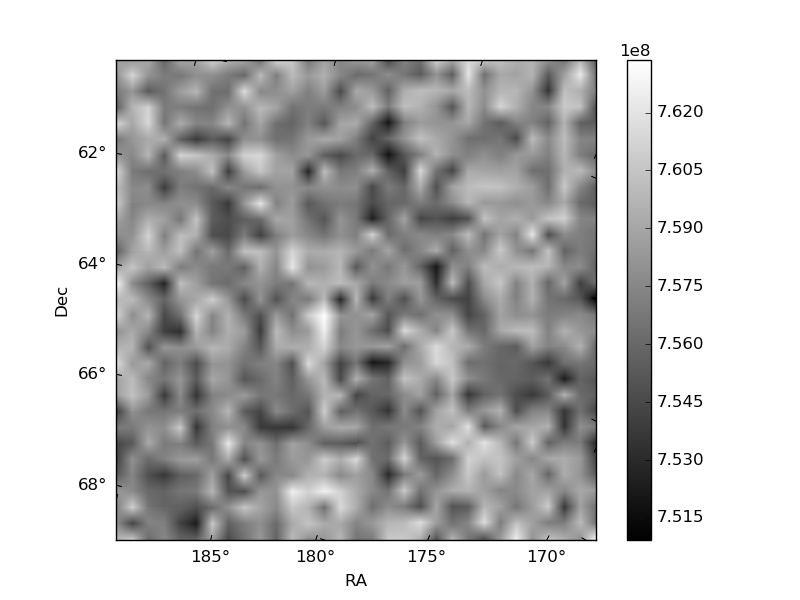
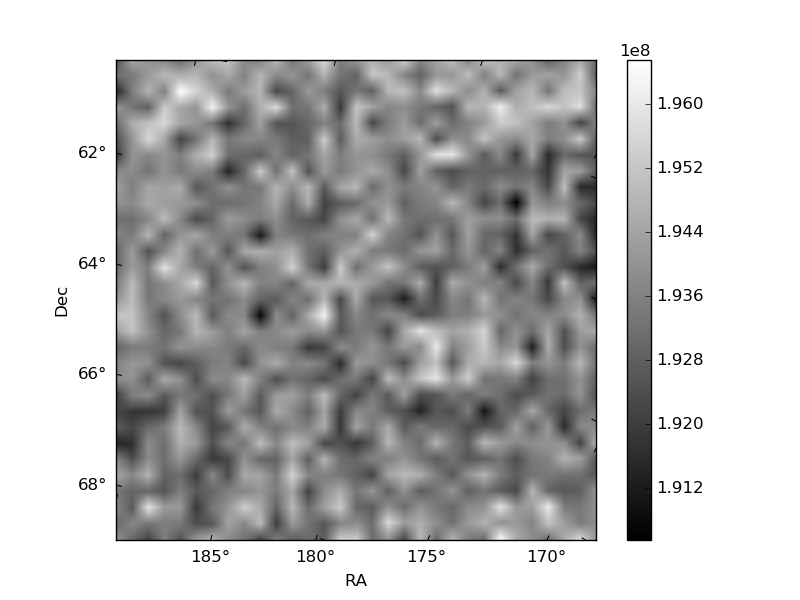
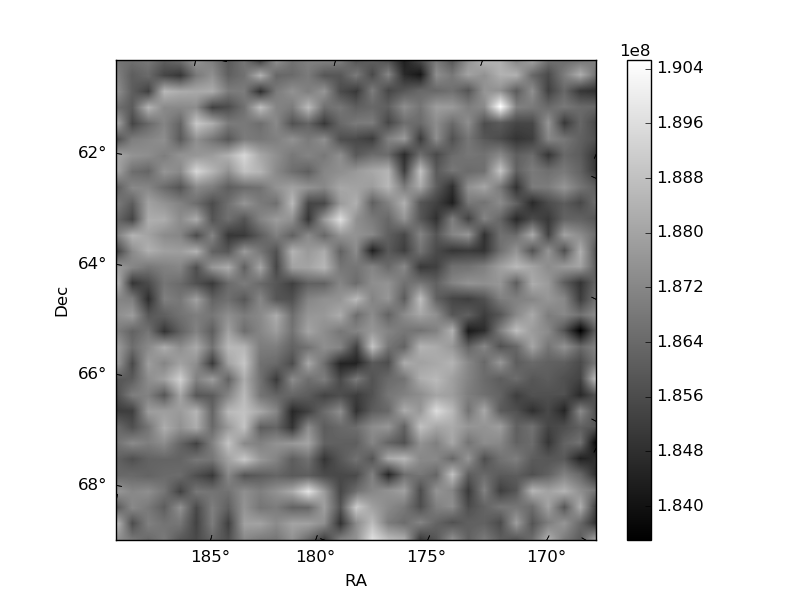
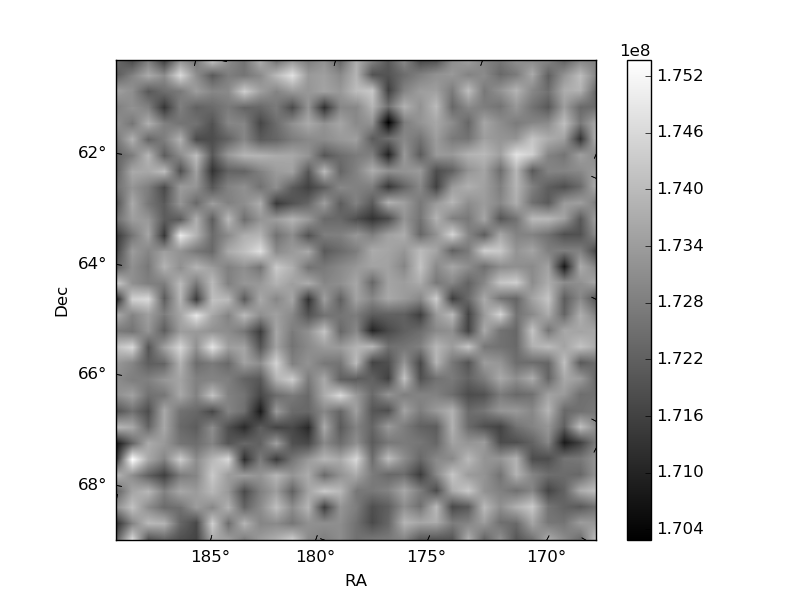
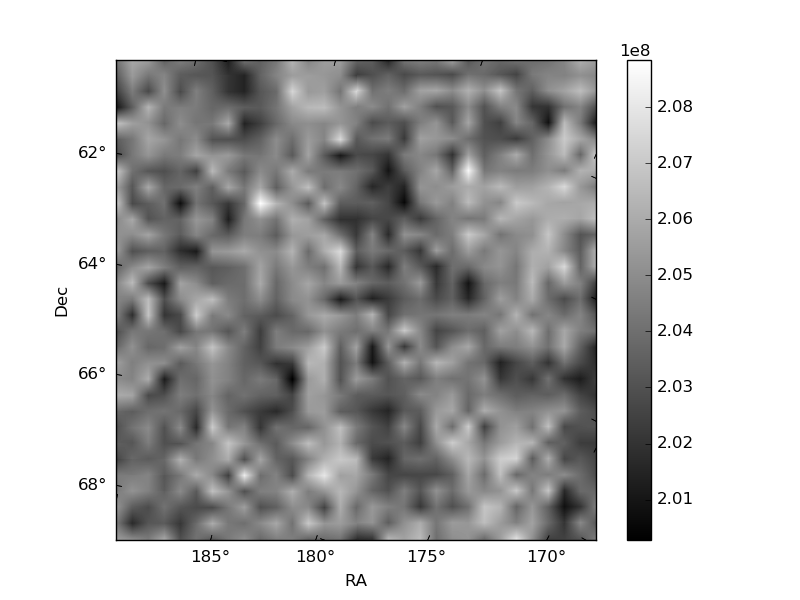
Histogram calculated using DETX and DETY for each event in the final _common_clean file
| Quadrant A | 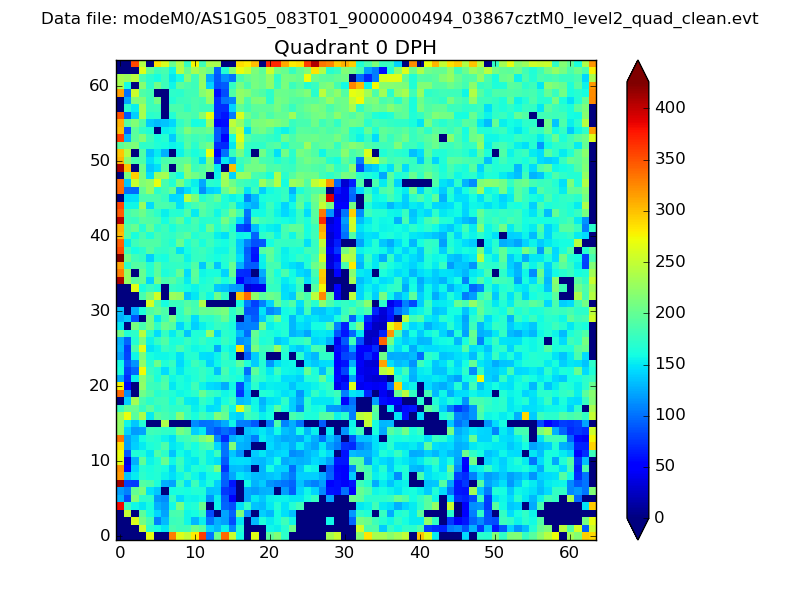 |
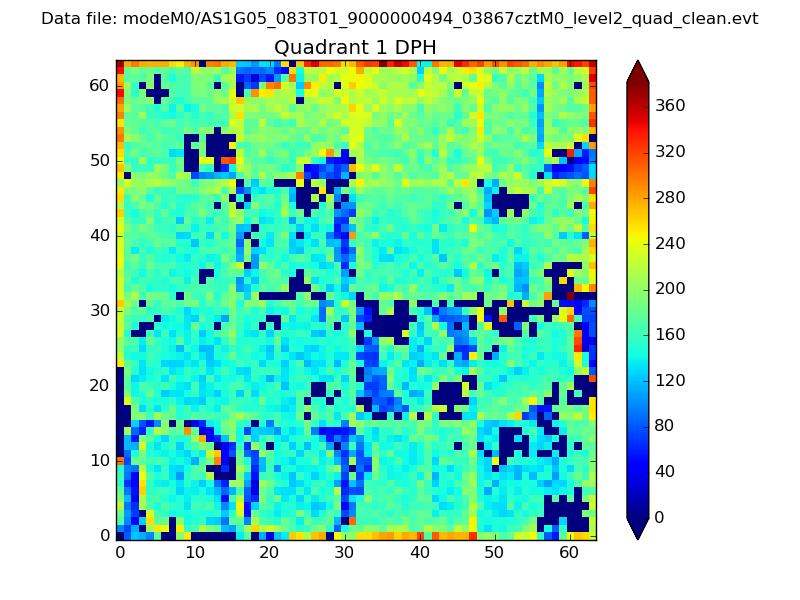 |
Quadrant B |
|---|---|---|---|
| Quadrant D | 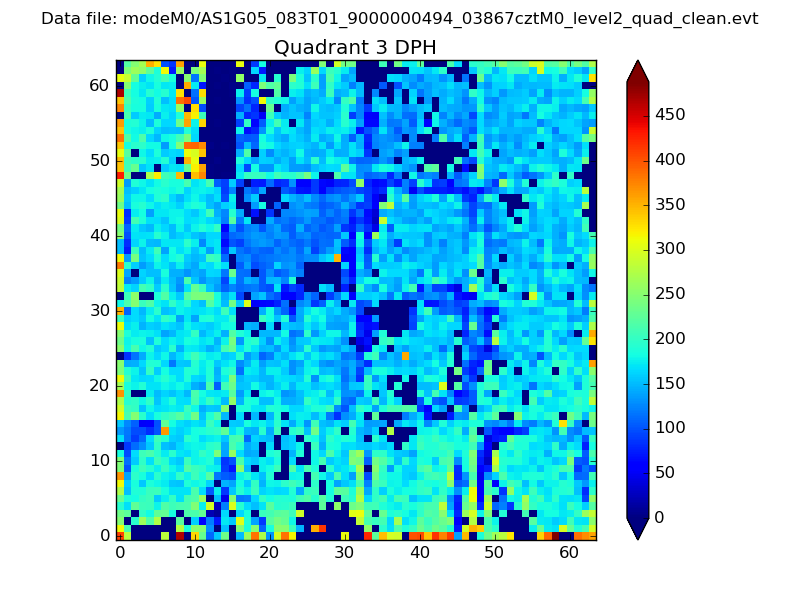 |
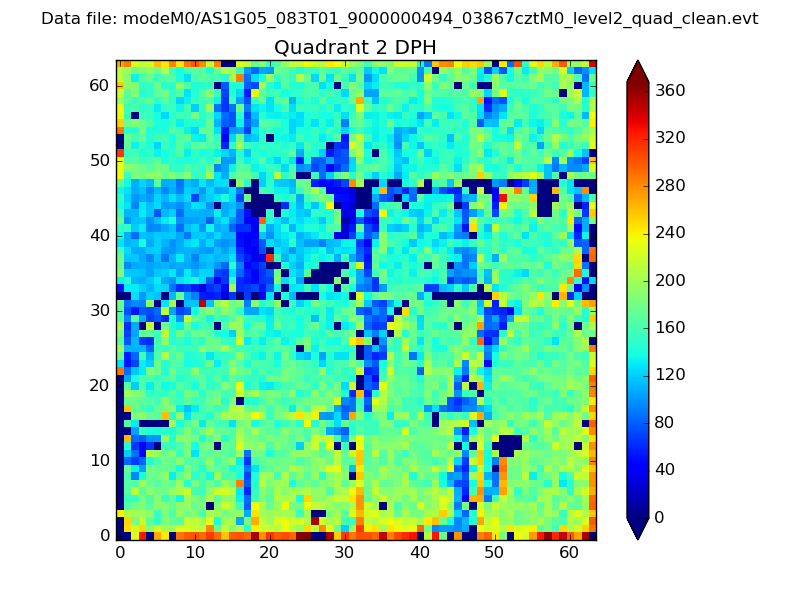 |
Quadrant C |
| Plot type | Count rate plots | Images |
|---|---|---|
| Comparison with Poisson distribution Blue bars denote a histogram of data divided into 1 sec bins. Red curve is a Poisson curve with rate = median count rate of data. |
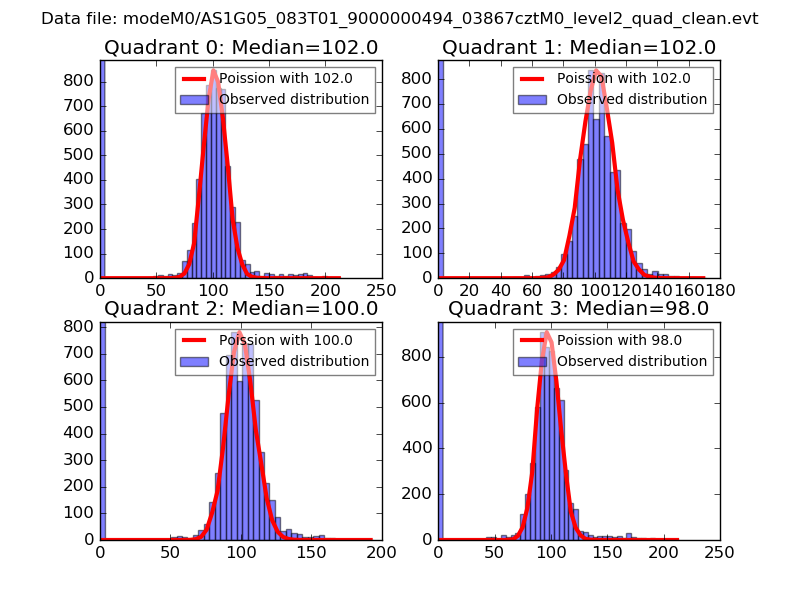 |
 |
| Quadrant-wise count rates Data is divided into 100 sec bins |
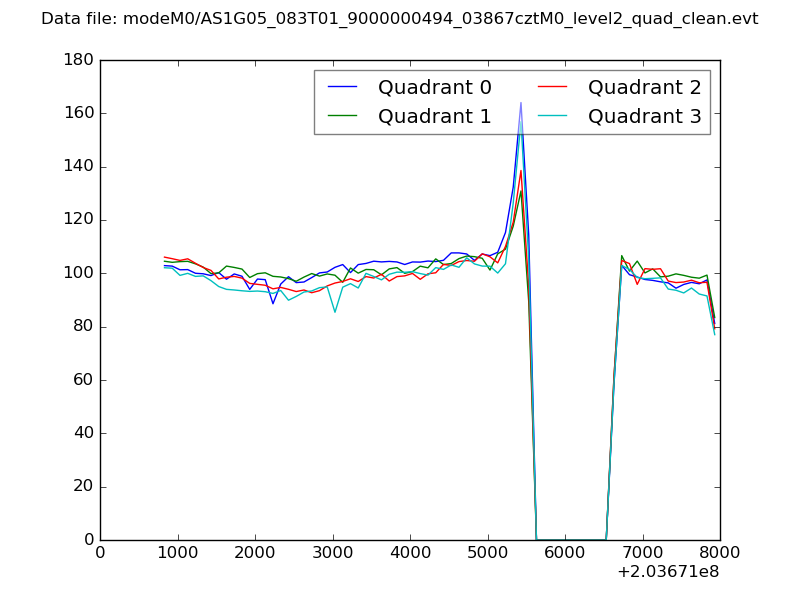 |
|
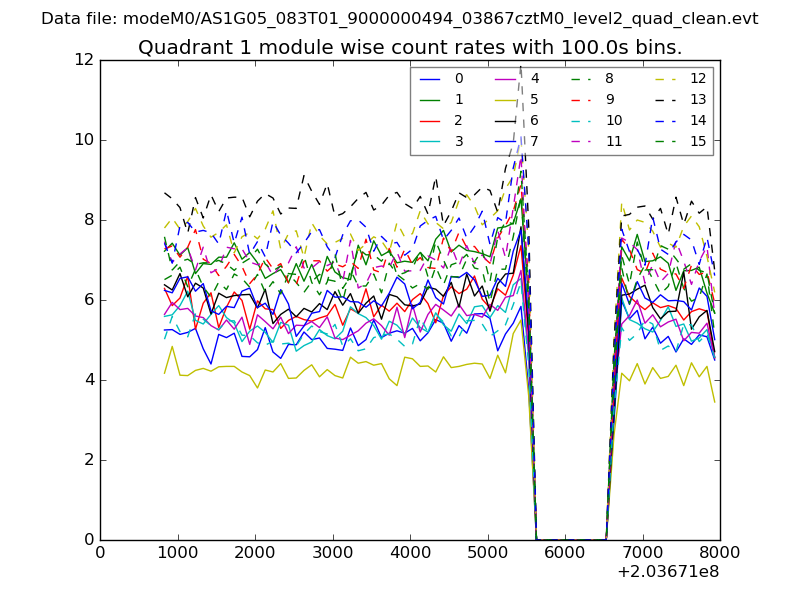
| Module-wise count rates for Quadrant A Data is divided into 100 sec bins |
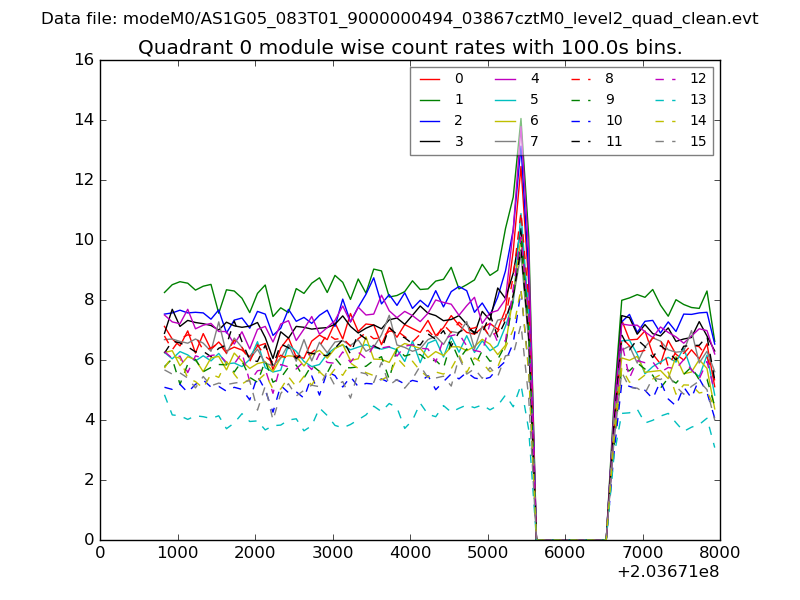 |
 |
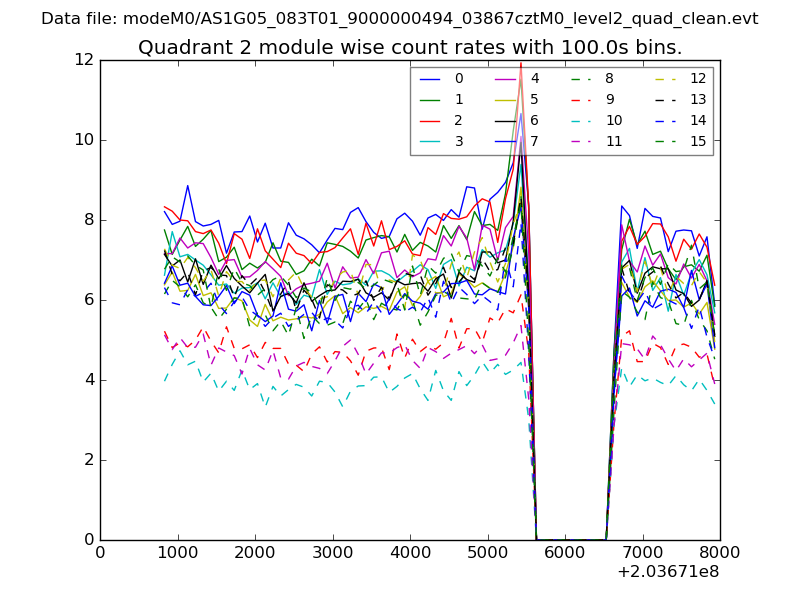
| Module-wise count rates for Quadrant B Data is divided into 100 sec bins |
 |
 |
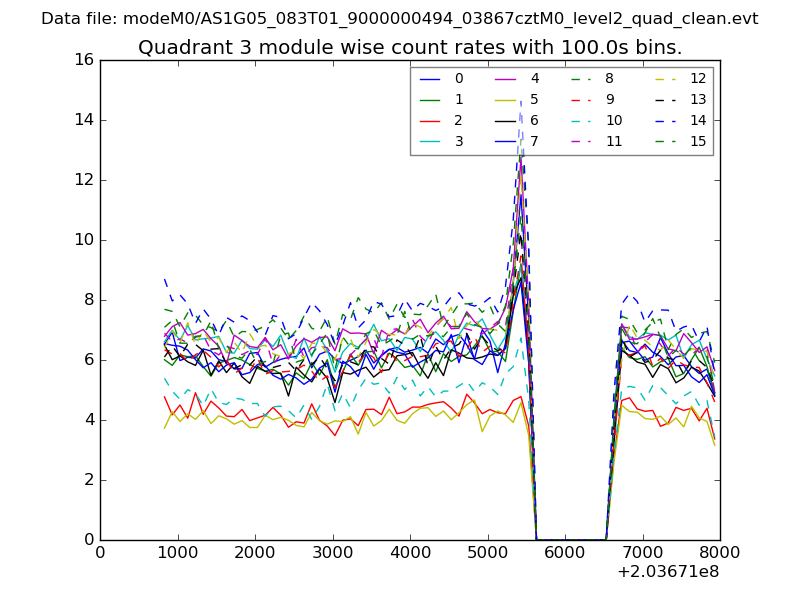
| Module-wise count rates for Quadrant C Data is divided into 100 sec bins |
 |
 |
| Module-wise count rates for Quadrant D Data is divided into 100 sec bins |
 |
 |
| Parameter | Plot |
|---|---|
| CZT HV Monitor | 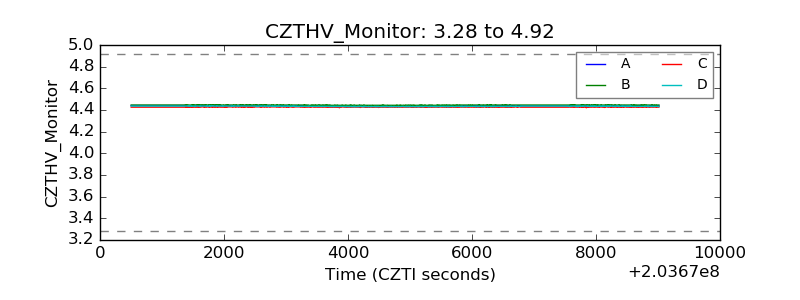 |
| D_VDD | 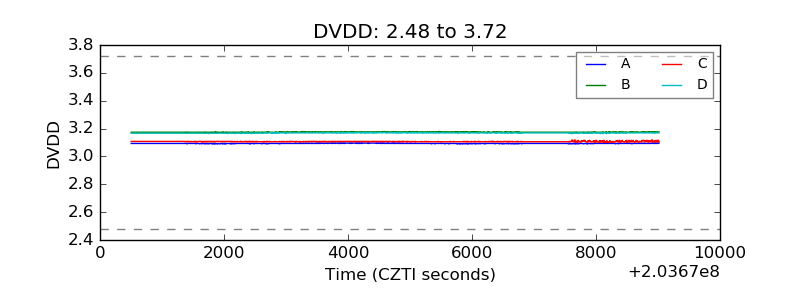 |
| Temperature 1 | 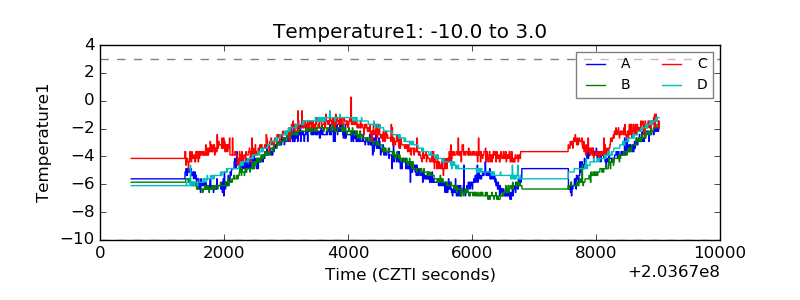 |
| Veto HV Monitor | 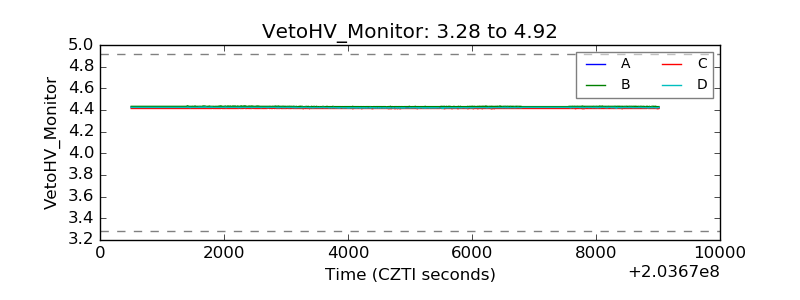 |
| Veto LLD | 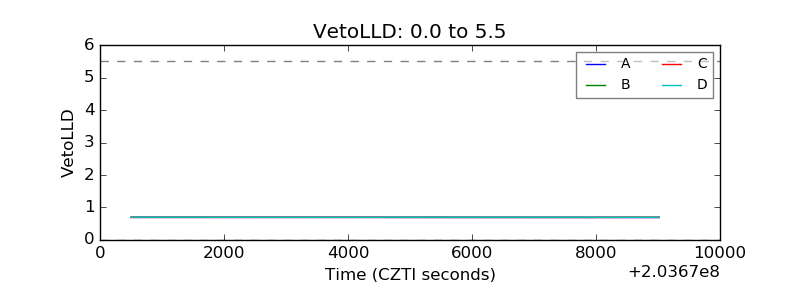 |
| Alpha Counter | 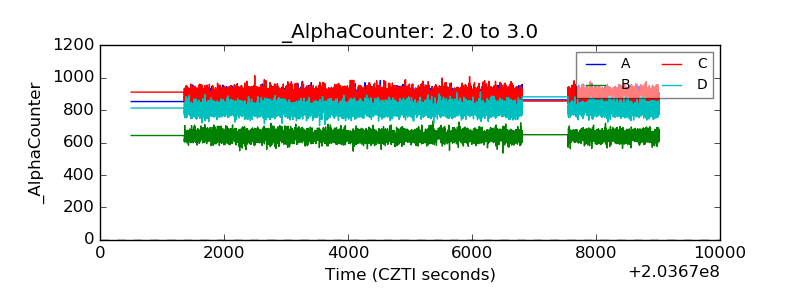 |
| _CPM_Rate | 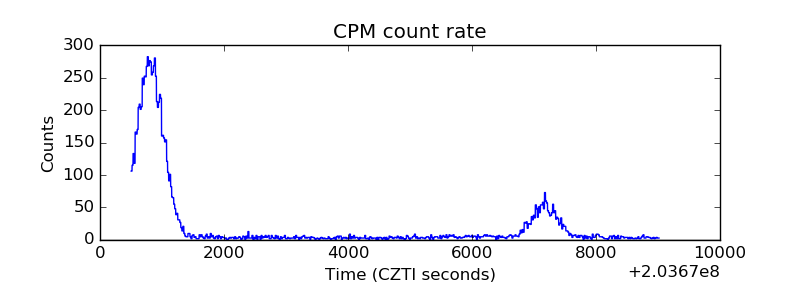 |
| CZT Counter | 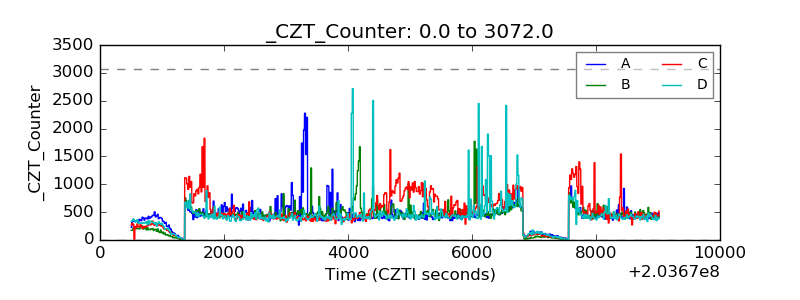 |
| +2.5 Volts monitor |  |
| +5 Volts monitor |  |
| Veto Counter | 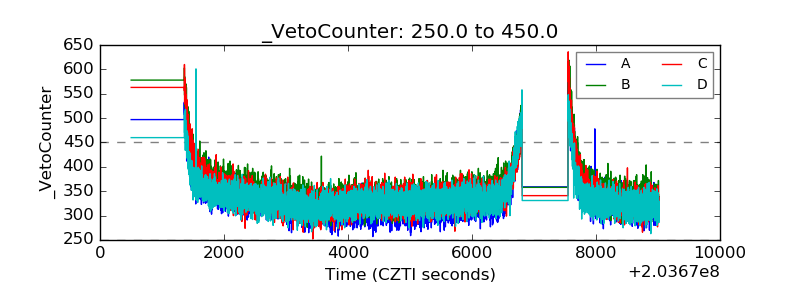 |