| Param | Original file | Final file |
|---|---|---|
| Filename | modeM0/AS1G05_083T01_9000000494_03868cztM0_level2.evt | modeM0/AS1G05_083T01_9000000494_03868cztM0_level2_quad_clean.evt |
| Size (bytes) | 592,646,400 | 102,458,880 |
| Size | 565.2 MB | 97.7 MB |
| Events in quadrant A | 4,272,934 | 641,948 |
| Events in quadrant B | 3,959,521 | 653,655 |
| Events in quadrant C | 5,010,144 | 637,584 |
| Events in quadrant D | 4,172,926 | 623,451 |
| Mode M0 | |||
|---|---|---|---|
| Quadrant | BADHDUFLAG | Total packets | Discarded packets |
| A | 0 | 18216 | 3 |
| B | 0 | 17043 | 2 |
| C | 0 | 20184 | 2 |
| D | 0 | 18222 | 2 |
| Mode M9 | |||
|---|---|---|---|
| Quadrant | BADHDUFLAG | Total packets | Discarded packets |
| A | 0 | 8 | 0 |
| B | 0 | 8 | 0 |
| C | 0 | 8 | 0 |
| D | 0 | 8 | 0 |
| Mode SS | |||
|---|---|---|---|
| Quadrant | BADHDUFLAG | Total packets | Discarded packets |
| A | 0 | 162 | 0 |
| B | 0 | 162 | 0 |
| C | 0 | 162 | 0 |
| D | 0 | 162 | 0 |
| Quadrant | Total seconds | Saturated seconds | Saturation percentage |
|---|---|---|---|
| A | 7850 | 452 | 5.757962% |
| B | 7850 | 294 | 3.745223% |
| C | 7850 | 359 | 4.573248% |
| D | 7850 | 376 | 4.789809% |
Noise dominated data is calculated using 1-second bins in cleaned event files. If a bin has >2000 counts, and if more than 50% of those come from <1% of pixels, then it is considered to be noise-dominated and hence unusable.
| Quadrant | # 1 sec bins | Bins with >0 counts | Bins with >2000 counts | High rate bins dominated by noise | Noise dominated (total time) | Noise dominated (detector-on time) | Marked lightcurve |
|---|---|---|---|---|---|---|---|
| A | 8675 | 7850 | 62 | 62 | 0.71% | 0.79% | 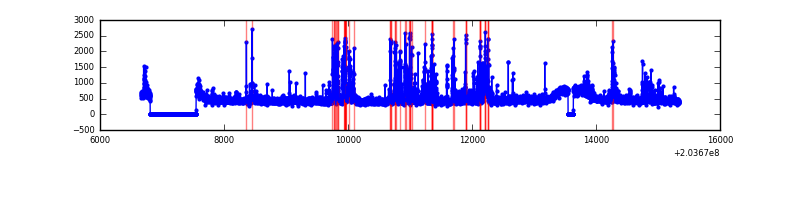 |
| B | 8675 | 7850 | 1 | 1 | 0.01% | 0.01% | 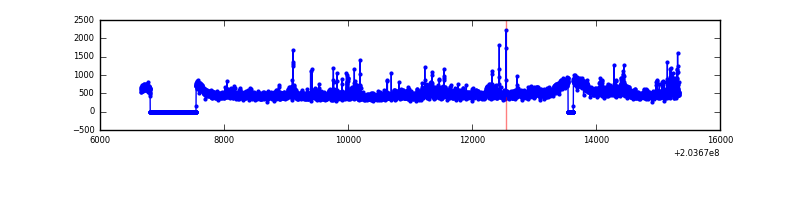 |
| C | 8675 | 7850 | 32 | 32 | 0.37% | 0.41% | 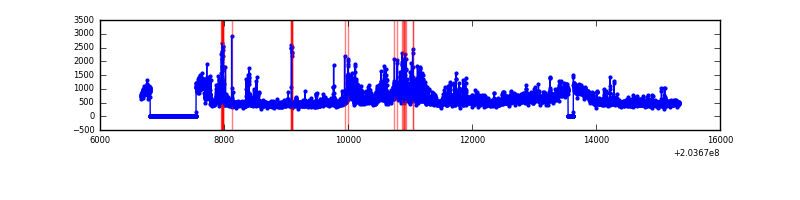 |
| D | 8674 | 7849 | 92 | 92 | 1.06% | 1.17% | 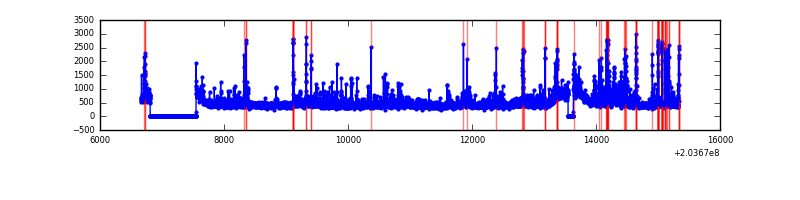 |
Top three noisy pixels from each quadrant. If the there are fewer than three noisy pixels in the level2.evt file, extra rows are filled as -1
| Pixel properties | Quadrant properties | ||||||
|---|---|---|---|---|---|---|---|
| Quadrant | DetID | PixID | Counts | Sigma | Mean | Median | Sigma |
| A | 0 | 118 | 546870 | 2956.14 | 904 | 882 | 184.7 |
| A | 8 | 15 | 95183 | 510.57 | 904 | 882 | 184.7 |
| A | 0 | 226 | 59414 | 316.91 | 904 | 882 | 184.7 |
| B | 15 | 204 | 365671 | 2082.92 | 912 | 888 | 175.1 |
| B | 4 | 48 | 22962 | 126.04 | 912 | 888 | 175.1 |
| B | 12 | 111 | 14293 | 76.54 | 912 | 888 | 175.1 |
| C | 2 | 53 | 1544600 | 7618.09 | 875 | 877 | 202.6 |
| C | 8 | 128 | 19775 | 93.26 | 875 | 877 | 202.6 |
| C | 8 | 112 | 9572 | 42.91 | 875 | 877 | 202.6 |
| D | 14 | 34 | 412732 | 1933.66 | 878 | 850 | 213.0 |
| D | 2 | 32 | 70286 | 325.98 | 878 | 850 | 213.0 |
| D | 13 | 239 | 61001 | 282.39 | 878 | 850 | 213.0 |
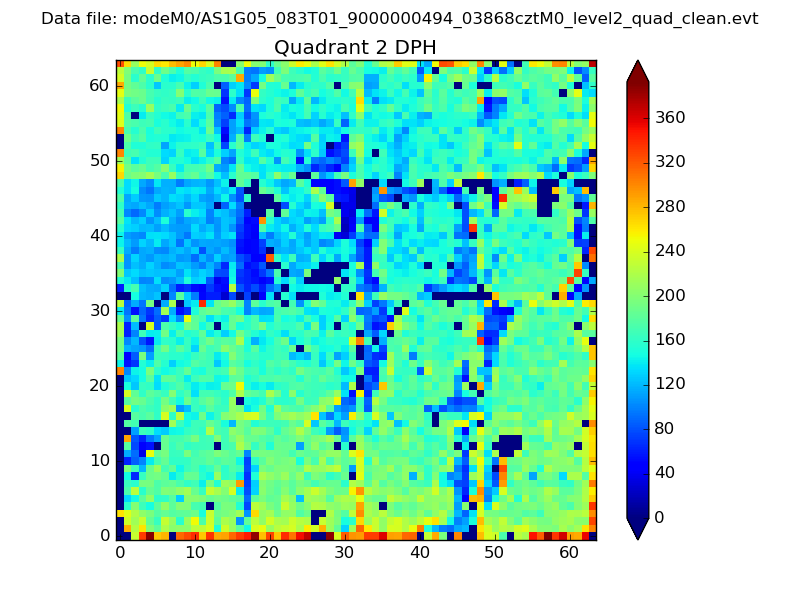
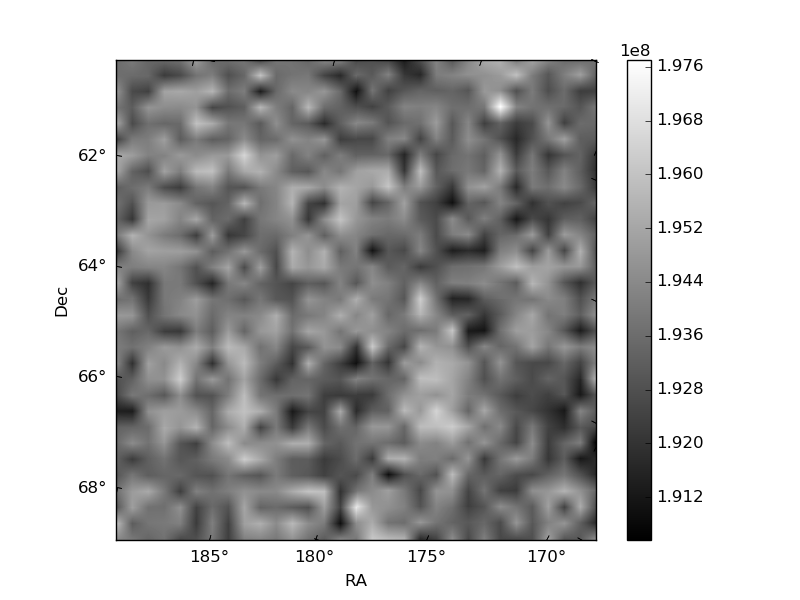
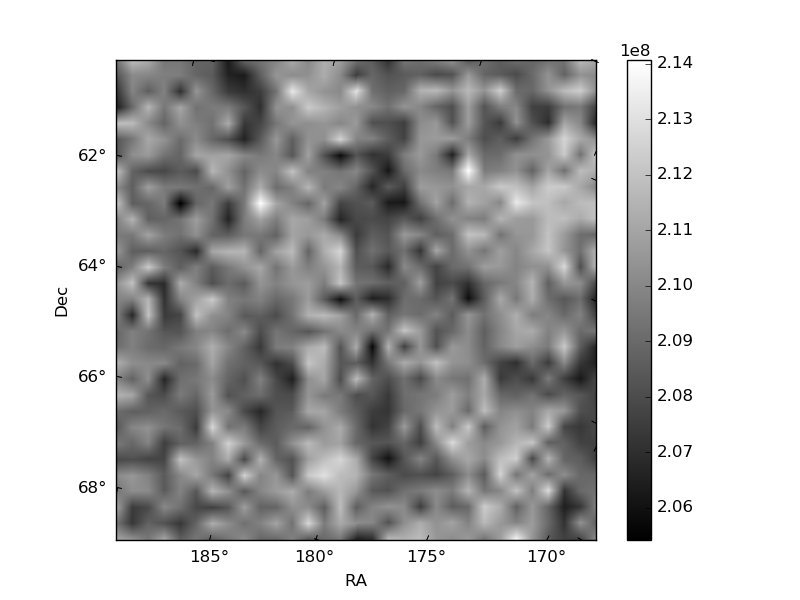
Histogram calculated using DETX and DETY for each event in the final _common_clean file
| Quadrant A | 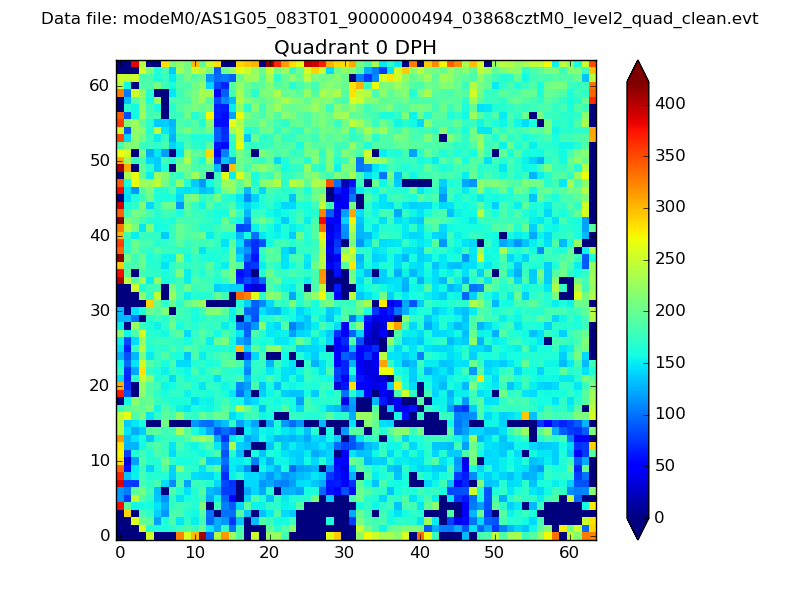 |
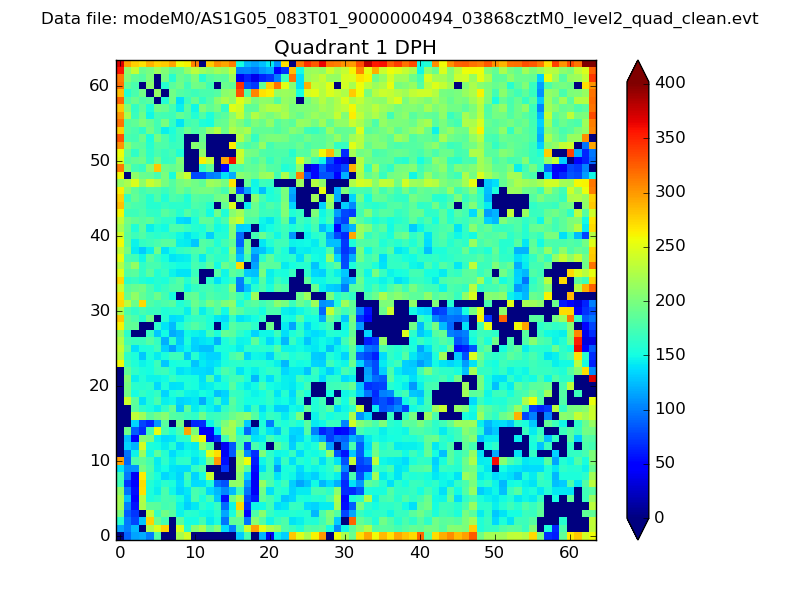 |
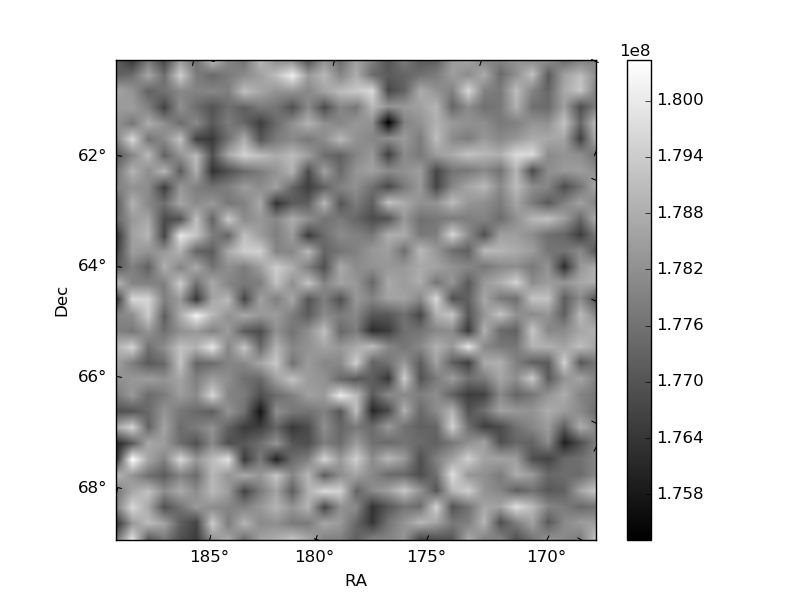
Quadrant B |
|---|---|---|---|
| Quadrant D | 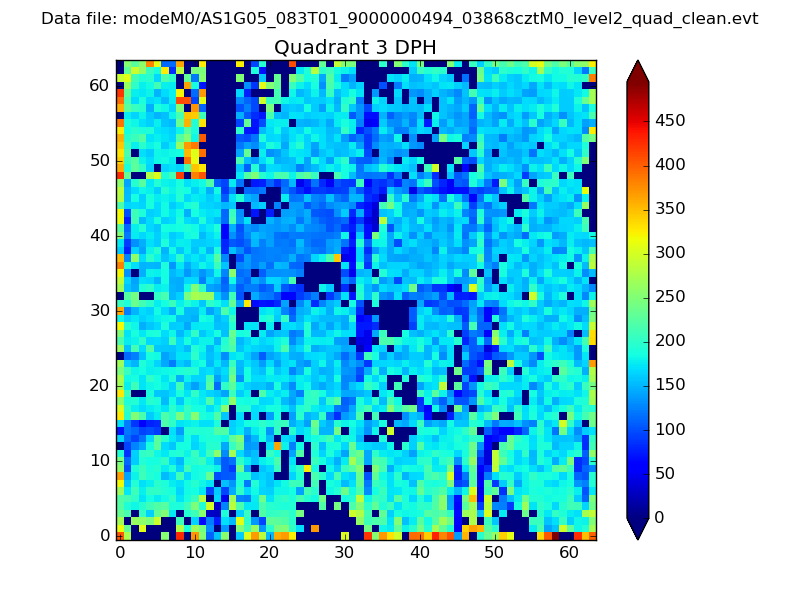 |
 |
Quadrant C |
| Plot type | Count rate plots | Images |
|---|---|---|
| Comparison with Poisson distribution Blue bars denote a histogram of data divided into 1 sec bins. Red curve is a Poisson curve with rate = median count rate of data. |
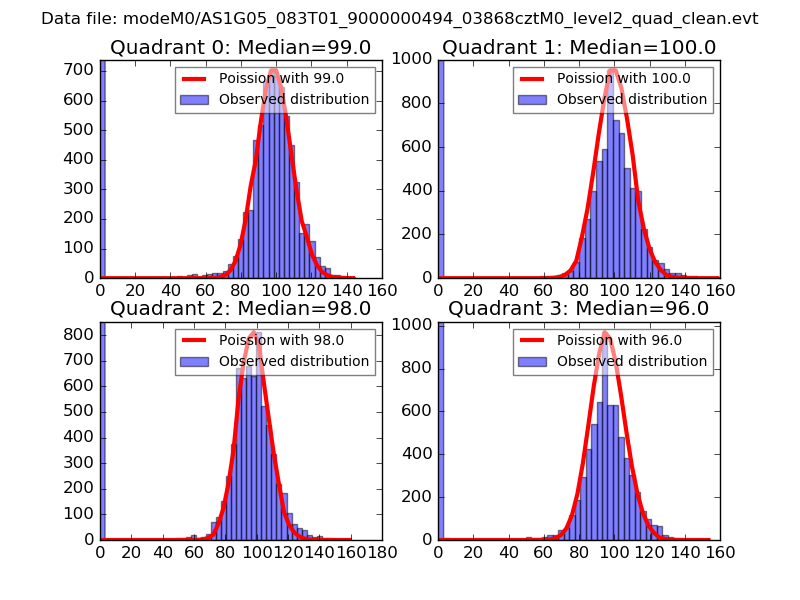 |
 |
| Quadrant-wise count rates Data is divided into 100 sec bins |
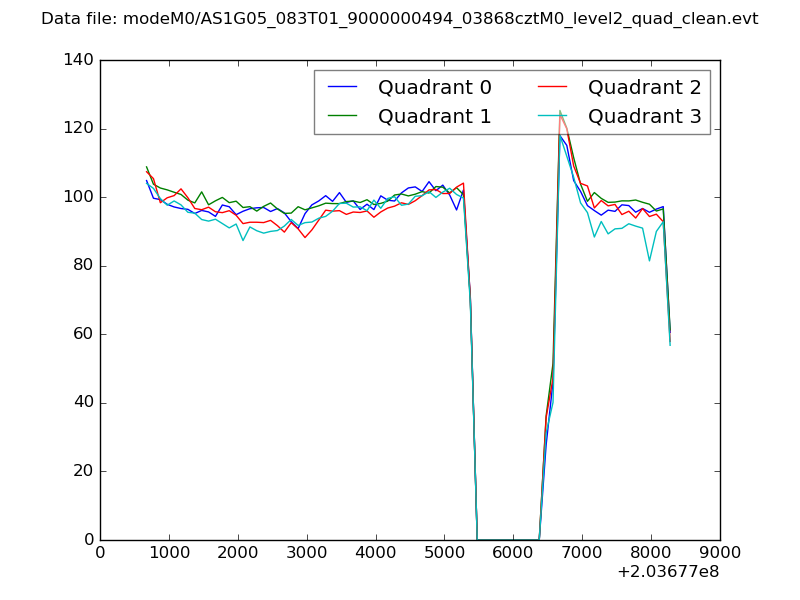 |
|
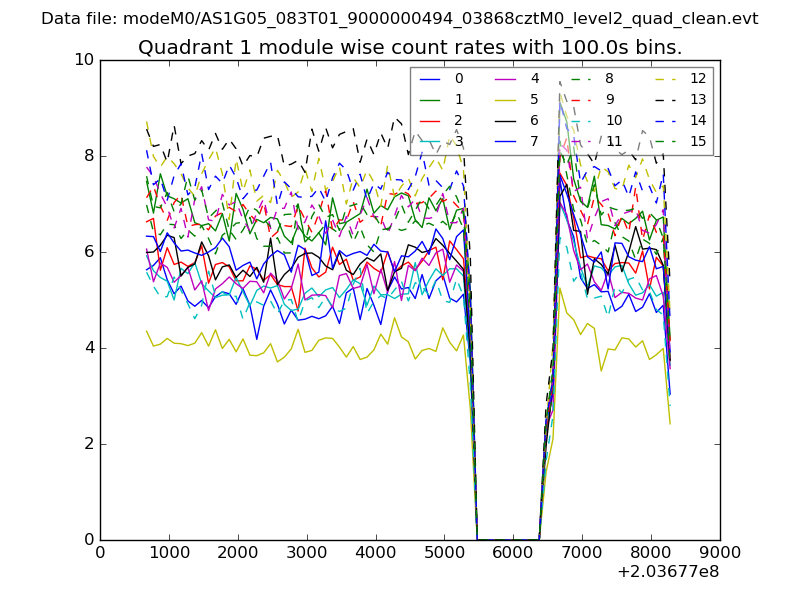
| Module-wise count rates for Quadrant A Data is divided into 100 sec bins |
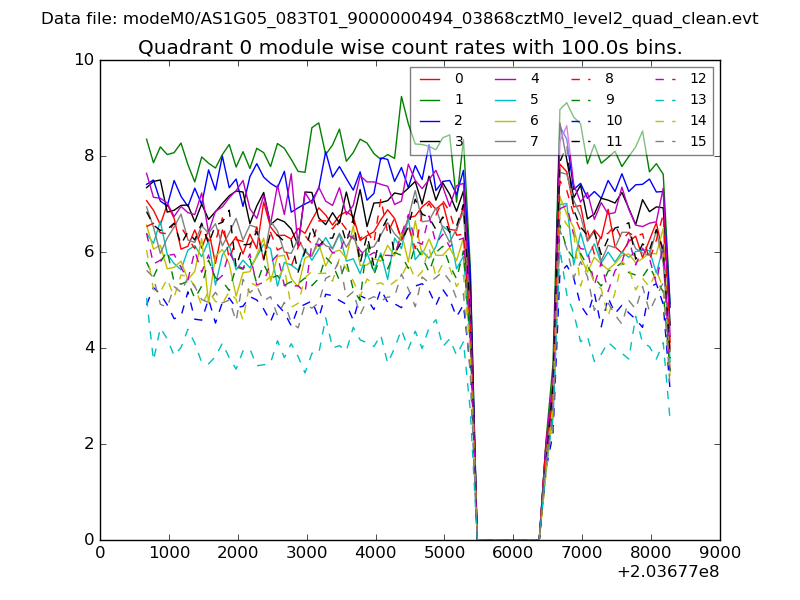 |
 |
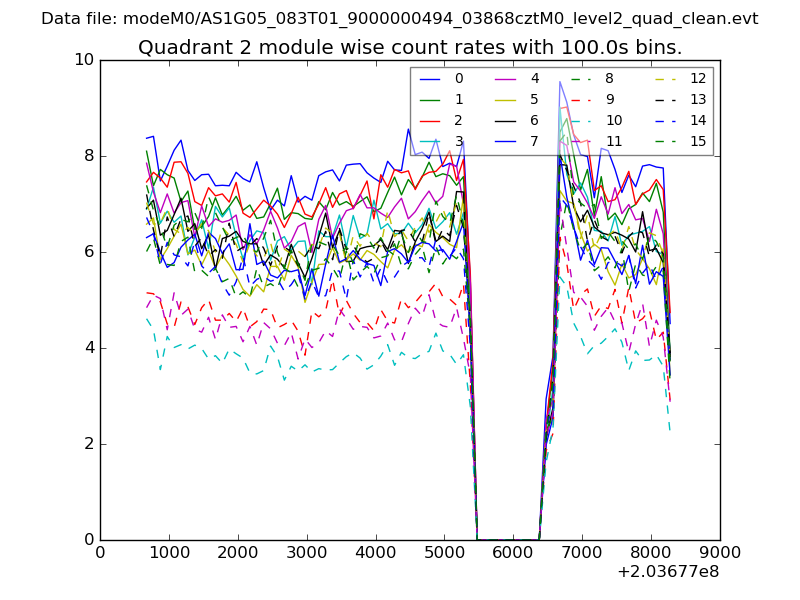
| Module-wise count rates for Quadrant B Data is divided into 100 sec bins |
 |
 |
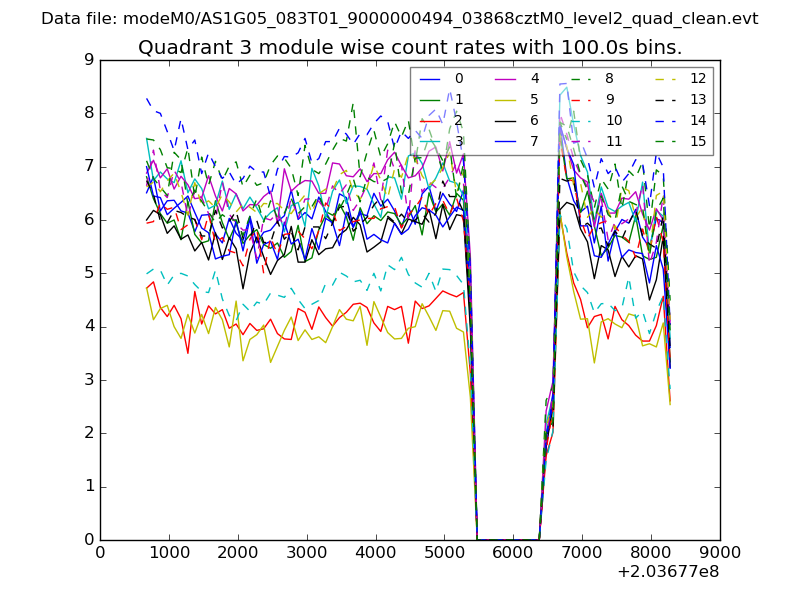
| Module-wise count rates for Quadrant C Data is divided into 100 sec bins |
 |
 |
| Module-wise count rates for Quadrant D Data is divided into 100 sec bins |
 |
 |
| Parameter | Plot |
|---|---|
| CZT HV Monitor | 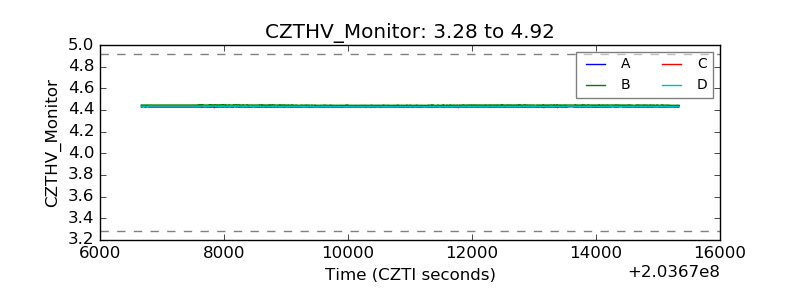 |
| D_VDD |  |
| Temperature 1 | 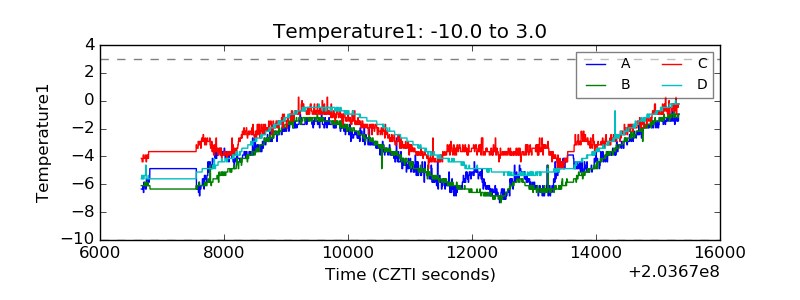 |
| Veto HV Monitor | 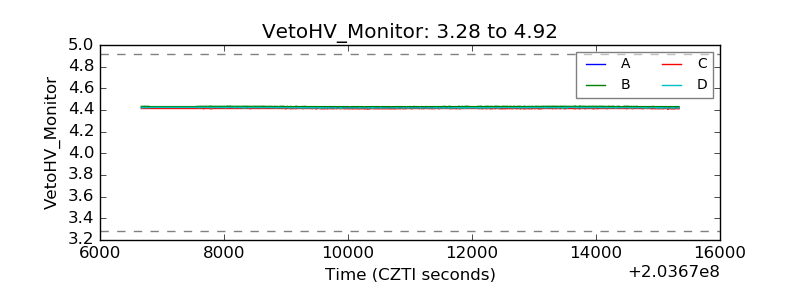 |
| Veto LLD | 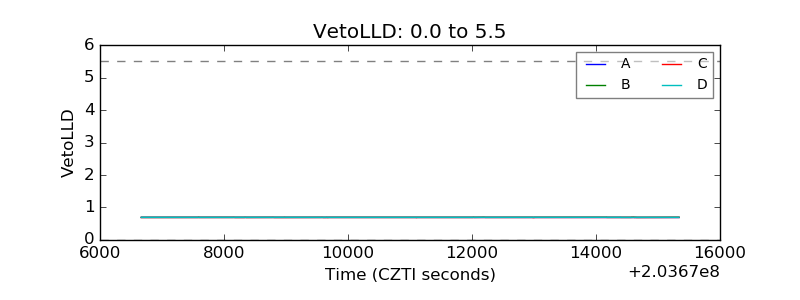 |
| Alpha Counter | 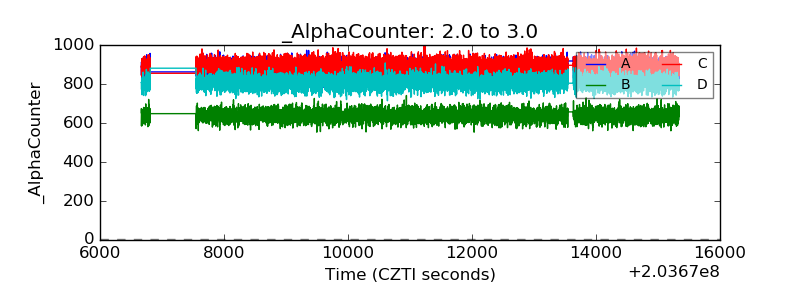 |
| _CPM_Rate | 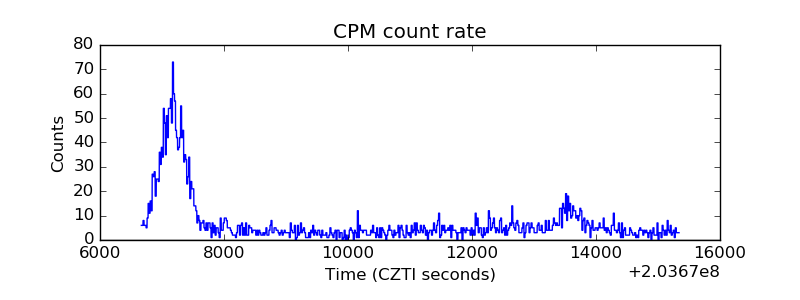 |
| CZT Counter | 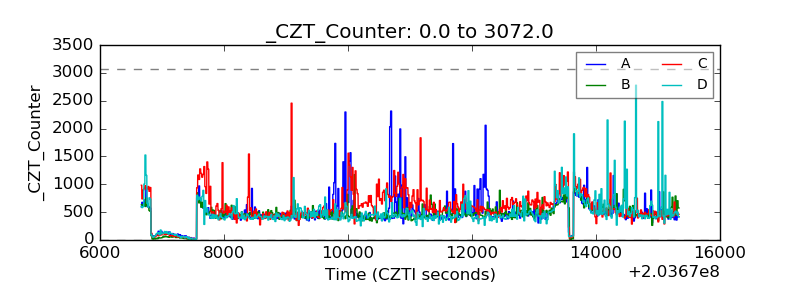 |
| +2.5 Volts monitor |  |
| +5 Volts monitor |  |
| Veto Counter | 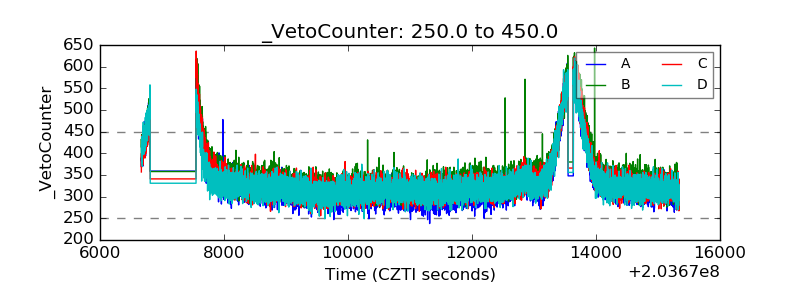 |