| Param | Original file | Final file |
|---|---|---|
| Filename | modeM0/AS1G05_083T01_9000000494_03869cztM0_level2.evt | modeM0/AS1G05_083T01_9000000494_03869cztM0_level2_quad_clean.evt |
| Size (bytes) | 347,575,680 | 58,343,040 |
| Size | 331.5 MB | 55.6 MB |
| Events in quadrant A | 2,335,908 | 368,966 |
| Events in quadrant B | 2,216,228 | 368,156 |
| Events in quadrant C | 2,523,650 | 361,950 |
| Events in quadrant D | 3,139,017 | 345,799 |
| Mode M0 | |||
|---|---|---|---|
| Quadrant | BADHDUFLAG | Total packets | Discarded packets |
| A | 0 | 11051 | 774 |
| B | 0 | 10549 | 798 |
| C | 0 | 11496 | 1109 |
| D | 0 | 13917 | 1261 |
| Mode SS | |||
|---|---|---|---|
| Quadrant | BADHDUFLAG | Total packets | Discarded packets |
| A | 0 | 99 | 9 |
| B | 0 | 99 | 7 |
| C | 0 | 100 | 12 |
| D | 0 | 100 | 8 |
| Quadrant | Total seconds | Saturated seconds | Saturation percentage |
|---|---|---|---|
| A | 4583 | 63 | 1.374645% |
| B | 4587 | 5 | 0.109004% |
| C | 4570 | 17 | 0.371991% |
| D | 4566 | 244 | 5.343846% |
Noise dominated data is calculated using 1-second bins in cleaned event files. If a bin has >2000 counts, and if more than 50% of those come from <1% of pixels, then it is considered to be noise-dominated and hence unusable.
| Quadrant | # 1 sec bins | Bins with >0 counts | Bins with >2000 counts | High rate bins dominated by noise | Noise dominated (total time) | Noise dominated (detector-on time) | Marked lightcurve |
|---|---|---|---|---|---|---|---|
| A | 5087 | 4632 | 49 | 49 | 0.96% | 1.06% | 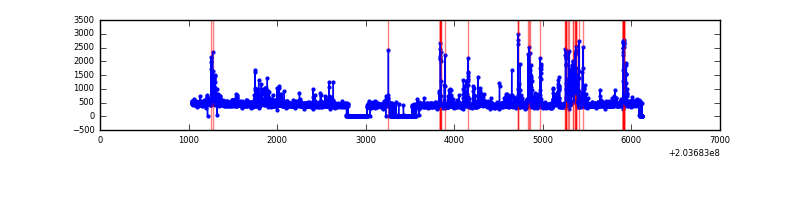 |
| B | 5085 | 4636 | 1 | 1 | 0.02% | 0.02% | 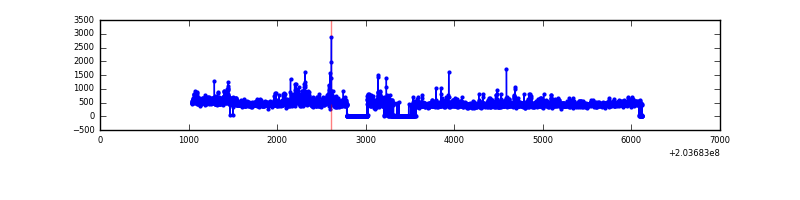 |
| C | 5083 | 4621 | 13 | 13 | 0.26% | 0.28% | 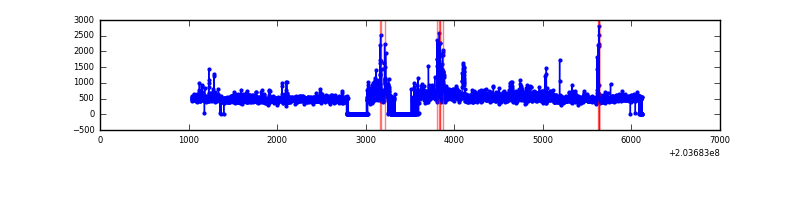 |
| D | 5081 | 4611 | 262 | 262 | 5.16% | 5.68% | 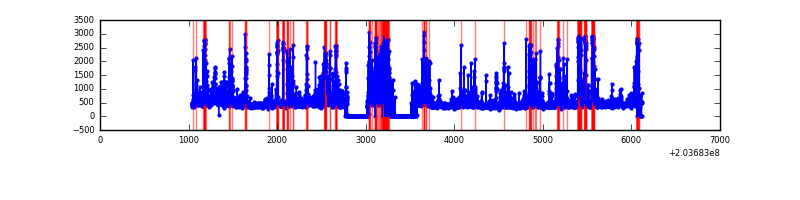 |
Top three noisy pixels from each quadrant. If the there are fewer than three noisy pixels in the level2.evt file, extra rows are filled as -1
| Pixel properties | Quadrant properties | ||||||
|---|---|---|---|---|---|---|---|
| Quadrant | DetID | PixID | Counts | Sigma | Mean | Median | Sigma |
| A | 0 | 118 | 232552 | 2312.06 | 483 | 473 | 100.4 |
| A | 13 | 251 | 177023 | 1758.86 | 483 | 473 | 100.4 |
| A | 8 | 15 | 26845 | 262.73 | 483 | 473 | 100.4 |
| B | 15 | 204 | 202437 | 2105.98 | 492 | 480 | 95.9 |
| B | 4 | 48 | 55692 | 575.74 | 492 | 480 | 95.9 |
| B | 10 | 246 | 20151 | 205.13 | 492 | 480 | 95.9 |
| C | 2 | 53 | 677628 | 6135.88 | 470 | 473 | 110.4 |
| C | 1 | 16 | 4249 | 34.22 | 470 | 473 | 110.4 |
| C | 13 | 61 | 3997 | 31.93 | 470 | 473 | 110.4 |
| D | 14 | 34 | 1183047 | 10500.05 | 460 | 447 | 112.6 |
| D | 2 | 32 | 43294 | 380.43 | 460 | 447 | 112.6 |
| D | 13 | 248 | 36706 | 321.94 | 460 | 447 | 112.6 |
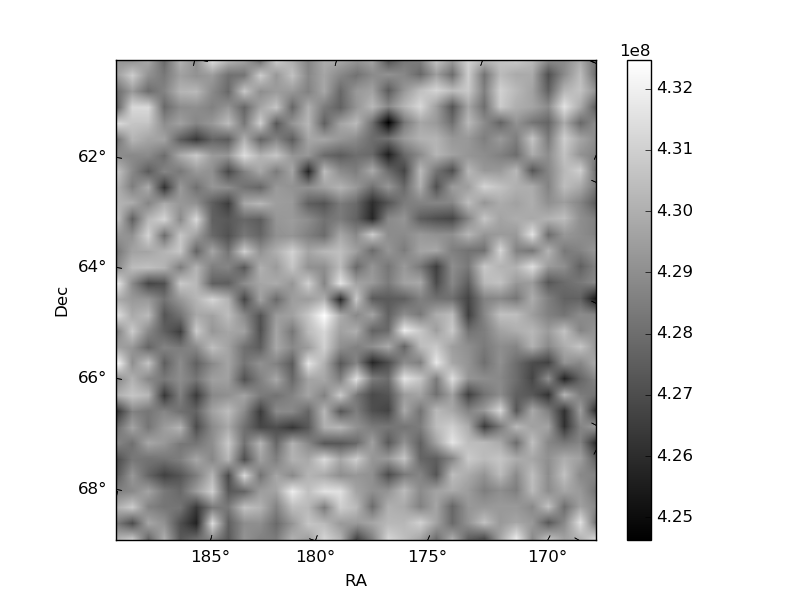
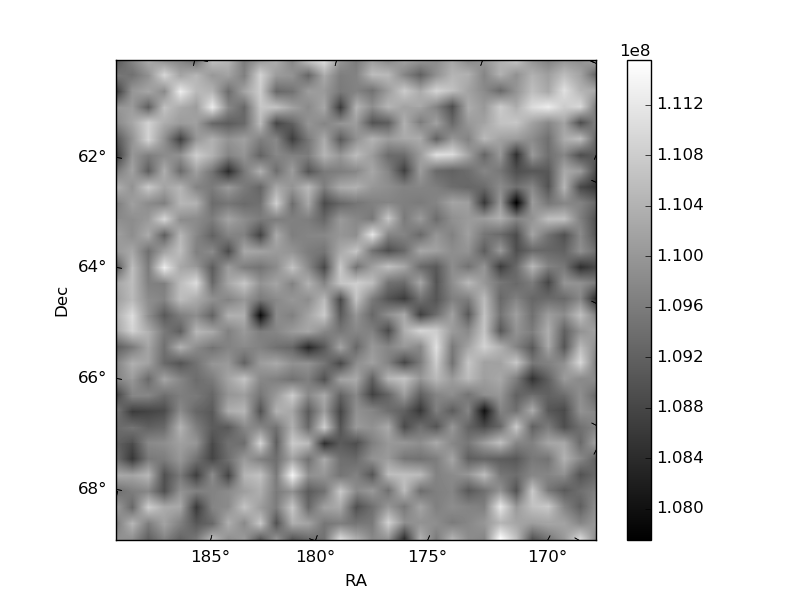
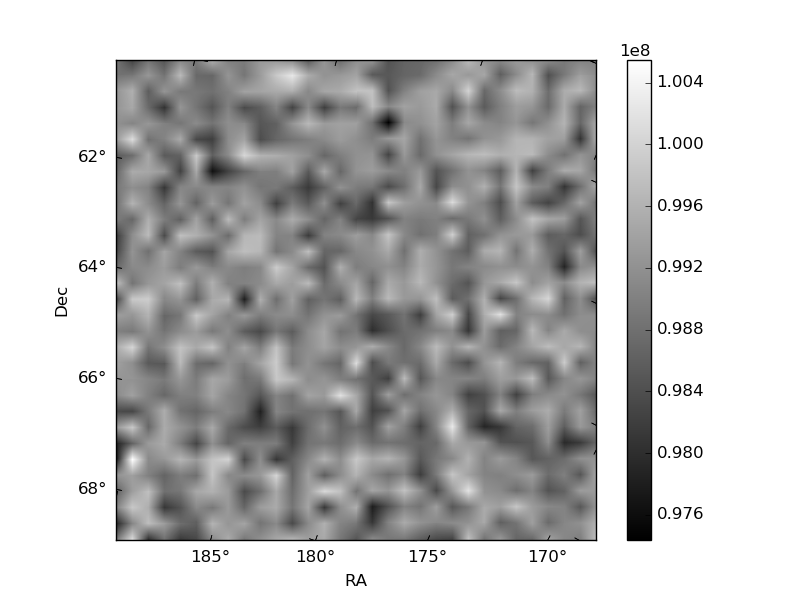
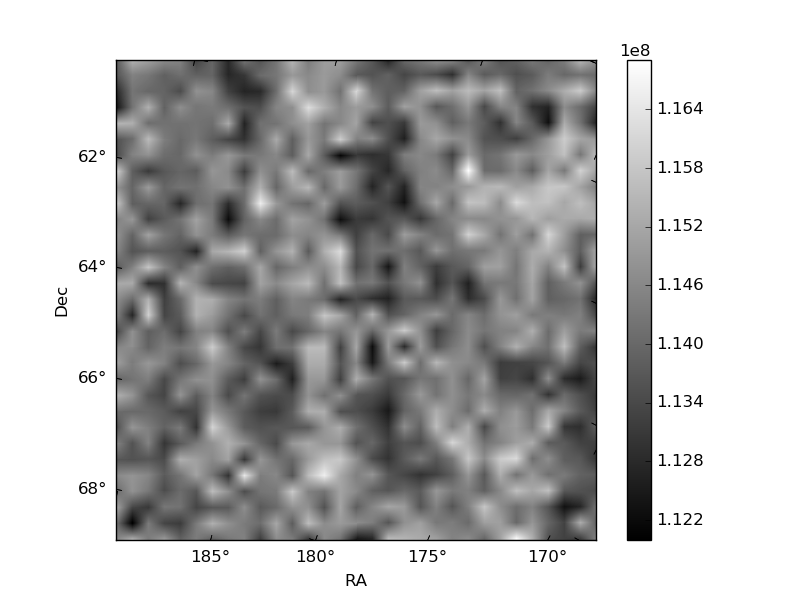
Histogram calculated using DETX and DETY for each event in the final _common_clean file
| Quadrant A | 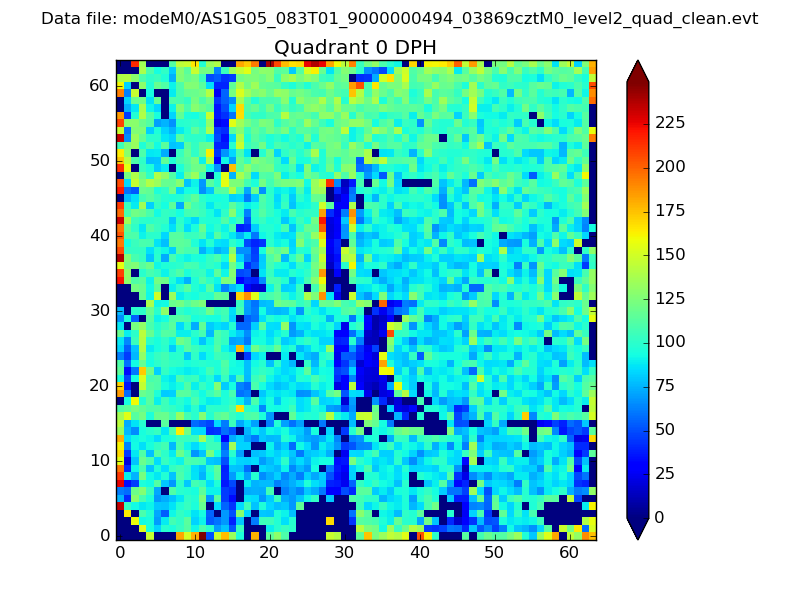 |
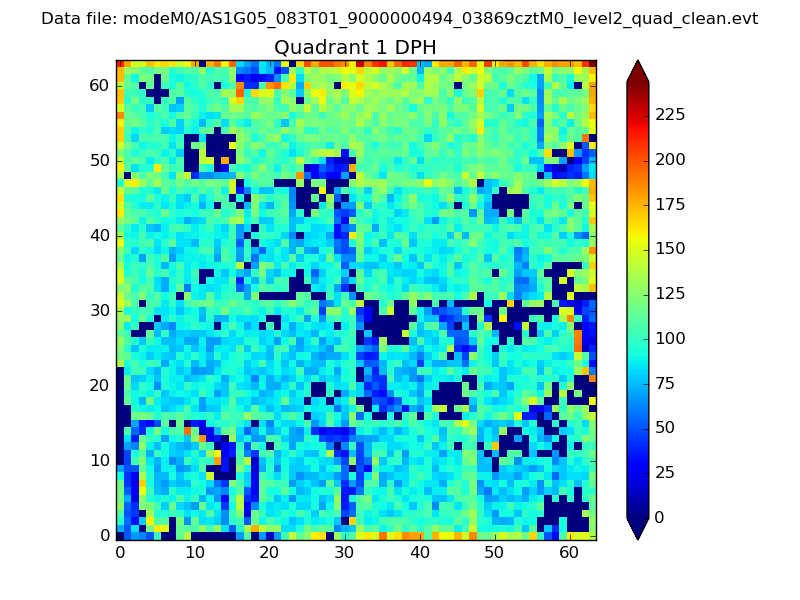 |
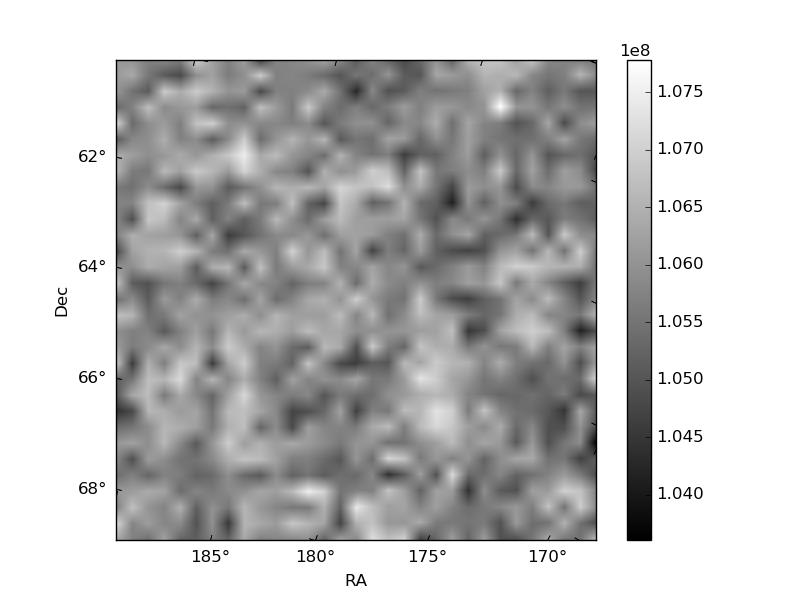
Quadrant B |
|---|---|---|---|
| Quadrant D | 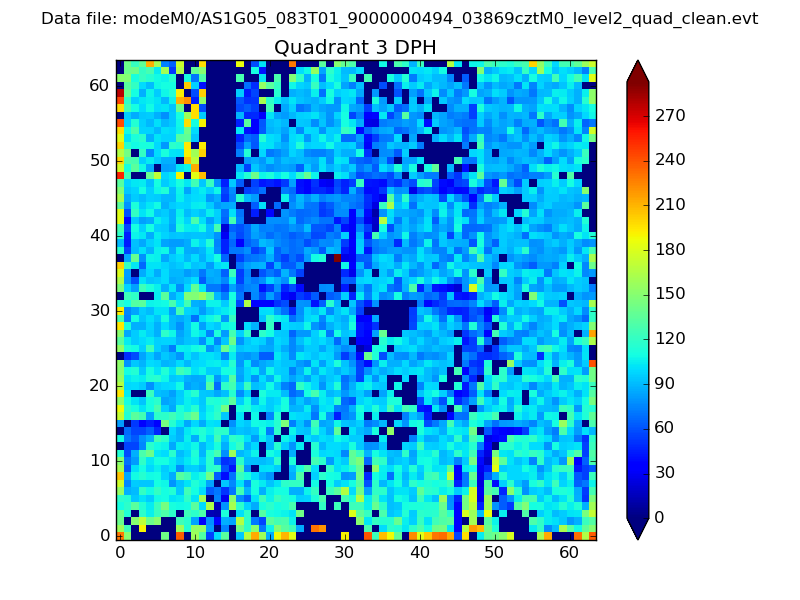 |
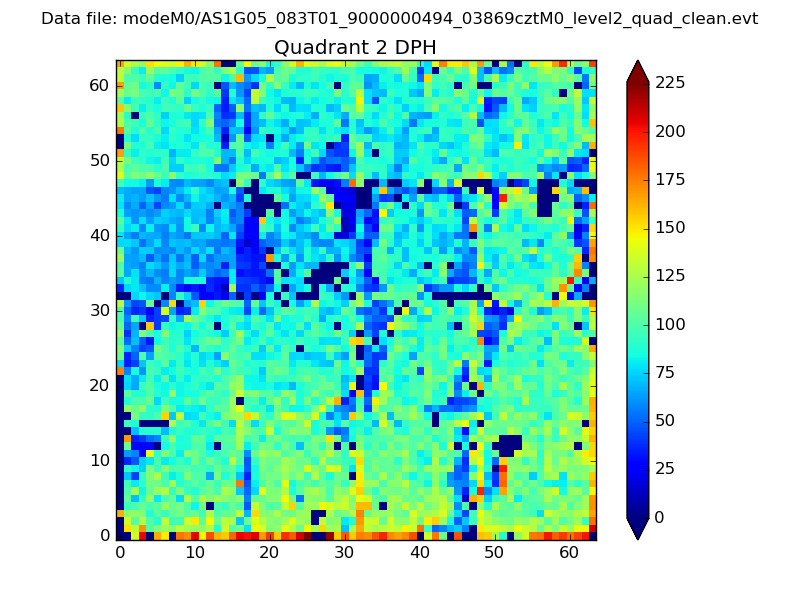 |
Quadrant C |
| Plot type | Count rate plots | Images |
|---|---|---|
| Comparison with Poisson distribution Blue bars denote a histogram of data divided into 1 sec bins. Red curve is a Poisson curve with rate = median count rate of data. |
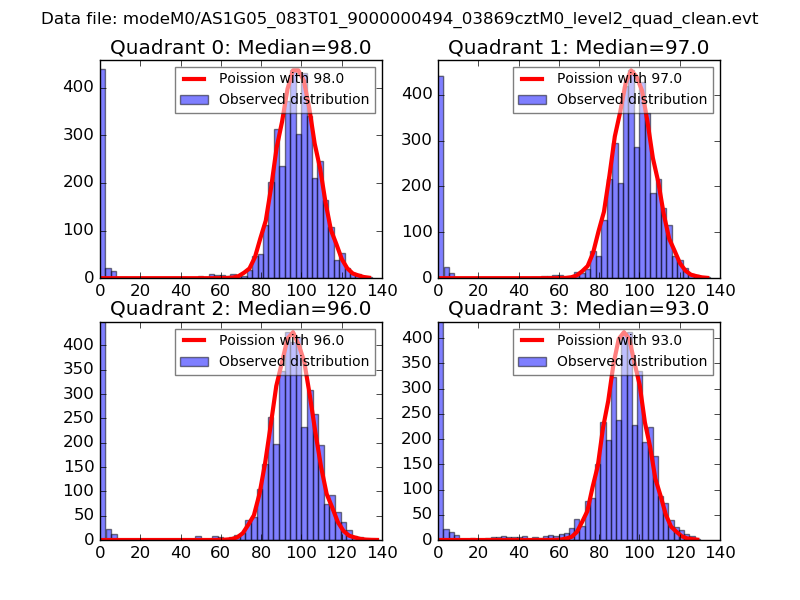 |
 |
| Quadrant-wise count rates Data is divided into 100 sec bins |
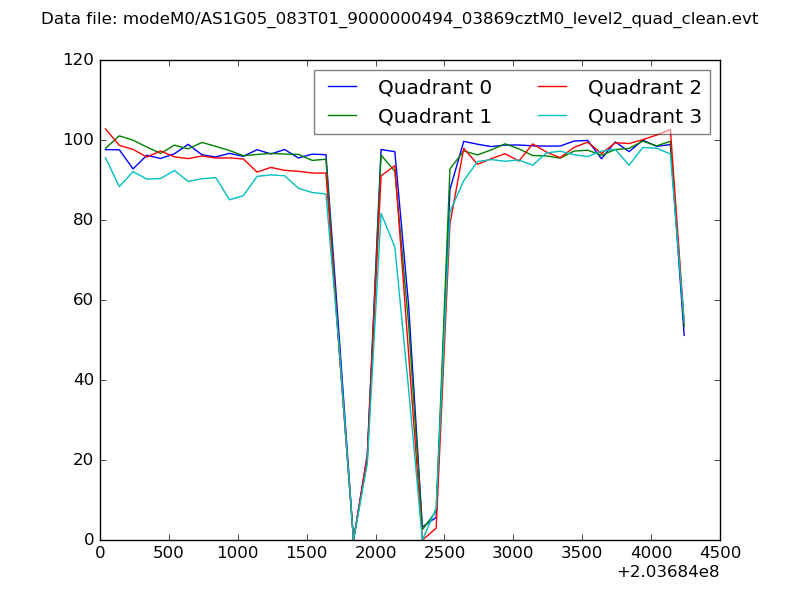 |
|
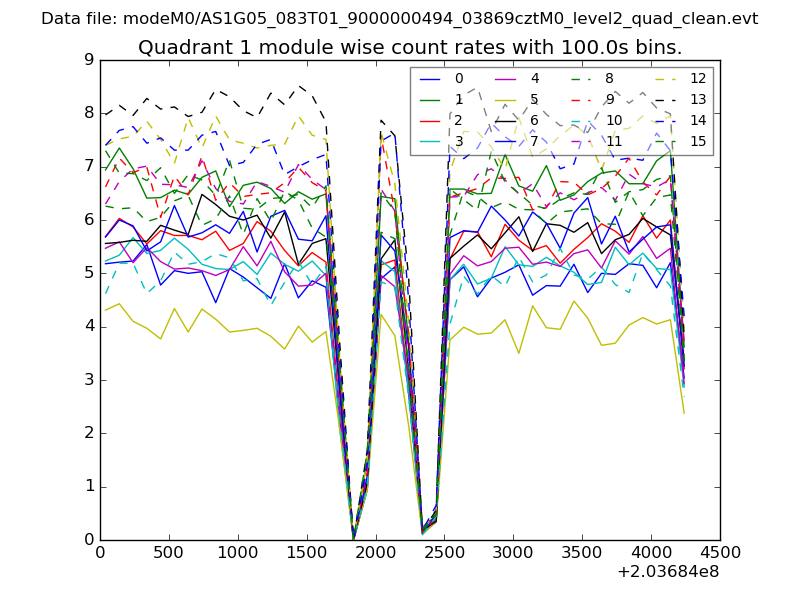
| Module-wise count rates for Quadrant A Data is divided into 100 sec bins |
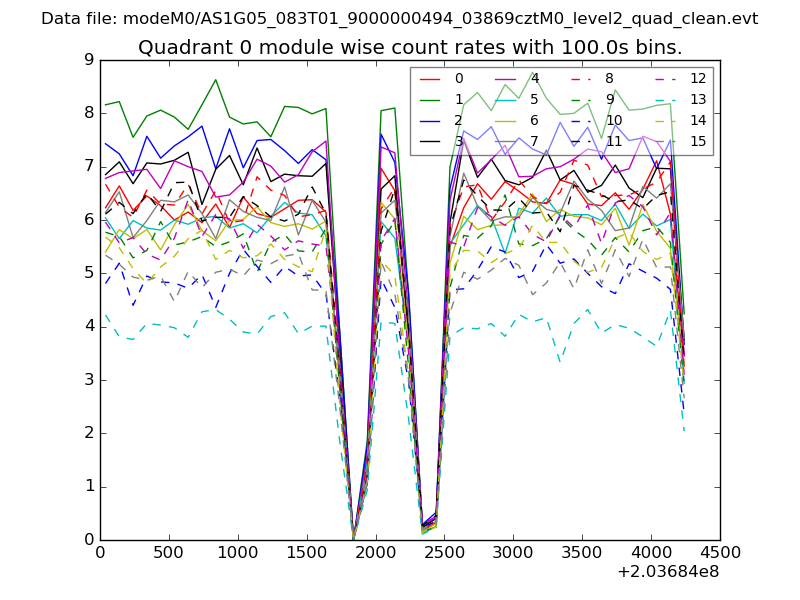 |
 |
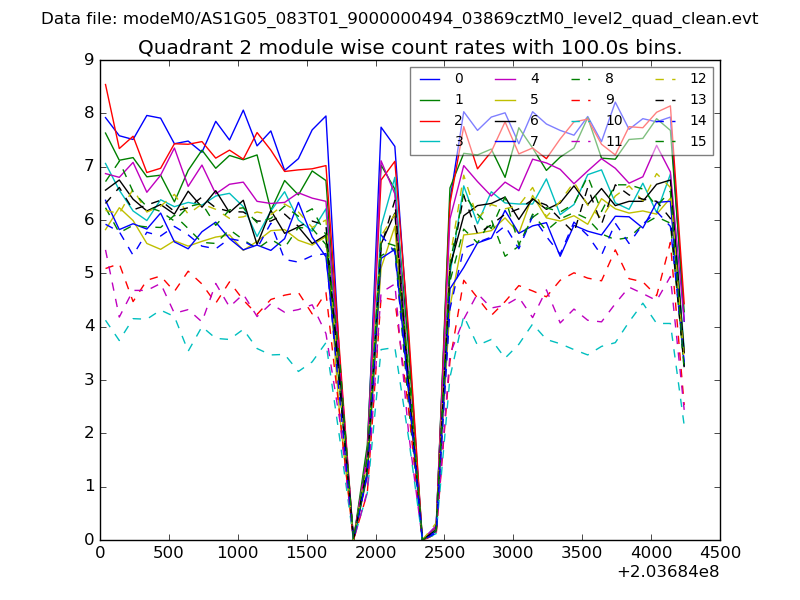
| Module-wise count rates for Quadrant B Data is divided into 100 sec bins |
 |
 |
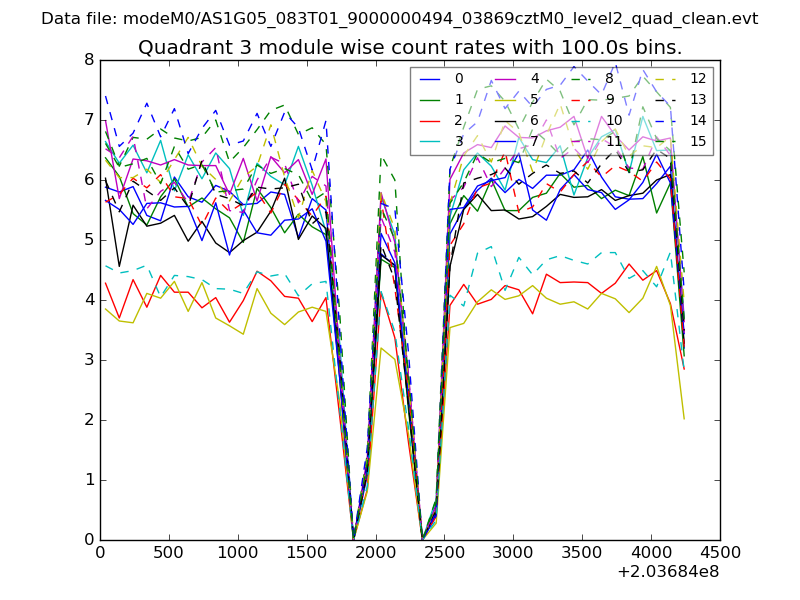
| Module-wise count rates for Quadrant C Data is divided into 100 sec bins |
 |
 |
| Module-wise count rates for Quadrant D Data is divided into 100 sec bins |
 |
 |
| Parameter | Plot |
|---|---|
| CZT HV Monitor | 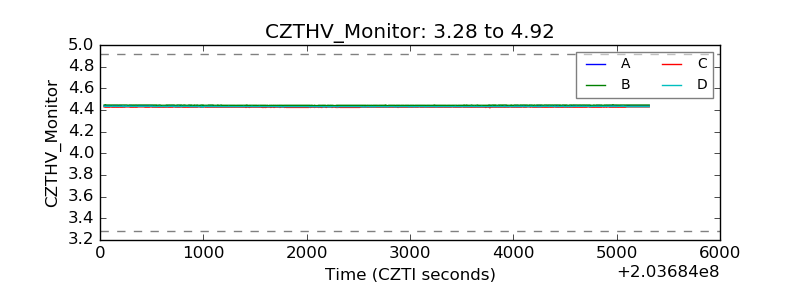 |
| D_VDD | 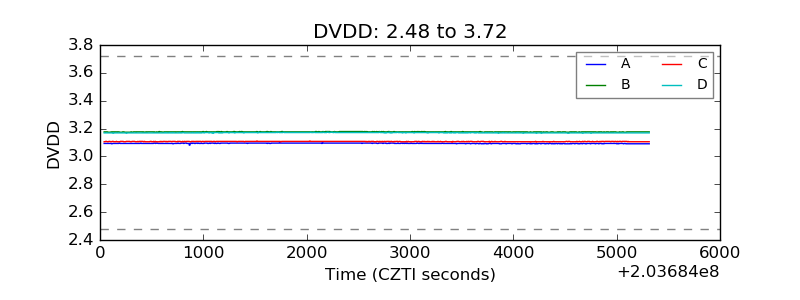 |
| Temperature 1 | 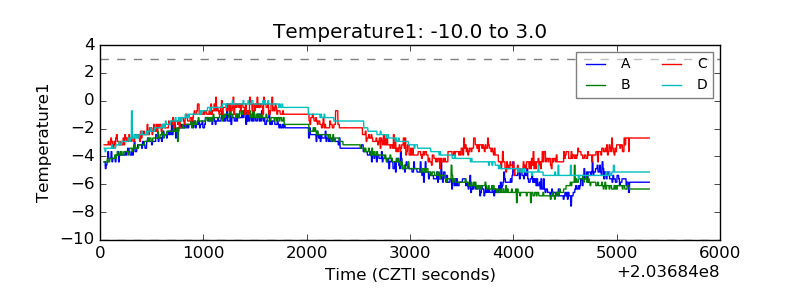 |
| Veto HV Monitor | 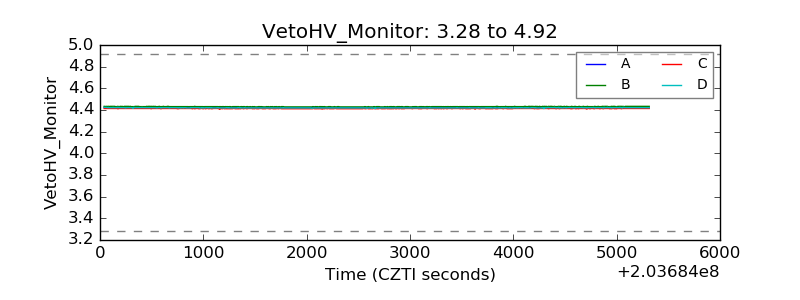 |
| Veto LLD | 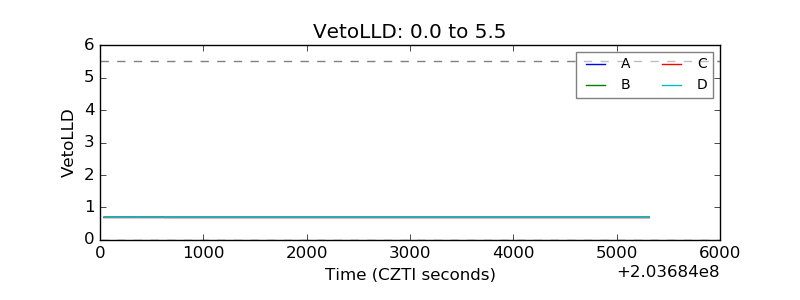 |
| Alpha Counter | 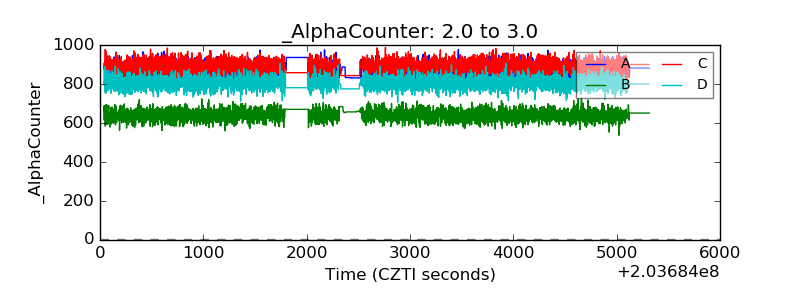 |
| _CPM_Rate | 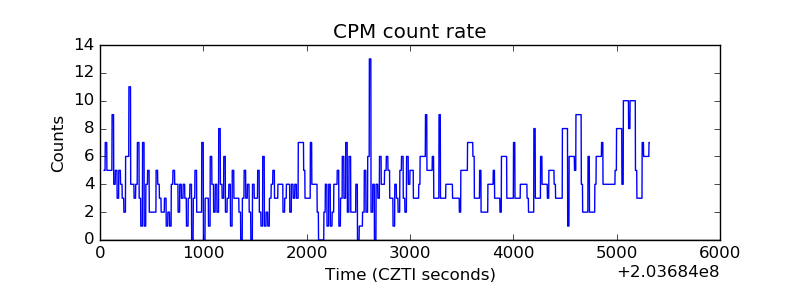 |
| CZT Counter | 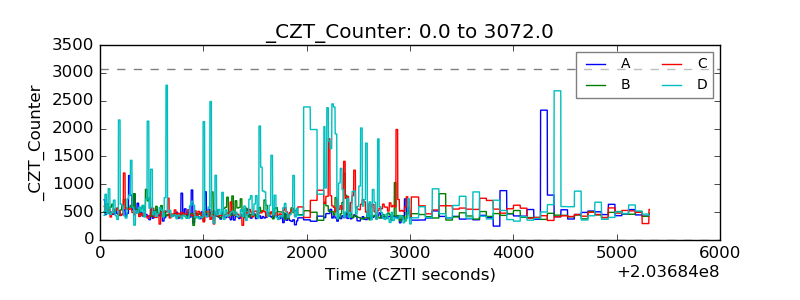 |
| +2.5 Volts monitor |  |
| +5 Volts monitor |  |
| Veto Counter | 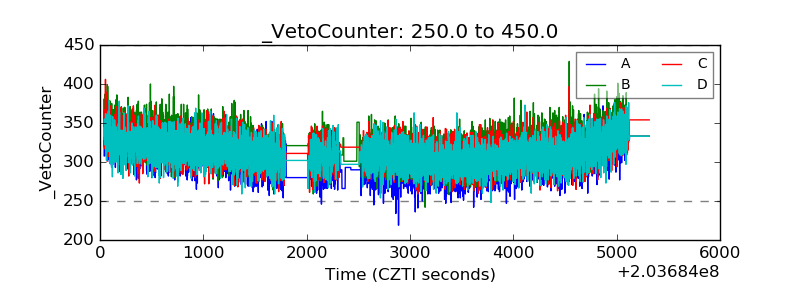 |