| Param | Original file | Final file |
|---|---|---|
| Filename | modeM0/AS1G05_083T01_9000000494_03870cztM0_level2.evt | modeM0/AS1G05_083T01_9000000494_03870cztM0_level2_quad_clean.evt |
| Size (bytes) | 416,315,520 | 53,798,400 |
| Size | 397.0 MB | 51.3 MB |
| Events in quadrant A | 4,053,410 | 296,473 |
| Events in quadrant B | 2,288,368 | 347,005 |
| Events in quadrant C | 3,158,475 | 335,657 |
| Events in quadrant D | 2,801,179 | 332,068 |
| Mode M0 | |||
|---|---|---|---|
| Quadrant | BADHDUFLAG | Total packets | Discarded packets |
| A | 0 | 17518 | 2052 |
| B | 0 | 11200 | 1226 |
| C | 0 | 13551 | 1097 |
| D | 0 | 12752 | 1084 |
| Mode M9 | |||
|---|---|---|---|
| Quadrant | BADHDUFLAG | Total packets | Discarded packets |
| A | 0 | 1 | 1 |
| B | 1 | 1 | 1 |
| C | 1 | -1 | -1 |
| D | 1 | -1 | -1 |
| Mode SS | |||
|---|---|---|---|
| Quadrant | BADHDUFLAG | Total packets | Discarded packets |
| A | 0 | 98 | 10 |
| B | 0 | 100 | 10 |
| C | 0 | 98 | 10 |
| D | 0 | 99 | 11 |
| Quadrant | Total seconds | Saturated seconds | Saturation percentage |
|---|---|---|---|
| A | 4488 | 945 | 21.056150% |
| B | 4520 | 21 | 0.464602% |
| C | 4523 | 177 | 3.913332% |
| D | 4525 | 159 | 3.513812% |
Noise dominated data is calculated using 1-second bins in cleaned event files. If a bin has >2000 counts, and if more than 50% of those come from <1% of pixels, then it is considered to be noise-dominated and hence unusable.
| Quadrant | # 1 sec bins | Bins with >0 counts | Bins with >2000 counts | High rate bins dominated by noise | Noise dominated (total time) | Noise dominated (detector-on time) | Marked lightcurve |
|---|---|---|---|---|---|---|---|
| A | 6438 | 4519 | 921 | 921 | 14.31% | 20.38% | 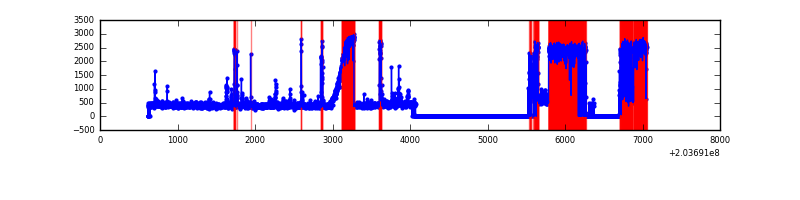 |
| B | 6433 | 4567 | 13 | 13 | 0.20% | 0.28% | 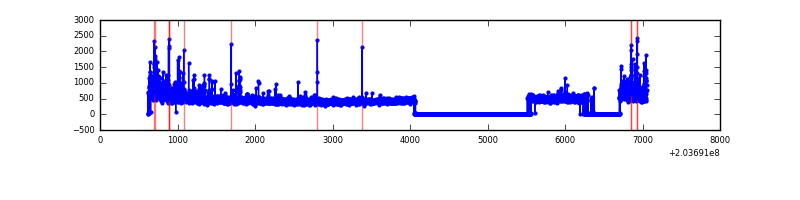 |
| C | 6433 | 4568 | 182 | 182 | 2.83% | 3.98% | 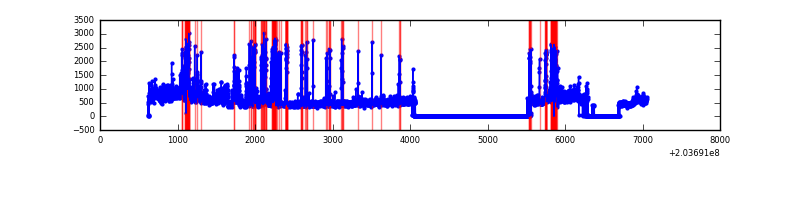 |
| D | 6445 | 4582 | 189 | 189 | 2.93% | 4.12% | 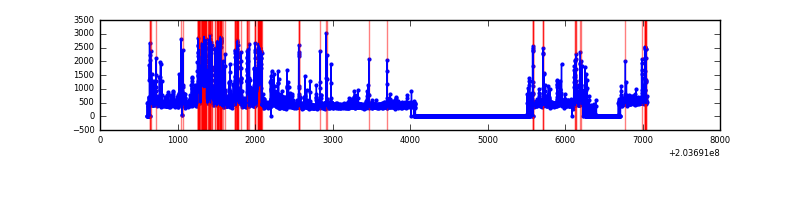 |
Top three noisy pixels from each quadrant. If the there are fewer than three noisy pixels in the level2.evt file, extra rows are filled as -1
| Pixel properties | Quadrant properties | ||||||
|---|---|---|---|---|---|---|---|
| Quadrant | DetID | PixID | Counts | Sigma | Mean | Median | Sigma |
| A | 0 | 199 | 1571236 | 18266.89 | 407 | 395 | 86.0 |
| A | 15 | 234 | 586798 | 6819.12 | 407 | 395 | 86.0 |
| A | 0 | 226 | 158063 | 1833.48 | 407 | 395 | 86.0 |
| B | 4 | 48 | 179568 | 1941.25 | 477 | 465 | 92.3 |
| B | 15 | 204 | 136674 | 1476.34 | 477 | 465 | 92.3 |
| B | 5 | 200 | 32849 | 351.0 | 477 | 465 | 92.3 |
| C | 2 | 53 | 1100328 | 10322.38 | 453 | 455 | 106.6 |
| C | 1 | 16 | 275245 | 2578.92 | 453 | 455 | 106.6 |
| C | 10 | 65 | 4875 | 41.48 | 453 | 455 | 106.6 |
| D | 14 | 34 | 729075 | 6516.16 | 456 | 442 | 111.8 |
| D | 1 | 20 | 91580 | 815.05 | 456 | 442 | 111.8 |
| D | 2 | 32 | 89109 | 792.95 | 456 | 442 | 111.8 |
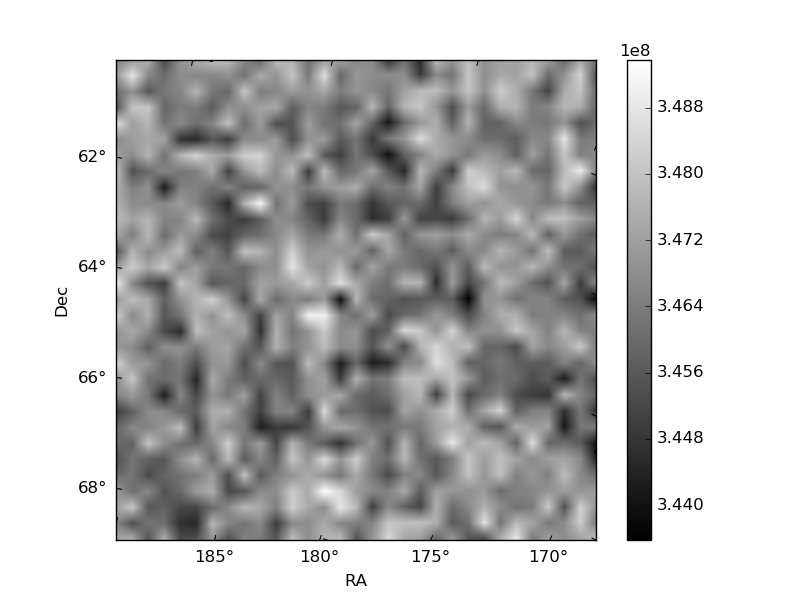
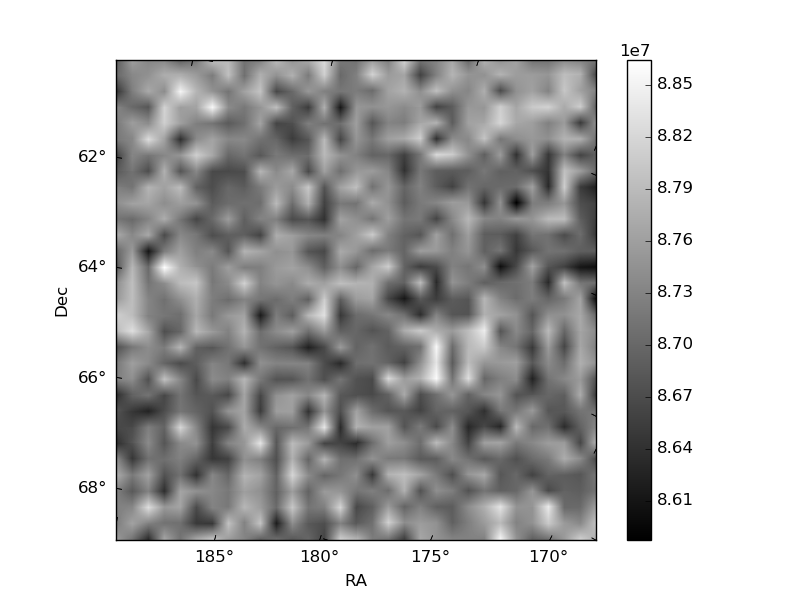
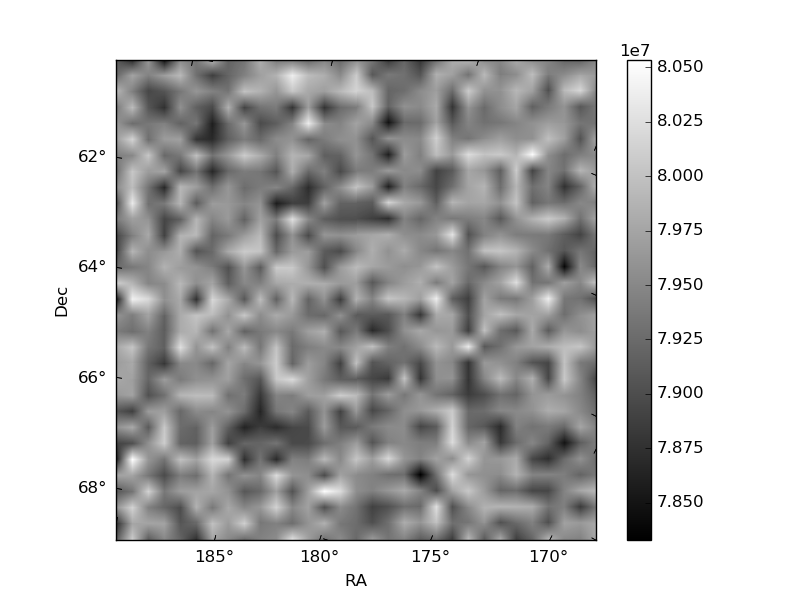
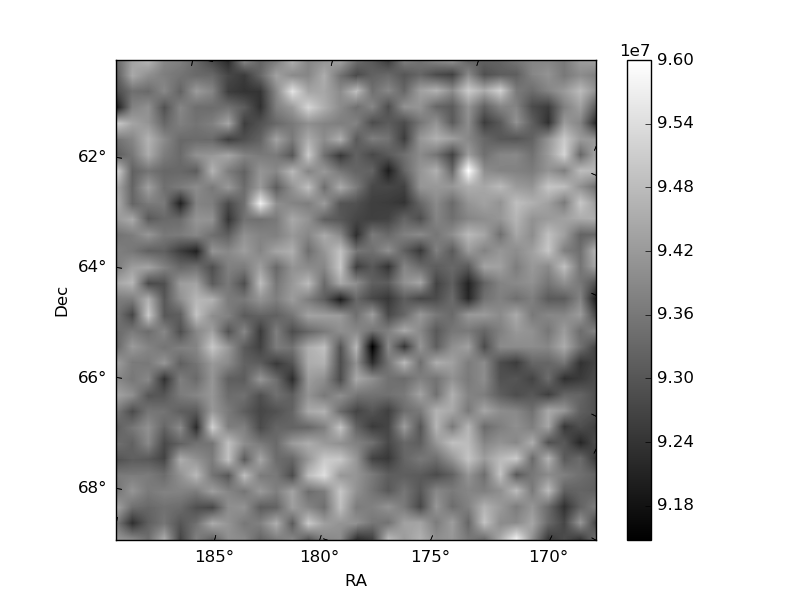
Histogram calculated using DETX and DETY for each event in the final _common_clean file
| Quadrant A | 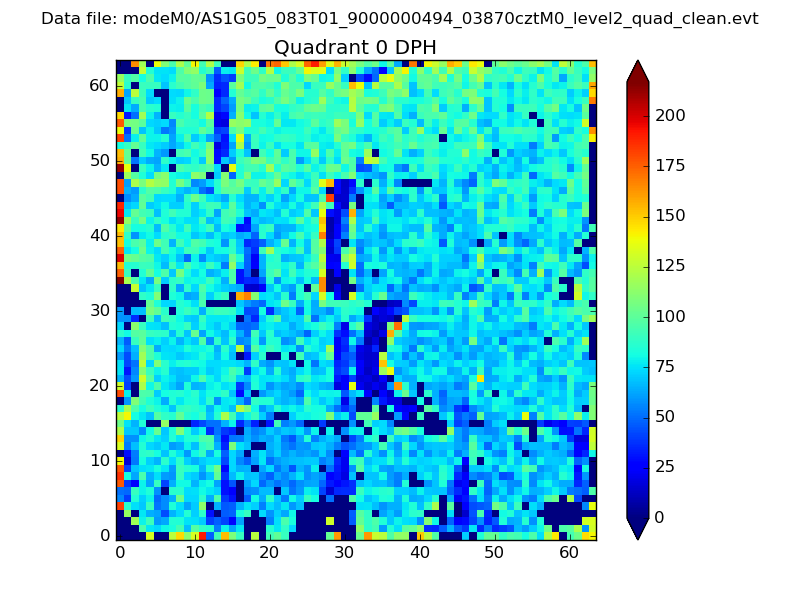 |
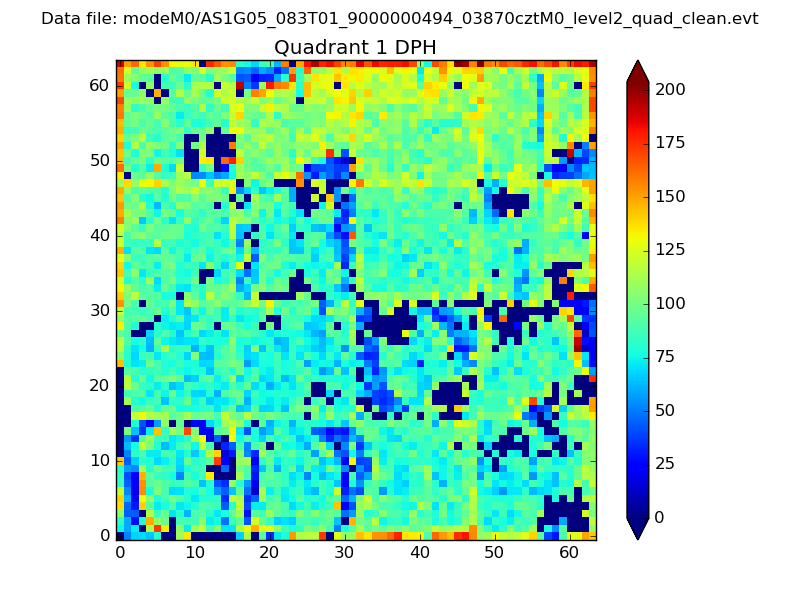 |
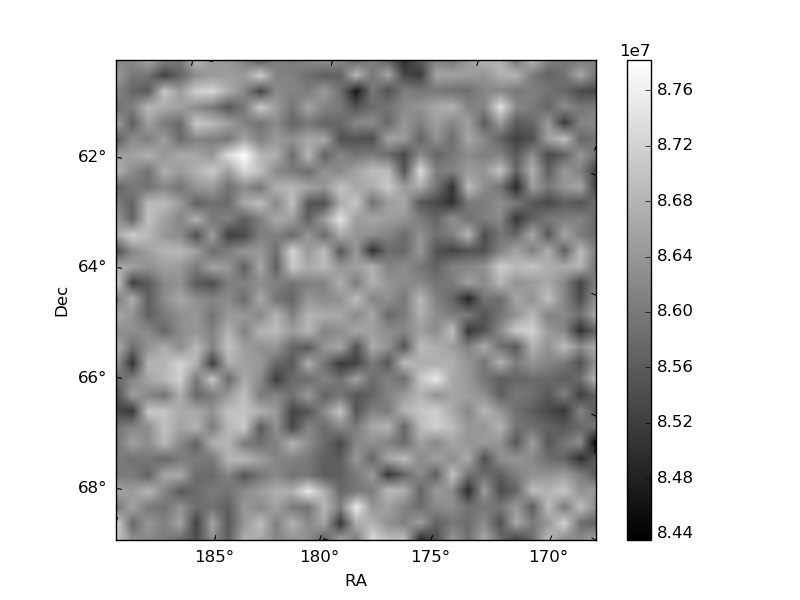
Quadrant B |
|---|---|---|---|
| Quadrant D | 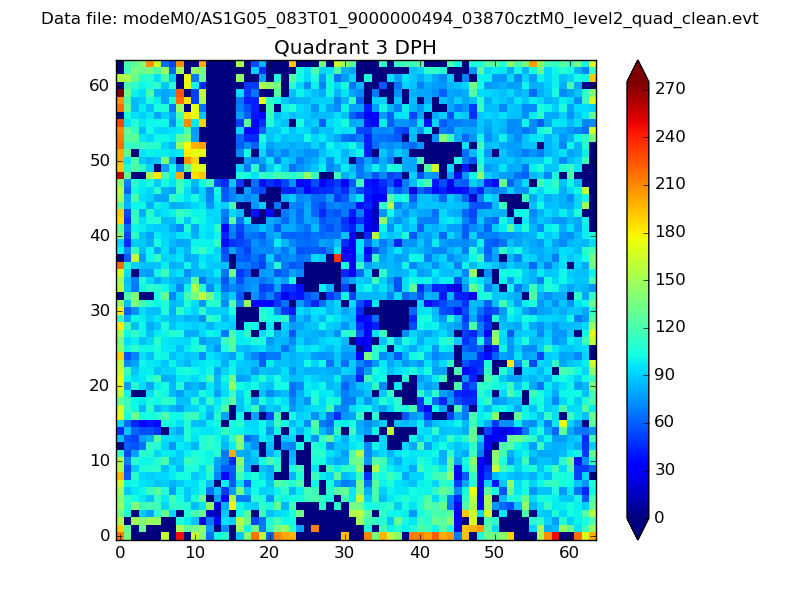 |
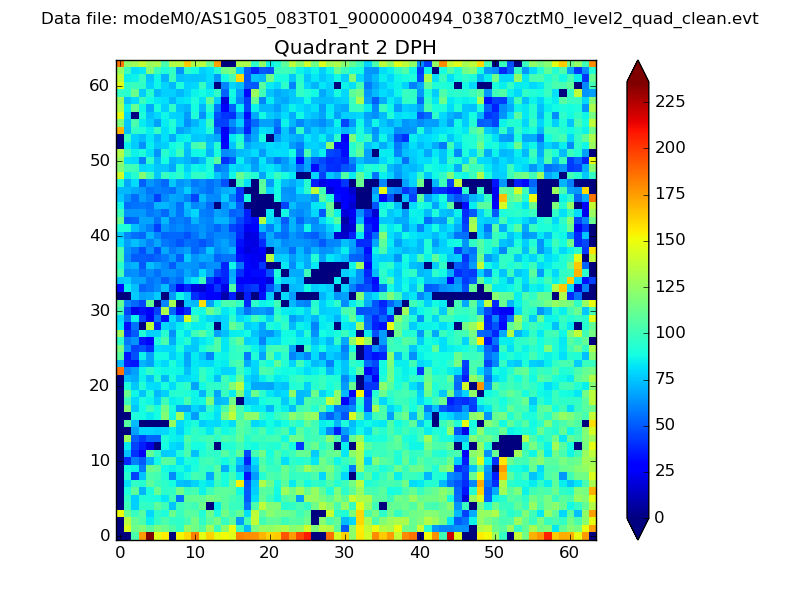 |
Quadrant C |
| Plot type | Count rate plots | Images |
|---|---|---|
| Comparison with Poisson distribution Blue bars denote a histogram of data divided into 1 sec bins. Red curve is a Poisson curve with rate = median count rate of data. |
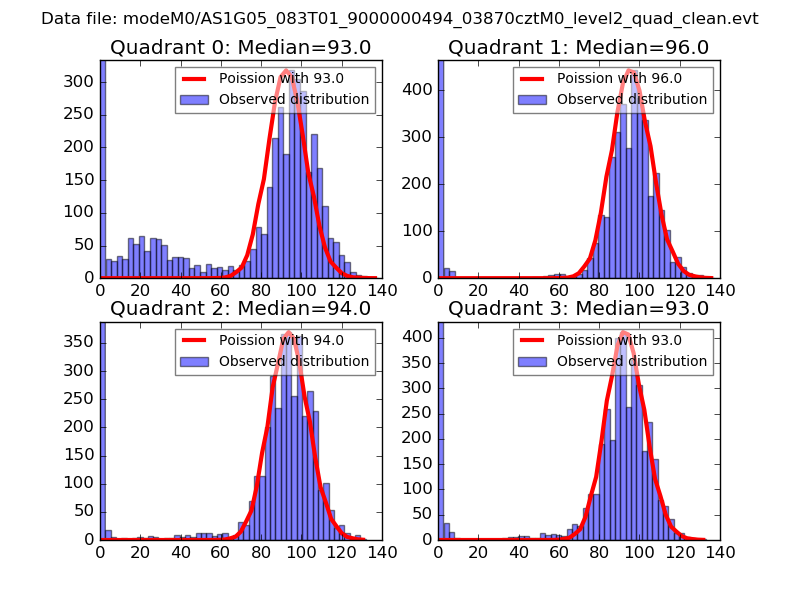 |
 |
| Quadrant-wise count rates Data is divided into 100 sec bins |
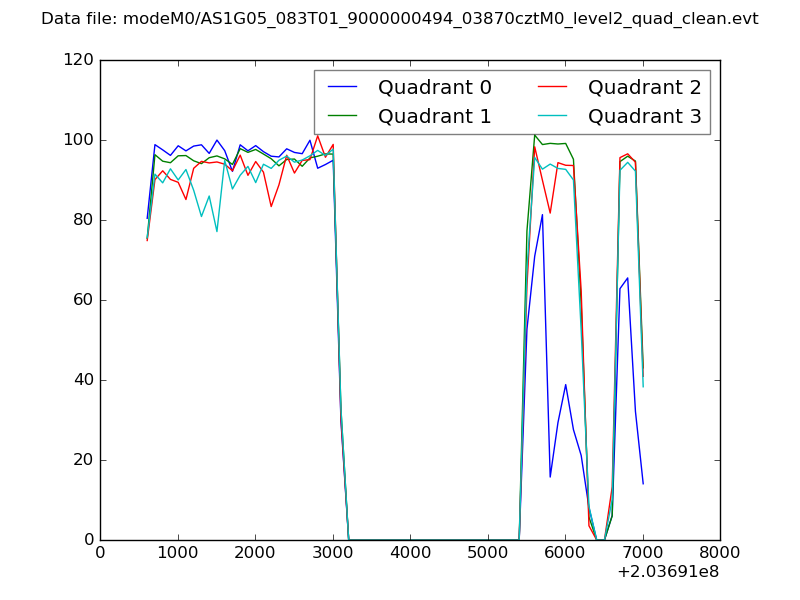 |
|
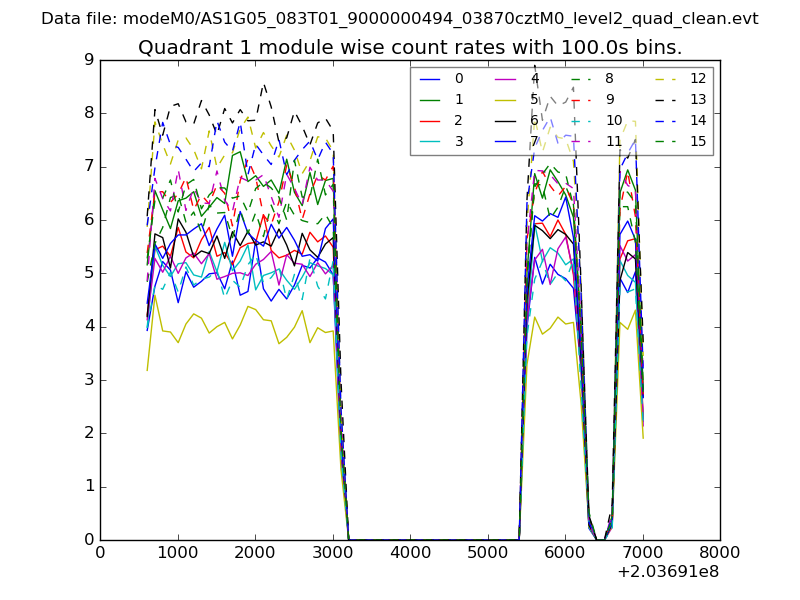
| Module-wise count rates for Quadrant A Data is divided into 100 sec bins |
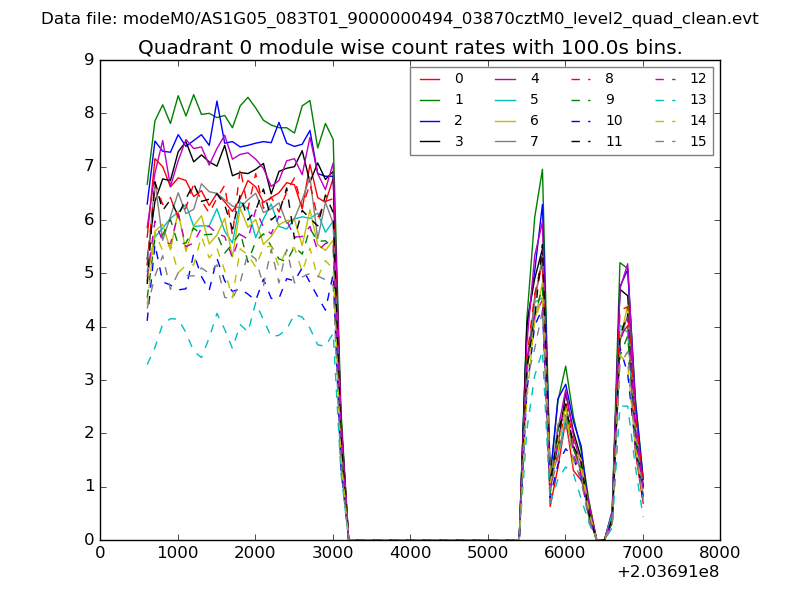 |
 |
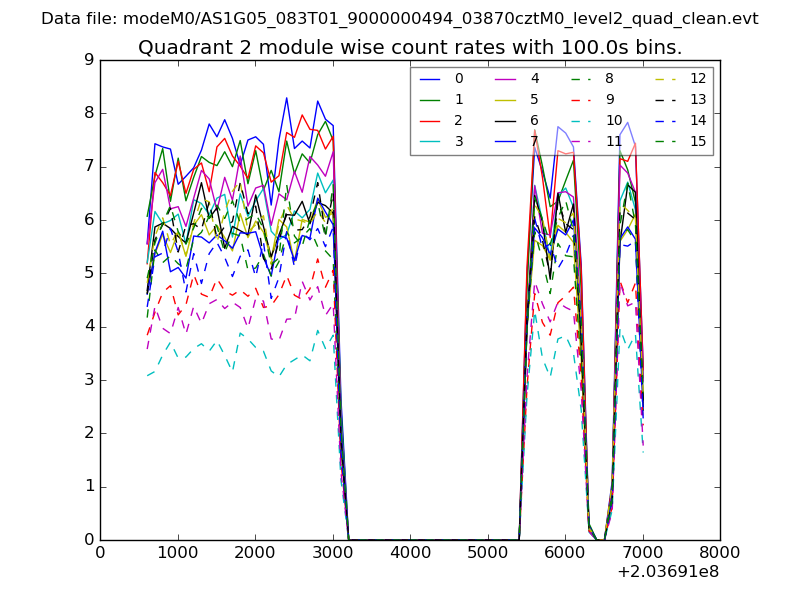
| Module-wise count rates for Quadrant B Data is divided into 100 sec bins |
 |
 |
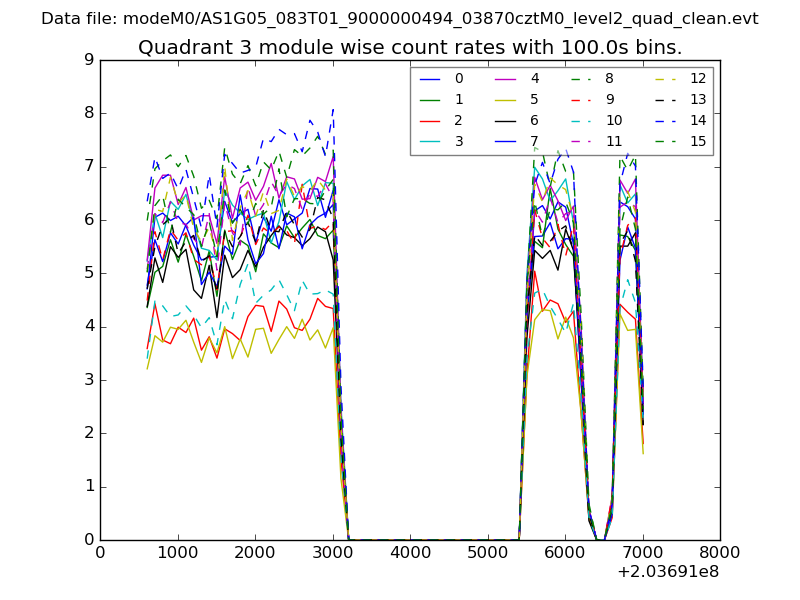
| Module-wise count rates for Quadrant C Data is divided into 100 sec bins |
 |
 |
| Module-wise count rates for Quadrant D Data is divided into 100 sec bins |
 |
 |
| Parameter | Plot |
|---|---|
| CZT HV Monitor | 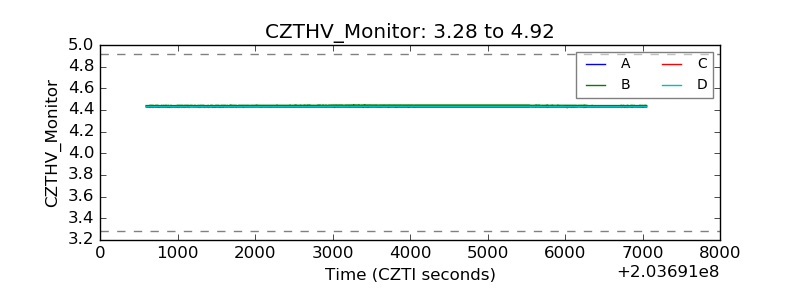 |
| D_VDD | 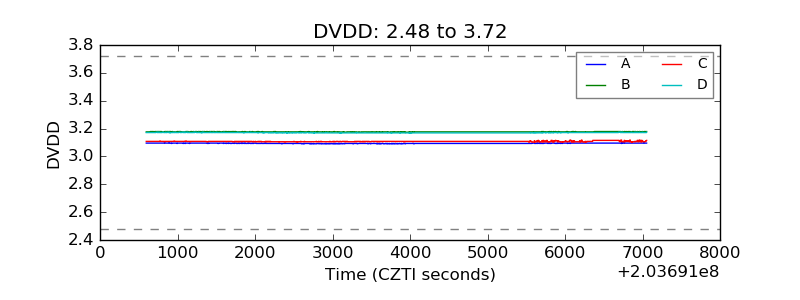 |
| Temperature 1 | 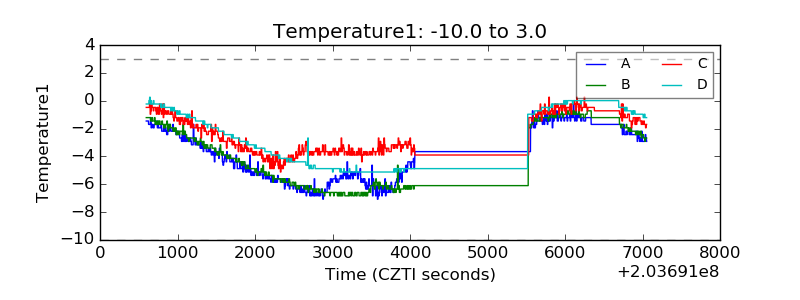 |
| Veto HV Monitor | 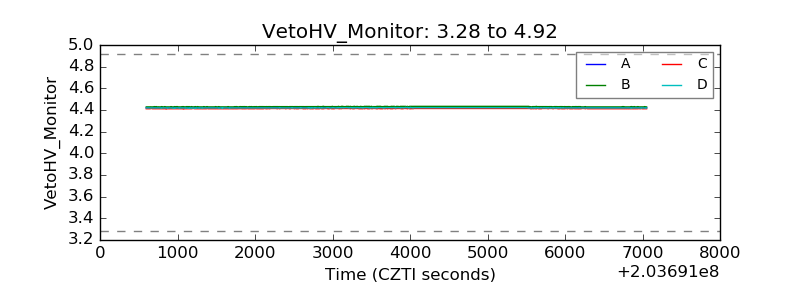 |
| Veto LLD | 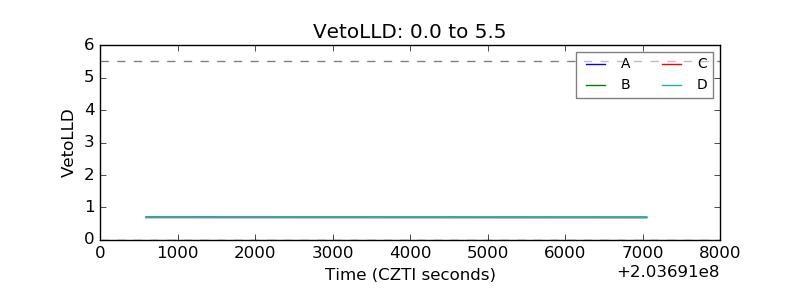 |
| Alpha Counter | 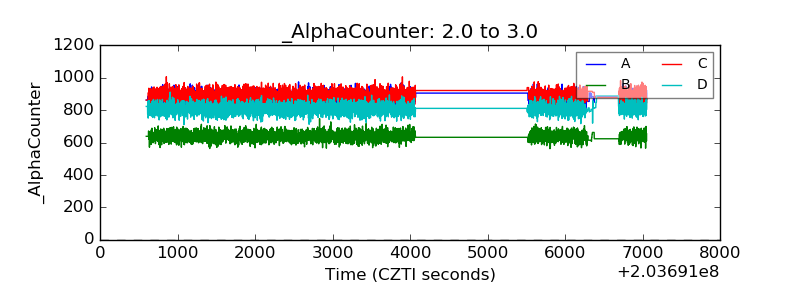 |
| _CPM_Rate | 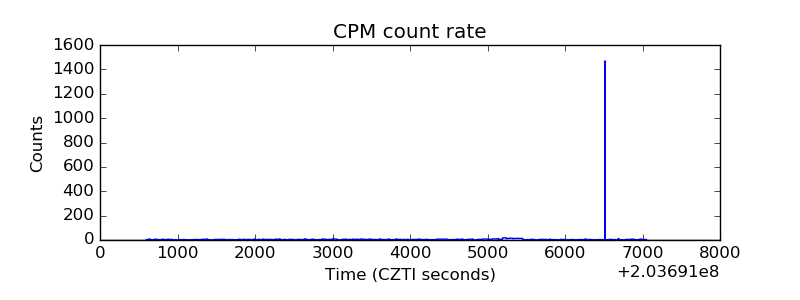 |
| CZT Counter | 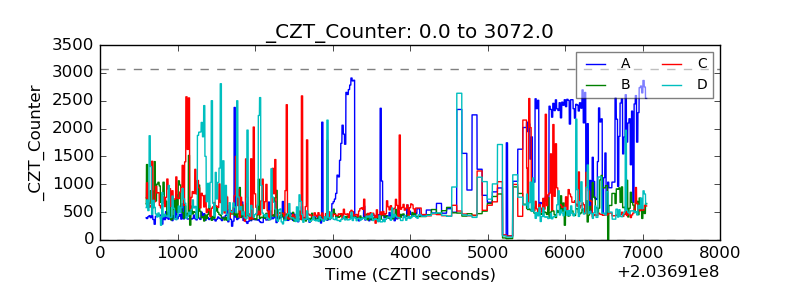 |
| +2.5 Volts monitor |  |
| +5 Volts monitor |  |
| Veto Counter | 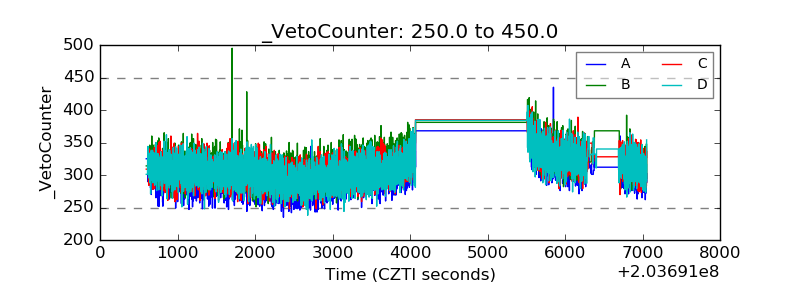 |