| Param | Original file | Final file |
|---|---|---|
| Filename | modeM0/AS1G05_083T01_9000000494_03873cztM0_level2.evt | modeM0/AS1G05_083T01_9000000494_03873cztM0_level2_quad_clean.evt |
| Size (bytes) | 1,615,322,880 | 232,102,080 |
| Size | 1.5 GB | 221.3 MB |
| Events in quadrant A | 14,366,500 | 1,387,668 |
| Events in quadrant B | 9,771,004 | 1,488,347 |
| Events in quadrant C | 12,769,969 | 1,453,015 |
| Events in quadrant D | 10,782,760 | 1,441,960 |
| Mode M0 | |||
|---|---|---|---|
| Quadrant | BADHDUFLAG | Total packets | Discarded packets |
| A | 0 | 55962 | 4 |
| B | 0 | 41797 | 3 |
| C | 0 | 50331 | 3 |
| D | 0 | 45505 | 3 |
| Mode M9 | |||
|---|---|---|---|
| Quadrant | BADHDUFLAG | Total packets | Discarded packets |
| A | 0 | 21 | 0 |
| B | 0 | 21 | 0 |
| C | 0 | 21 | 0 |
| D | 0 | 21 | 0 |
| Mode SS | |||
|---|---|---|---|
| Quadrant | BADHDUFLAG | Total packets | Discarded packets |
| A | 0 | 368 | 0 |
| B | 0 | 368 | 0 |
| C | 0 | 368 | 0 |
| D | 0 | 368 | 0 |
| Quadrant | Total seconds | Saturated seconds | Saturation percentage |
|---|---|---|---|
| A | 18255 | 2268 | 12.423993% |
| B | 18255 | 192 | 1.051767% |
| C | 18255 | 821 | 4.497398% |
| D | 18255 | 400 | 2.191180% |
Noise dominated data is calculated using 1-second bins in cleaned event files. If a bin has >2000 counts, and if more than 50% of those come from <1% of pixels, then it is considered to be noise-dominated and hence unusable.
| Quadrant | # 1 sec bins | Bins with >0 counts | Bins with >2000 counts | High rate bins dominated by noise | Noise dominated (total time) | Noise dominated (detector-on time) | Marked lightcurve |
|---|---|---|---|---|---|---|---|
| A | 20270 | 18257 | 1891 | 1891 | 9.33% | 10.36% | 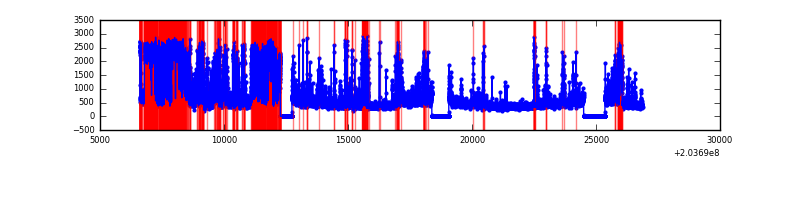 |
| B | 20270 | 18257 | 116 | 116 | 0.57% | 0.64% | 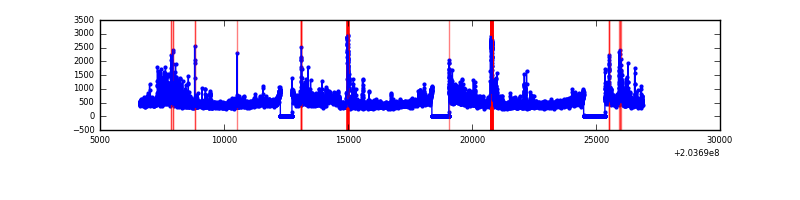 |
| C | 20270 | 18256 | 586 | 586 | 2.89% | 3.21% | 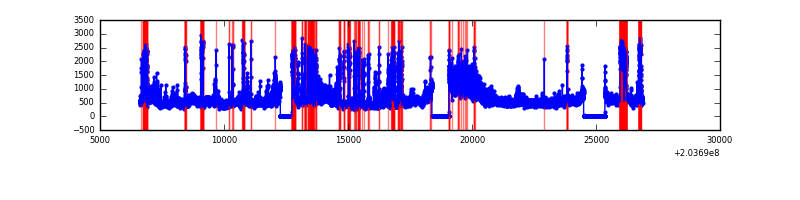 |
| D | 20270 | 18257 | 364 | 364 | 1.80% | 1.99% | 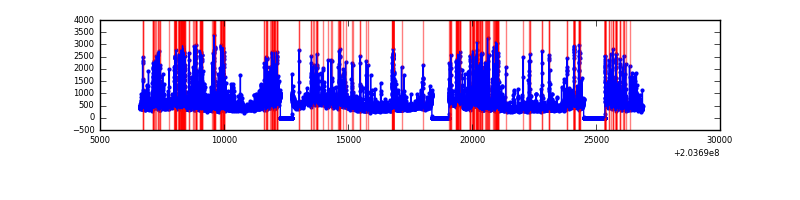 |
Top three noisy pixels from each quadrant. If the there are fewer than three noisy pixels in the level2.evt file, extra rows are filled as -1
| Pixel properties | Quadrant properties | ||||||
|---|---|---|---|---|---|---|---|
| Quadrant | DetID | PixID | Counts | Sigma | Mean | Median | Sigma |
| A | 0 | 199 | 4898933 | 12747.45 | 1871 | 1828 | 384.2 |
| A | 0 | 118 | 915571 | 2378.53 | 1871 | 1828 | 384.2 |
| A | 0 | 226 | 554019 | 1437.39 | 1871 | 1828 | 384.2 |
| B | 15 | 204 | 725863 | 1891.5 | 2009 | 1954 | 382.7 |
| B | 10 | 16 | 398276 | 1035.55 | 2009 | 1954 | 382.7 |
| B | 4 | 48 | 389650 | 1013.01 | 2009 | 1954 | 382.7 |
| C | 2 | 53 | 5159623 | 11659.02 | 1908 | 1915 | 442.4 |
| C | 8 | 128 | 27938 | 58.83 | 1908 | 1915 | 442.4 |
| C | 12 | 4 | 26781 | 56.21 | 1908 | 1915 | 442.4 |
| D | 14 | 34 | 1244942 | 2657.44 | 1931 | 1874 | 467.8 |
| D | 1 | 20 | 805432 | 1717.85 | 1931 | 1874 | 467.8 |
| D | 13 | 248 | 520559 | 1108.85 | 1931 | 1874 | 467.8 |
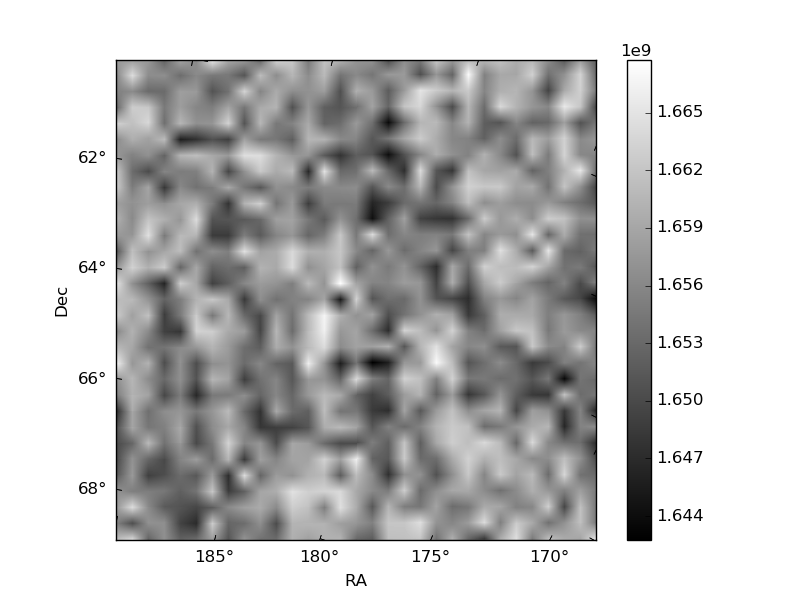
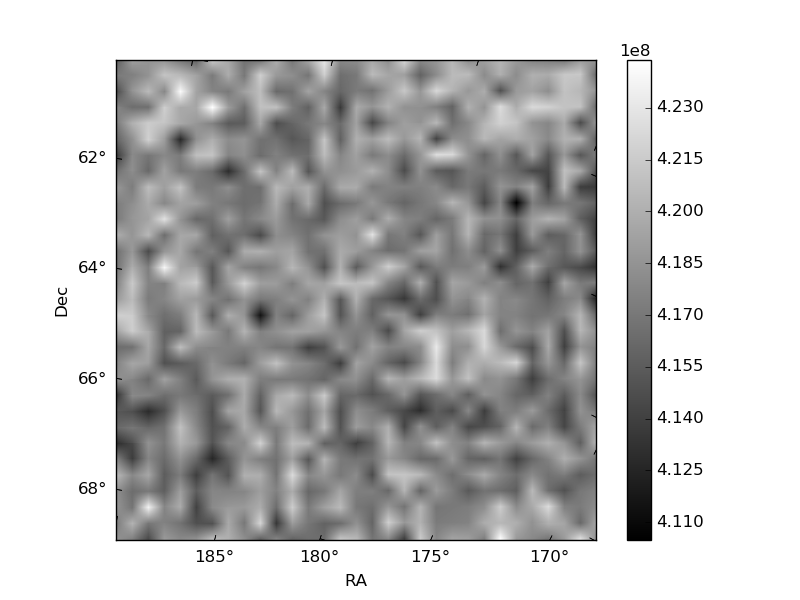
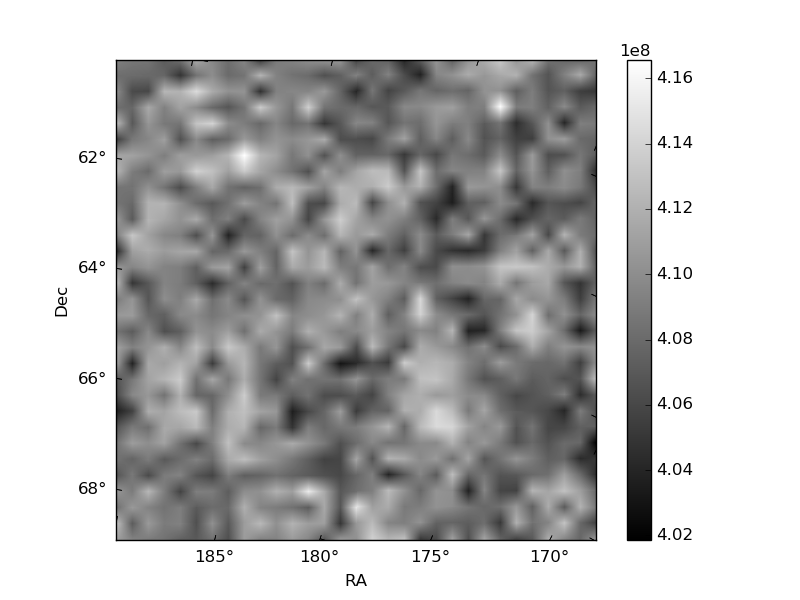
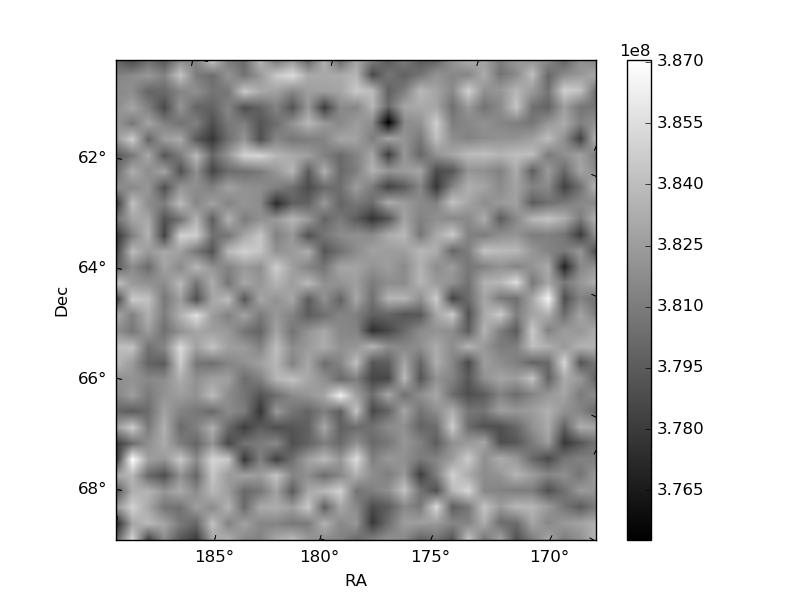
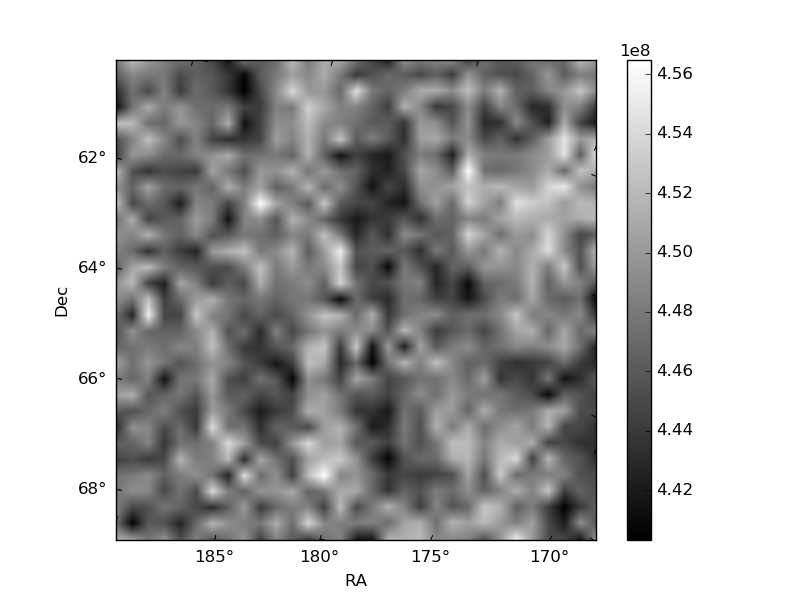
Histogram calculated using DETX and DETY for each event in the final _common_clean file
| Quadrant A | 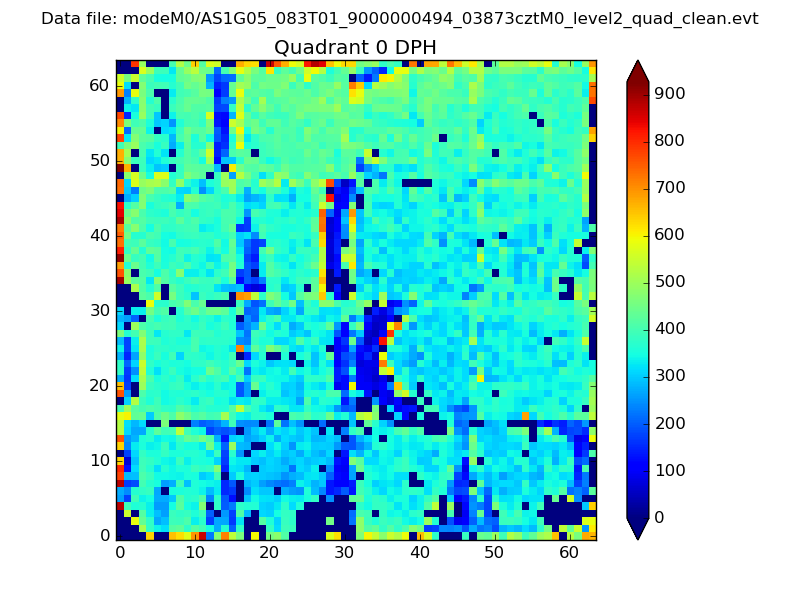 |
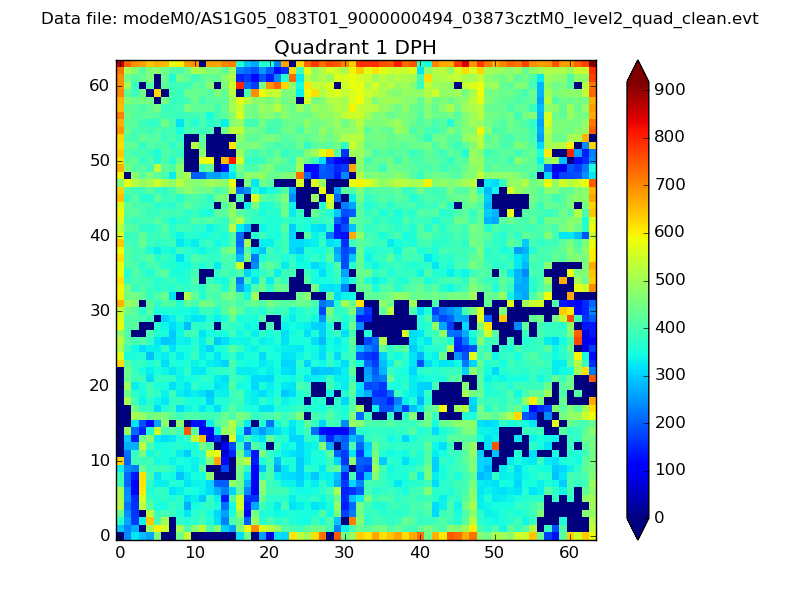 |
Quadrant B |
|---|---|---|---|
| Quadrant D | 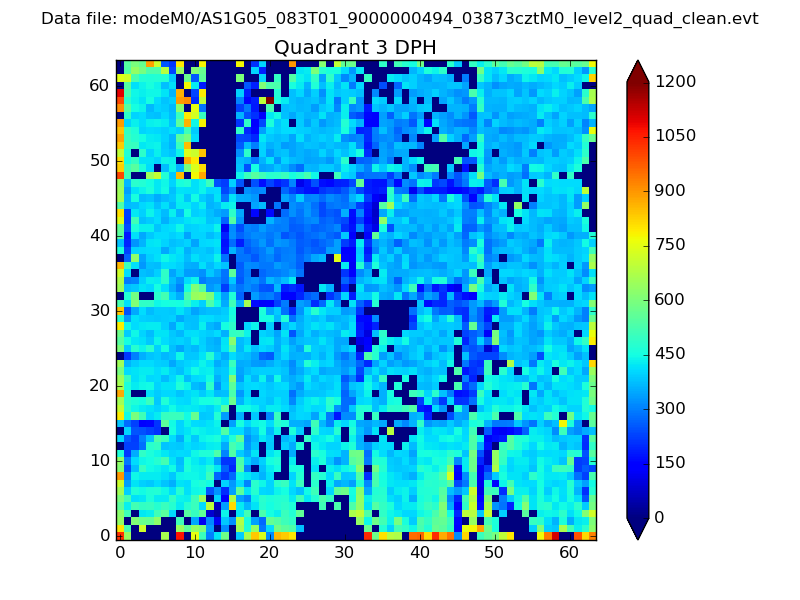 |
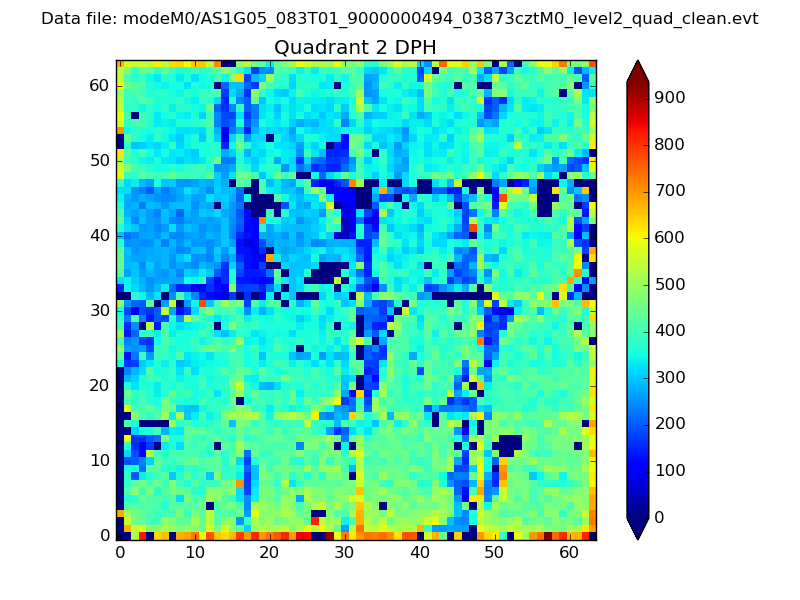 |
Quadrant C |
| Plot type | Count rate plots | Images |
|---|---|---|
| Comparison with Poisson distribution Blue bars denote a histogram of data divided into 1 sec bins. Red curve is a Poisson curve with rate = median count rate of data. |
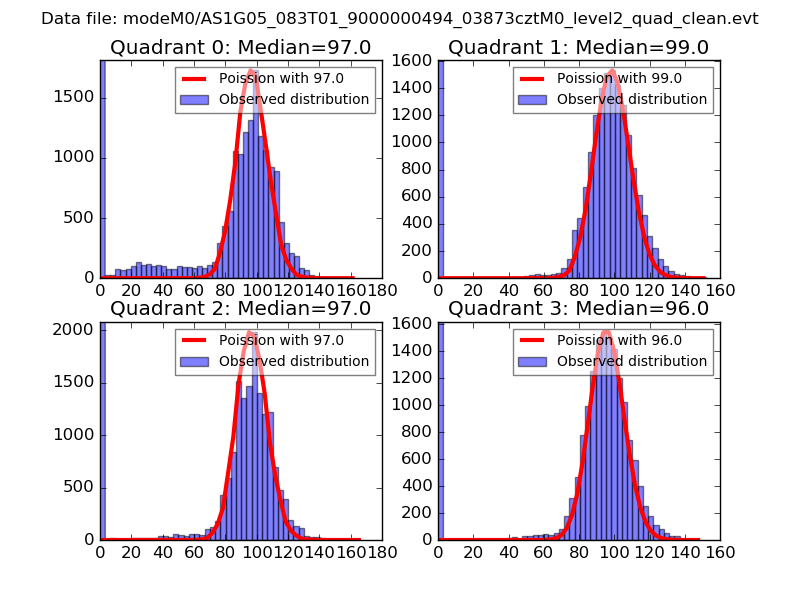 |
 |
| Quadrant-wise count rates Data is divided into 100 sec bins |
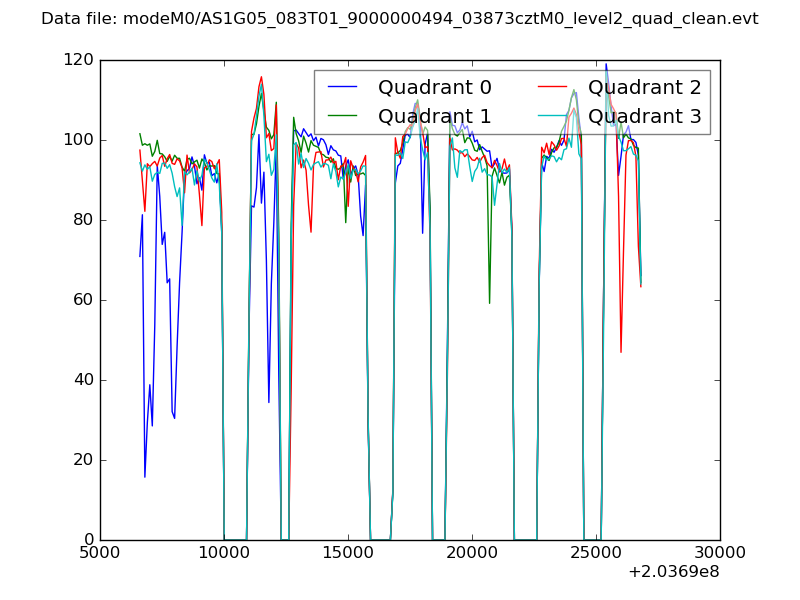 |
|
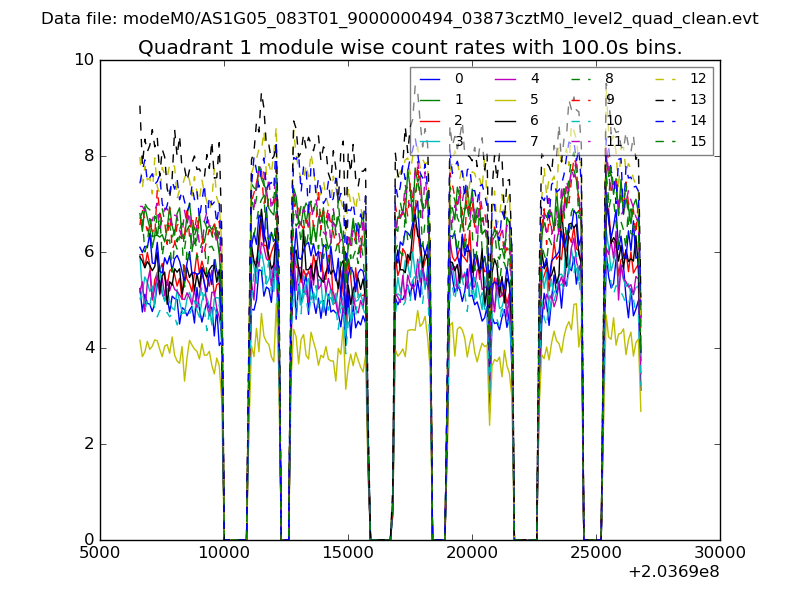
| Module-wise count rates for Quadrant A Data is divided into 100 sec bins |
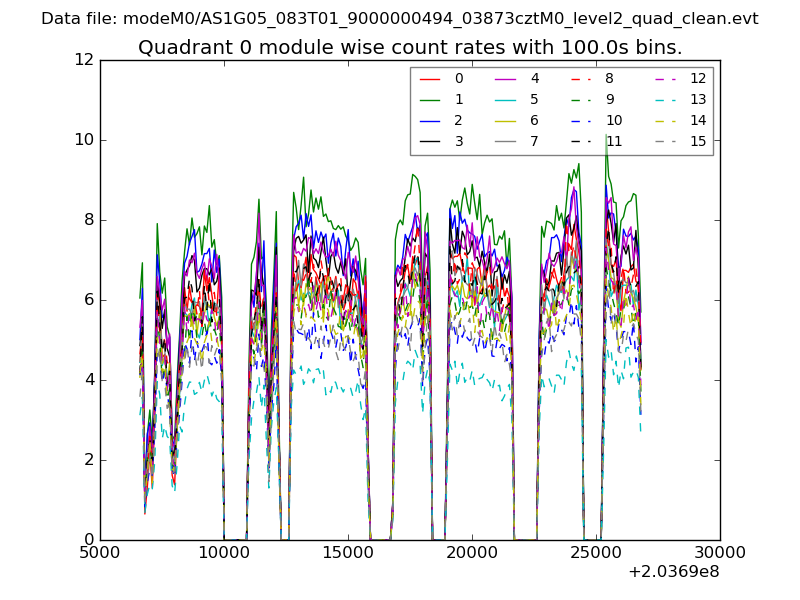 |
 |
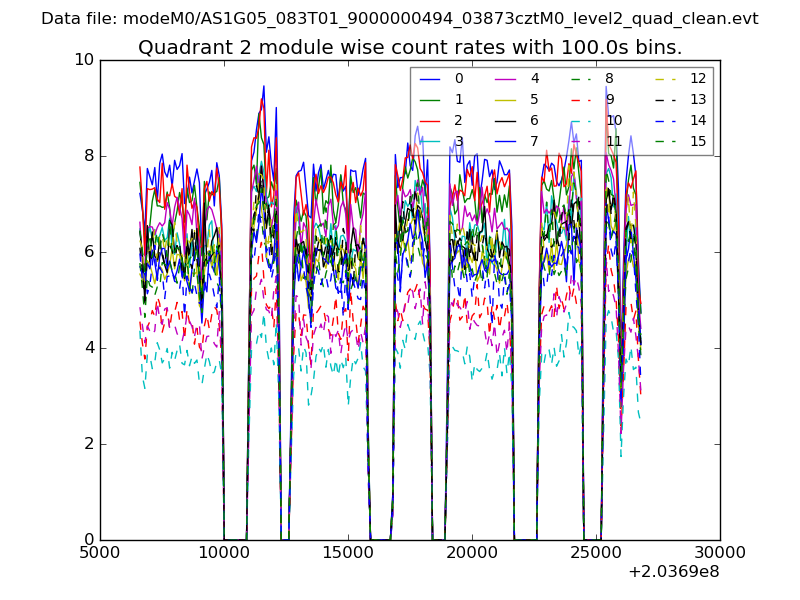
| Module-wise count rates for Quadrant B Data is divided into 100 sec bins |
 |
 |
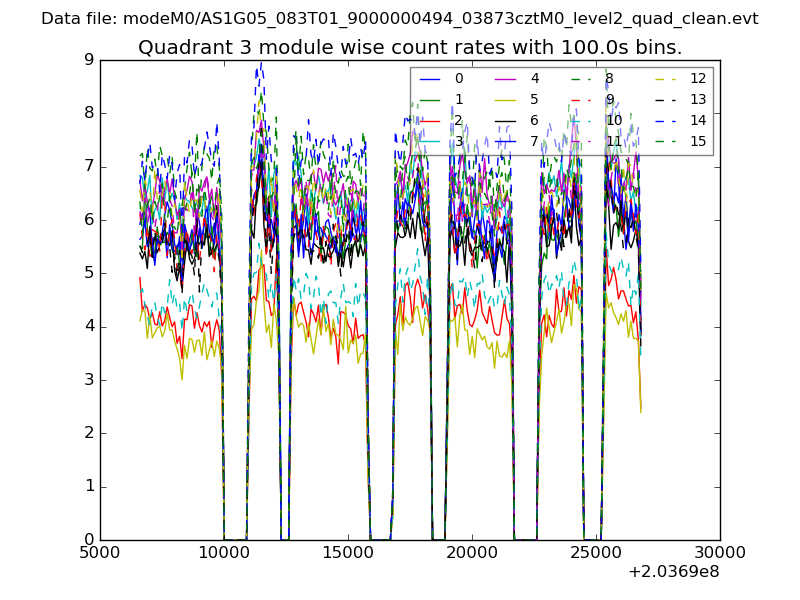
| Module-wise count rates for Quadrant C Data is divided into 100 sec bins |
 |
 |
| Module-wise count rates for Quadrant D Data is divided into 100 sec bins |
 |
 |
| Parameter | Plot |
|---|---|
| CZT HV Monitor | 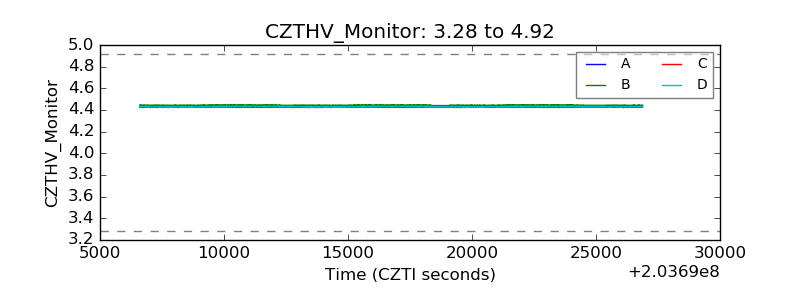 |
| D_VDD | 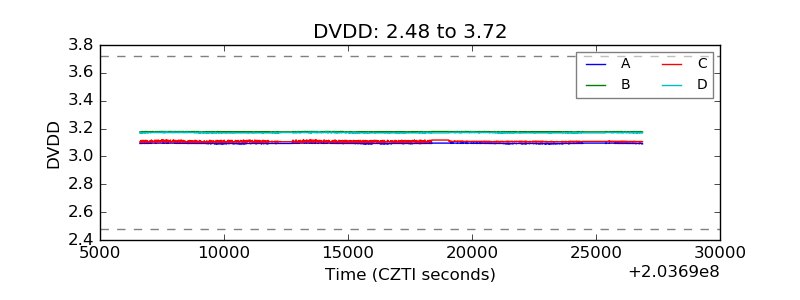 |
| Temperature 1 | 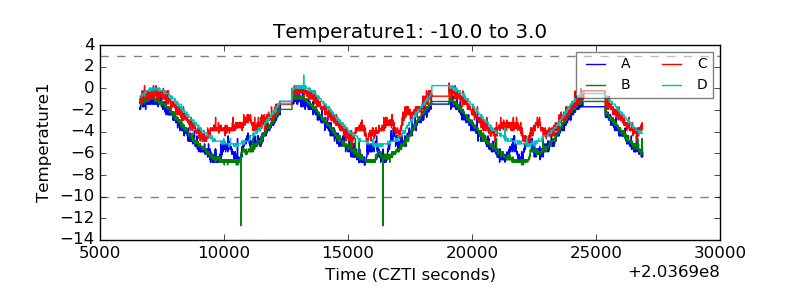 |
| Veto HV Monitor |  |
| Veto LLD | 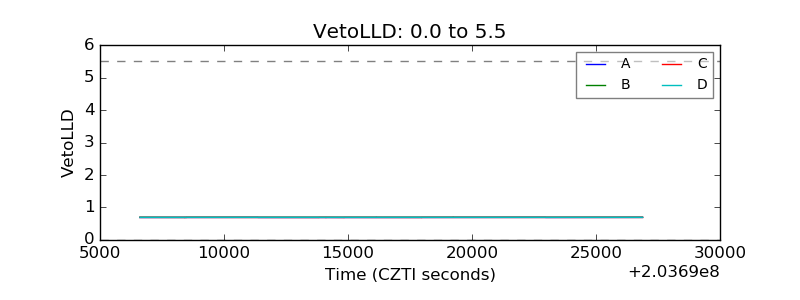 |
| Alpha Counter | 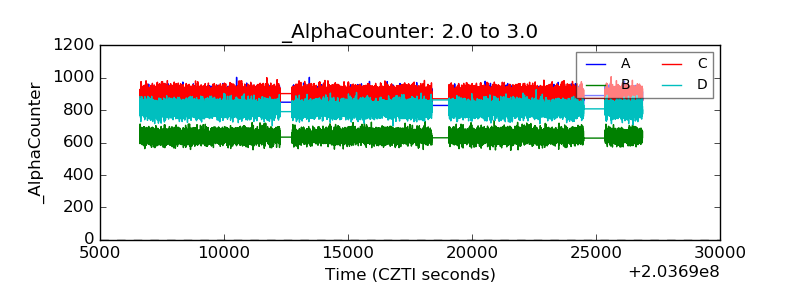 |
| _CPM_Rate | 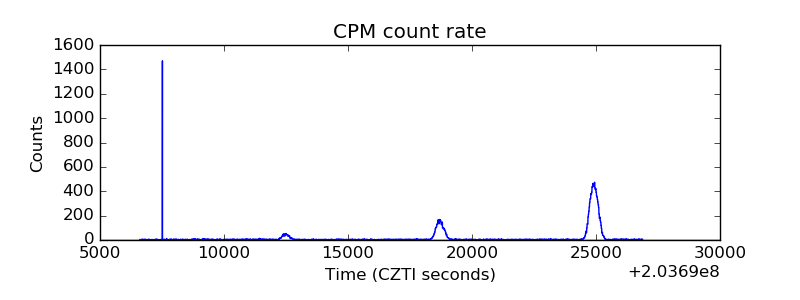 |
| CZT Counter | 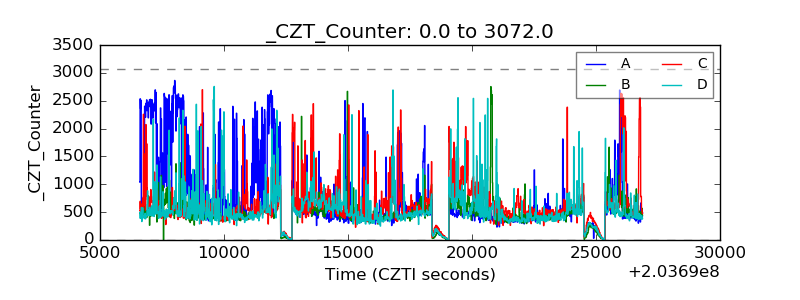 |
| +2.5 Volts monitor |  |
| +5 Volts monitor |  |
| Veto Counter | 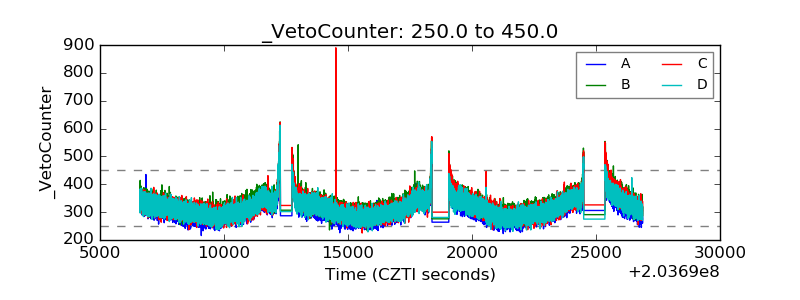 |