| Param | Original file | Final file |
|---|---|---|
| Filename | modeM0/AS1G05_083T01_9000000494_03874cztM0_level2.evt | modeM0/AS1G05_083T01_9000000494_03874cztM0_level2_quad_clean.evt |
| Size (bytes) | 556,718,400 | 89,516,160 |
| Size | 530.9 MB | 85.4 MB |
| Events in quadrant A | 3,477,512 | 580,582 |
| Events in quadrant B | 3,647,501 | 577,138 |
| Events in quadrant C | 5,640,909 | 531,565 |
| Events in quadrant D | 3,643,410 | 557,538 |
| Mode M0 | |||
|---|---|---|---|
| Quadrant | BADHDUFLAG | Total packets | Discarded packets |
| A | 0 | 15211 | 3 |
| B | 0 | 15733 | 2 |
| C | 0 | 21567 | 2 |
| D | 0 | 15925 | 2 |
| Mode M9 | |||
|---|---|---|---|
| Quadrant | BADHDUFLAG | Total packets | Discarded packets |
| A | 0 | 13 | 0 |
| B | 0 | 13 | 0 |
| C | 0 | 13 | 0 |
| D | 0 | 14 | 0 |
| Mode SS | |||
|---|---|---|---|
| Quadrant | BADHDUFLAG | Total packets | Discarded packets |
| A | 0 | 136 | 0 |
| B | 0 | 136 | 0 |
| C | 0 | 136 | 0 |
| D | 0 | 136 | 0 |
| Quadrant | Total seconds | Saturated seconds | Saturation percentage |
|---|---|---|---|
| A | 6646 | 99 | 1.489618% |
| B | 6646 | 75 | 1.128498% |
| C | 6646 | 828 | 12.458622% |
| D | 6646 | 170 | 2.557930% |
Noise dominated data is calculated using 1-second bins in cleaned event files. If a bin has >2000 counts, and if more than 50% of those come from <1% of pixels, then it is considered to be noise-dominated and hence unusable.
| Quadrant | # 1 sec bins | Bins with >0 counts | Bins with >2000 counts | High rate bins dominated by noise | Noise dominated (total time) | Noise dominated (detector-on time) | Marked lightcurve |
|---|---|---|---|---|---|---|---|
| A | 7681 | 6647 | 59 | 59 | 0.77% | 0.89% | 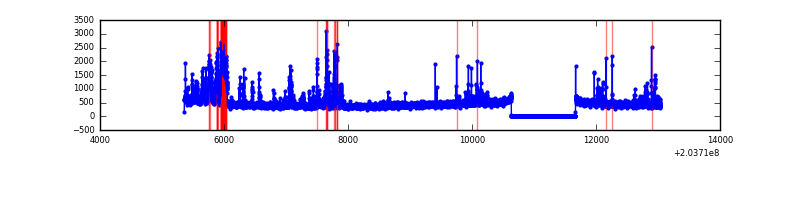 |
| B | 7681 | 6647 | 33 | 33 | 0.43% | 0.50% | 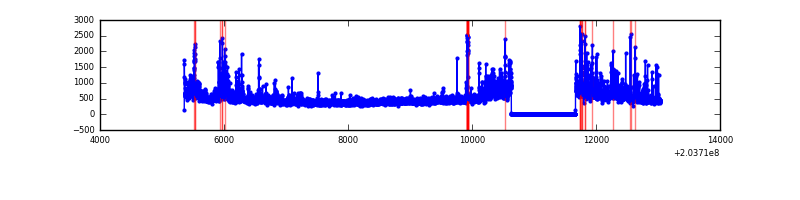 |
| C | 7681 | 6647 | 774 | 774 | 10.08% | 11.64% | 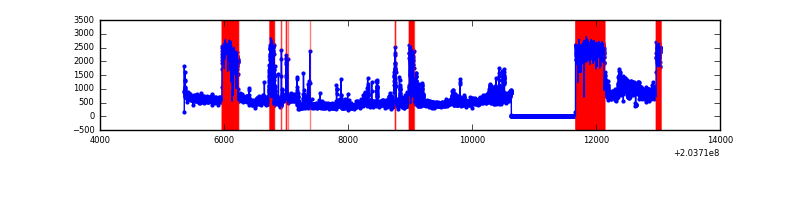 |
| D | 7681 | 6647 | 145 | 145 | 1.89% | 2.18% | 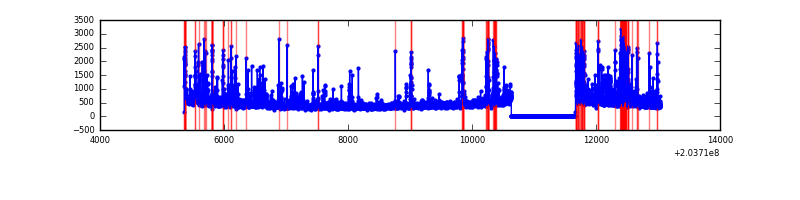 |
Top three noisy pixels from each quadrant. If the there are fewer than three noisy pixels in the level2.evt file, extra rows are filled as -1
| Pixel properties | Quadrant properties | ||||||
|---|---|---|---|---|---|---|---|
| Quadrant | DetID | PixID | Counts | Sigma | Mean | Median | Sigma |
| A | 0 | 118 | 502633 | 3370.77 | 724 | 707 | 148.9 |
| A | 13 | 251 | 113710 | 758.89 | 724 | 707 | 148.9 |
| A | 0 | 226 | 52842 | 350.12 | 724 | 707 | 148.9 |
| B | 15 | 204 | 323618 | 2277.19 | 736 | 717 | 141.8 |
| B | 4 | 48 | 292403 | 2057.06 | 736 | 717 | 141.8 |
| B | 14 | 167 | 148695 | 1043.59 | 736 | 717 | 141.8 |
| C | 2 | 53 | 2997060 | 19098.52 | 672 | 674 | 156.9 |
| C | 13 | 61 | 5692 | 31.98 | 672 | 674 | 156.9 |
| C | 1 | 16 | 5009 | 27.63 | 672 | 674 | 156.9 |
| D | 14 | 34 | 464894 | 2714.93 | 703 | 681 | 171.0 |
| D | 13 | 248 | 283071 | 1651.55 | 703 | 681 | 171.0 |
| D | 13 | 137 | 48719 | 280.95 | 703 | 681 | 171.0 |
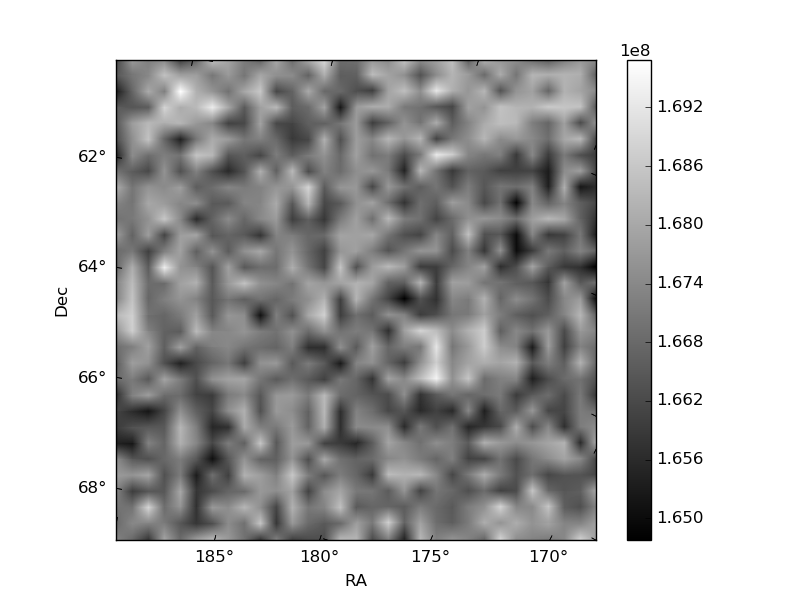
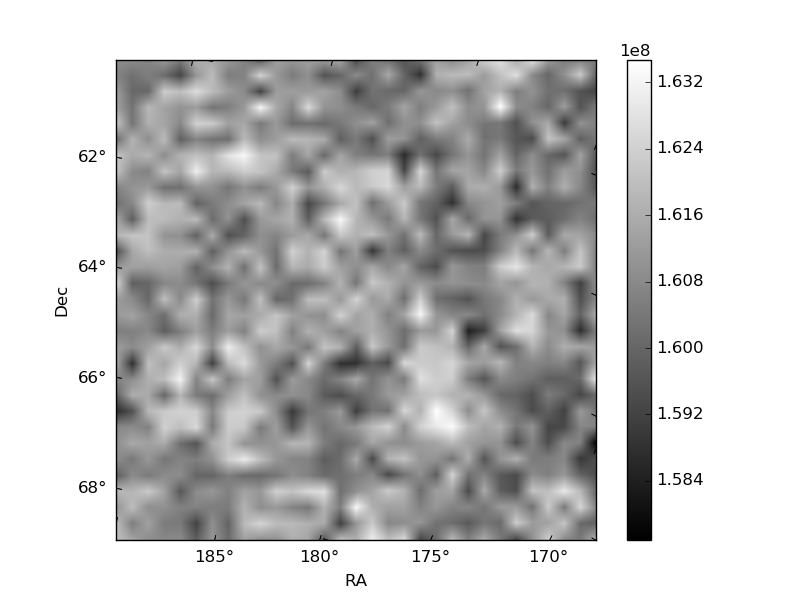
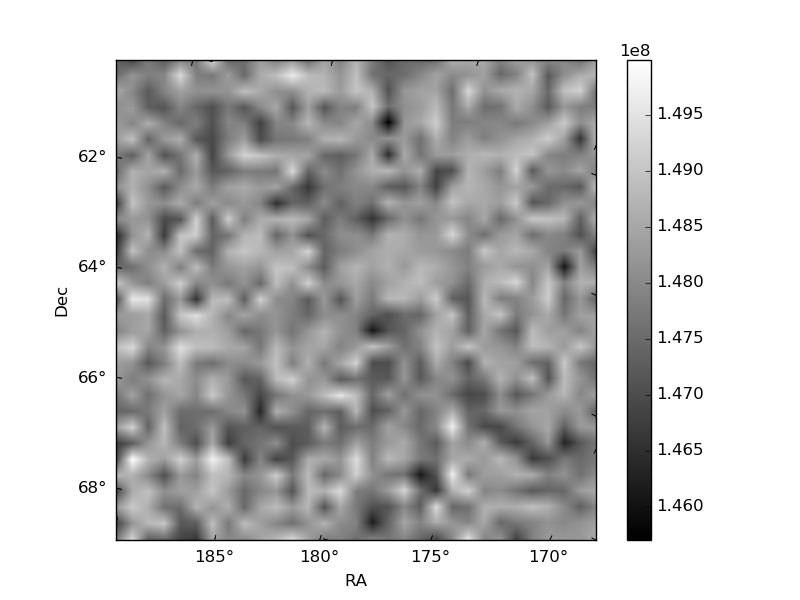
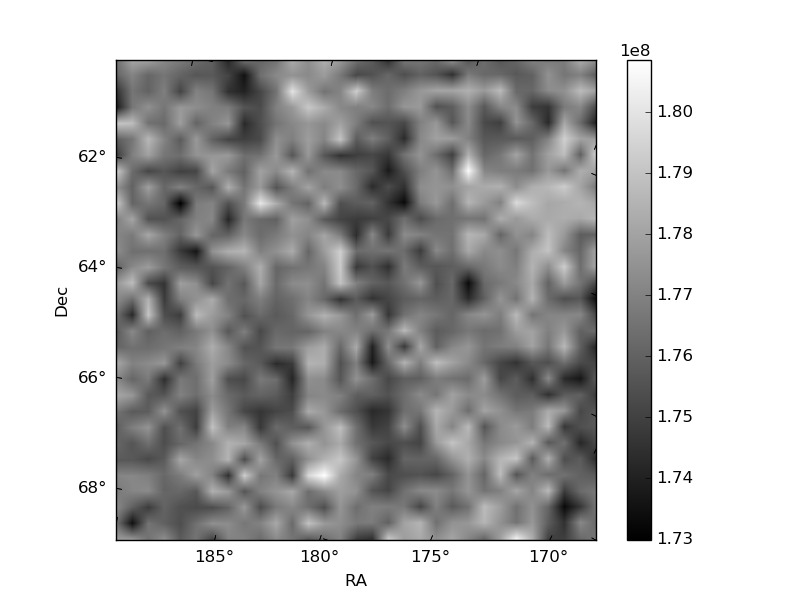
Histogram calculated using DETX and DETY for each event in the final _common_clean file
| Quadrant A | 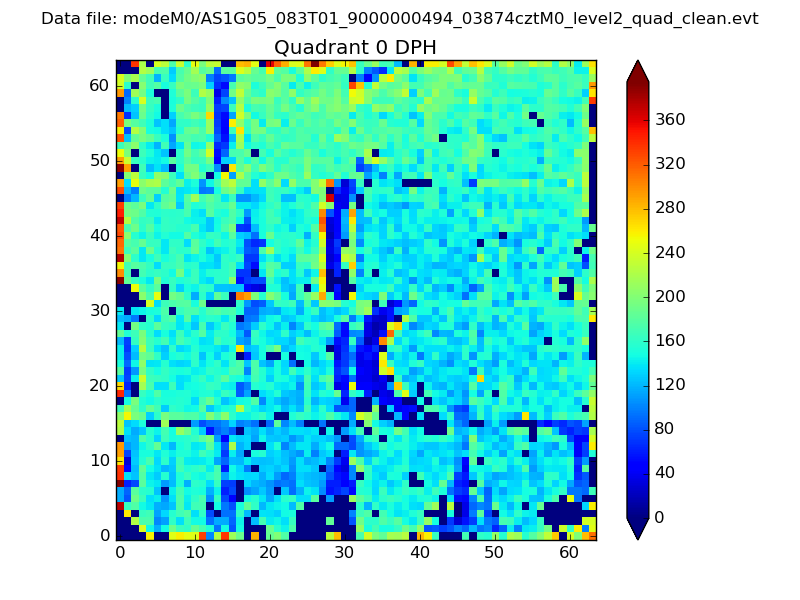 |
 |
Quadrant B |
|---|---|---|---|
| Quadrant D |  |
 |
Quadrant C |
| Plot type | Count rate plots | Images |
|---|---|---|
| Comparison with Poisson distribution Blue bars denote a histogram of data divided into 1 sec bins. Red curve is a Poisson curve with rate = median count rate of data. |
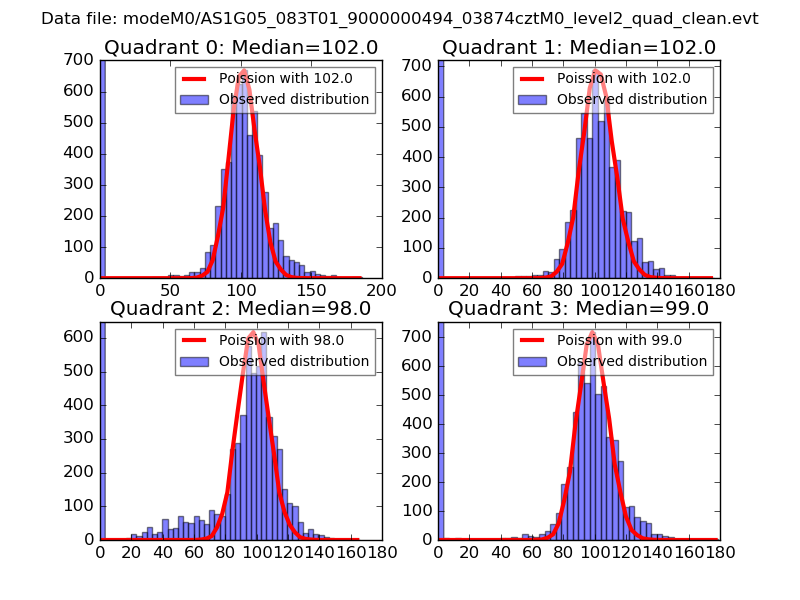 |
 |
| Quadrant-wise count rates Data is divided into 100 sec bins |
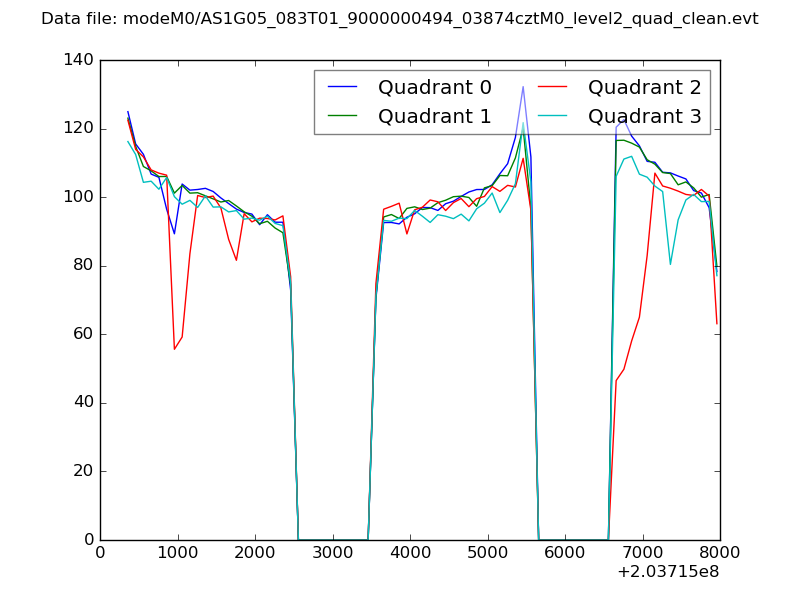 |
|
| Module-wise count rates for Quadrant A Data is divided into 100 sec bins |
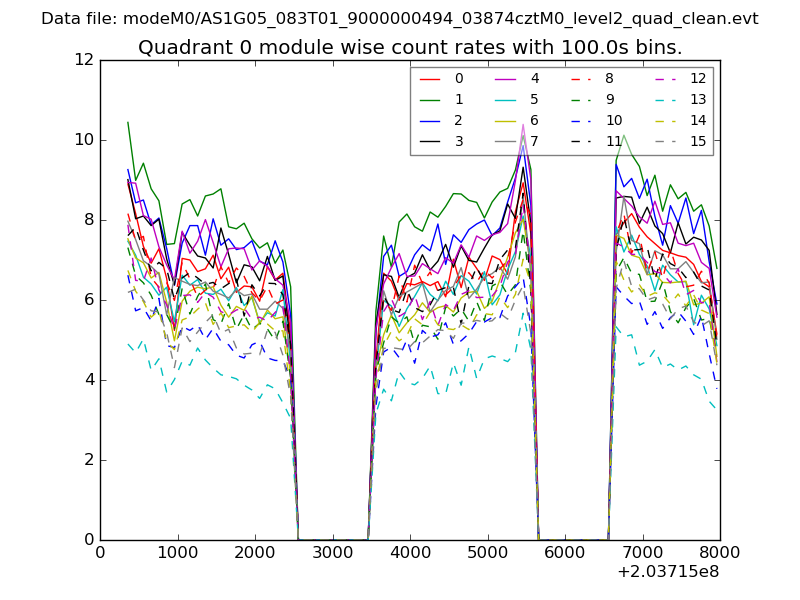 |
 |
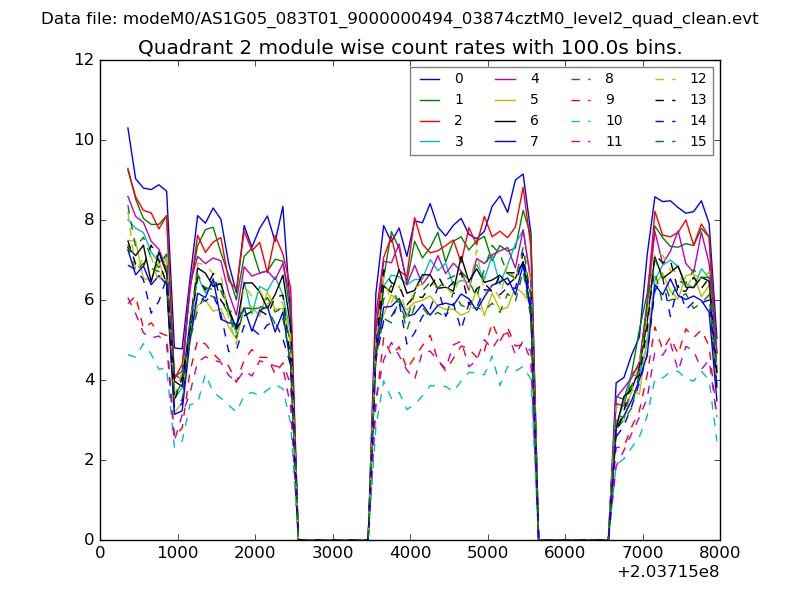
| Module-wise count rates for Quadrant B Data is divided into 100 sec bins |
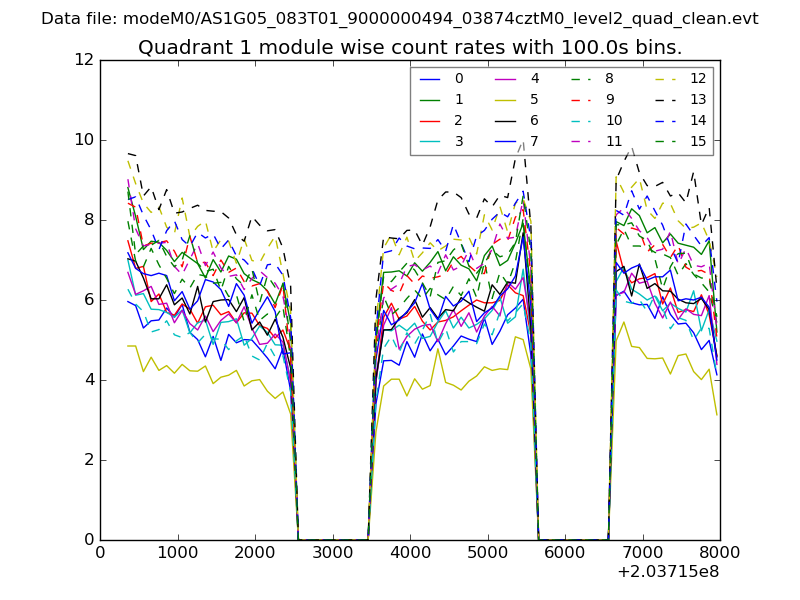 |
 |
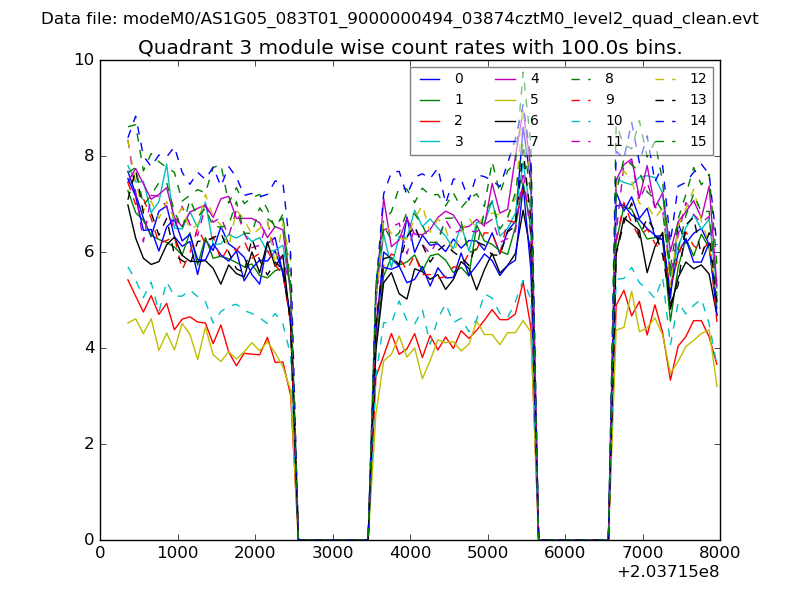
| Module-wise count rates for Quadrant C Data is divided into 100 sec bins |
 |
 |
| Module-wise count rates for Quadrant D Data is divided into 100 sec bins |
 |
 |
| Parameter | Plot |
|---|---|
| CZT HV Monitor | 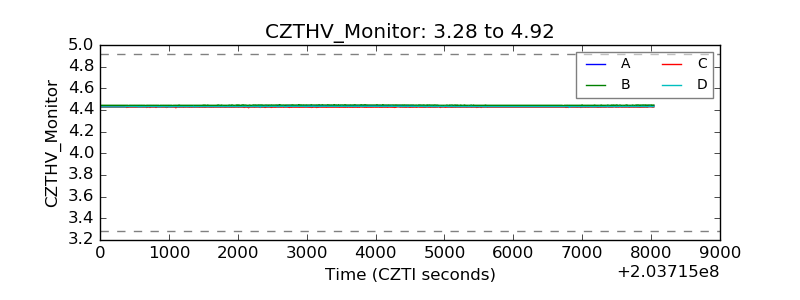 |
| D_VDD | 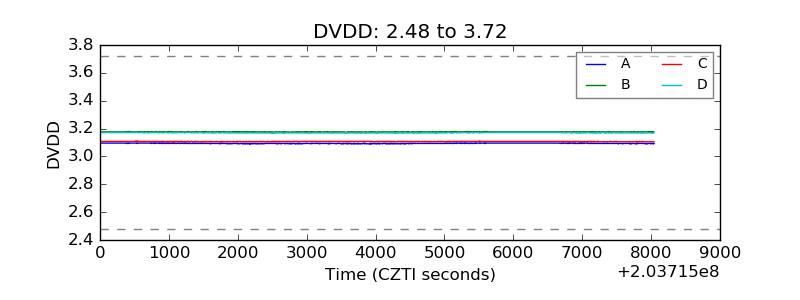 |
| Temperature 1 | 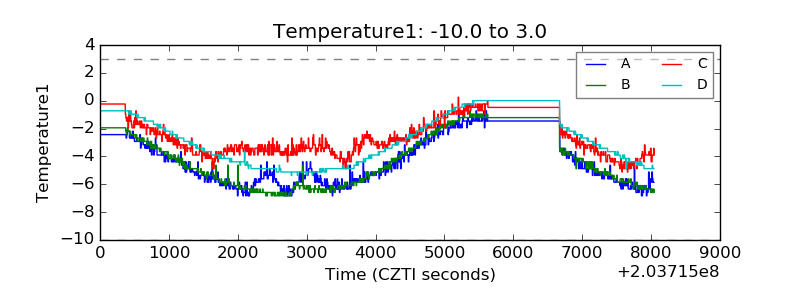 |
| Veto HV Monitor | 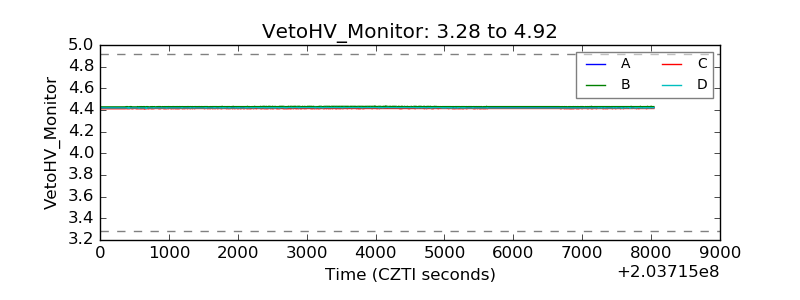 |
| Veto LLD | 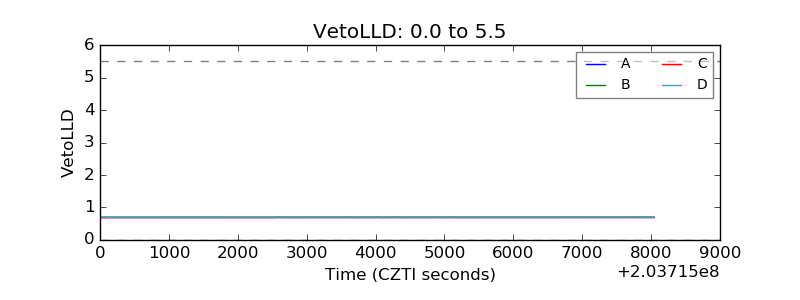 |
| Alpha Counter | 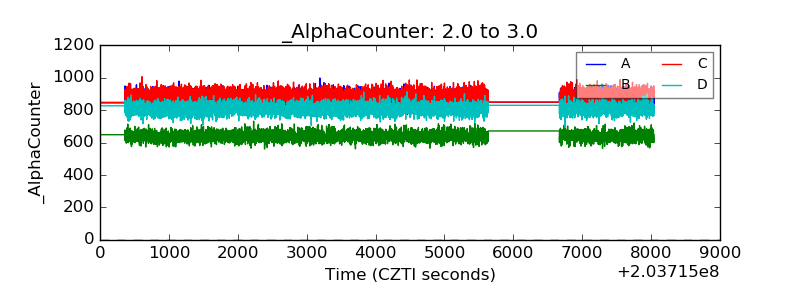 |
| _CPM_Rate | 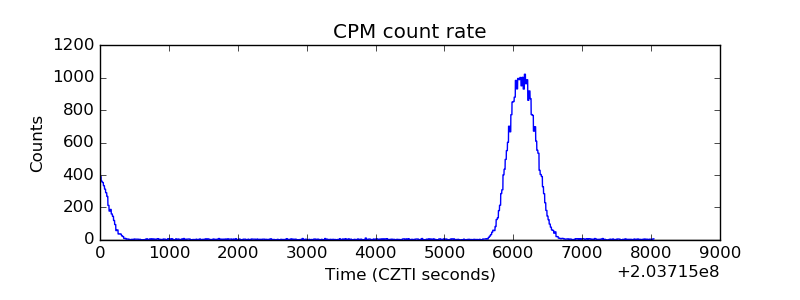 |
| CZT Counter | 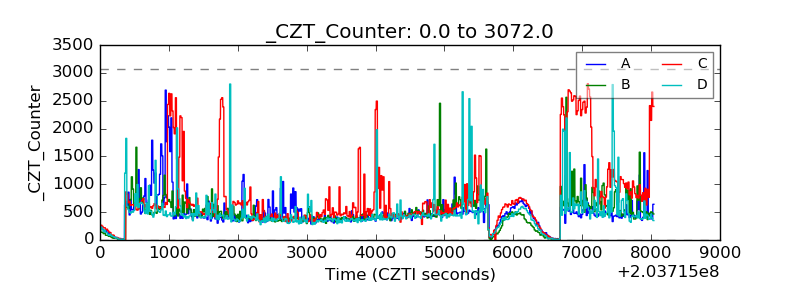 |
| +2.5 Volts monitor |  |
| +5 Volts monitor |  |
| Veto Counter | 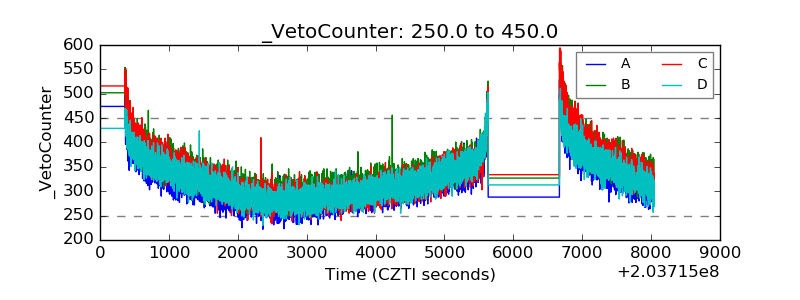 |