| Param | Original file | Final file |
|---|---|---|
| Filename | modeM0/AS1G05_083T01_9000000494_03877cztM0_level2.evt | modeM0/AS1G05_083T01_9000000494_03877cztM0_level2_quad_clean.evt |
| Size (bytes) | 709,130,880 | 83,986,560 |
| Size | 676.3 MB | 80.1 MB |
| Events in quadrant A | 3,588,899 | 562,596 |
| Events in quadrant B | 3,532,158 | 571,710 |
| Events in quadrant C | 10,599,691 | 395,843 |
| Events in quadrant D | 3,297,826 | 540,967 |
| Mode M0 | |||
|---|---|---|---|
| Quadrant | BADHDUFLAG | Total packets | Discarded packets |
| A | 0 | 15519 | 3 |
| B | 0 | 15265 | 2 |
| C | 0 | 36197 | 2 |
| D | 0 | 14915 | 2 |
| Mode M9 | |||
|---|---|---|---|
| Quadrant | BADHDUFLAG | Total packets | Discarded packets |
| A | 0 | 24 | 0 |
| B | 0 | 24 | 0 |
| C | 0 | 24 | 0 |
| D | 0 | 24 | 0 |
| Mode SS | |||
|---|---|---|---|
| Quadrant | BADHDUFLAG | Total packets | Discarded packets |
| A | 0 | 138 | 0 |
| B | 0 | 138 | 0 |
| C | 0 | 138 | 0 |
| D | 0 | 138 | 0 |
| Quadrant | Total seconds | Saturated seconds | Saturation percentage |
|---|---|---|---|
| A | 6757 | 140 | 2.071925% |
| B | 6757 | 68 | 1.006364% |
| C | 6757 | 3265 | 48.320260% |
| D | 6757 | 56 | 0.828770% |
Noise dominated data is calculated using 1-second bins in cleaned event files. If a bin has >2000 counts, and if more than 50% of those come from <1% of pixels, then it is considered to be noise-dominated and hence unusable.
| Quadrant | # 1 sec bins | Bins with >0 counts | Bins with >2000 counts | High rate bins dominated by noise | Noise dominated (total time) | Noise dominated (detector-on time) | Marked lightcurve |
|---|---|---|---|---|---|---|---|
| A | 9162 | 6757 | 88 | 88 | 0.96% | 1.30% |  |
| B | 9162 | 6757 | 11 | 11 | 0.12% | 0.16% |  |
| C | 9162 | 6757 | 3343 | 3343 | 36.49% | 49.47% | 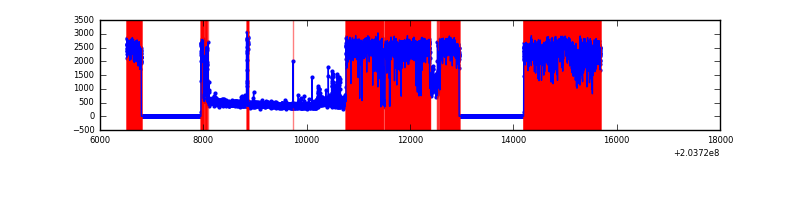 |
| D | 9162 | 6759 | 43 | 43 | 0.47% | 0.64% | 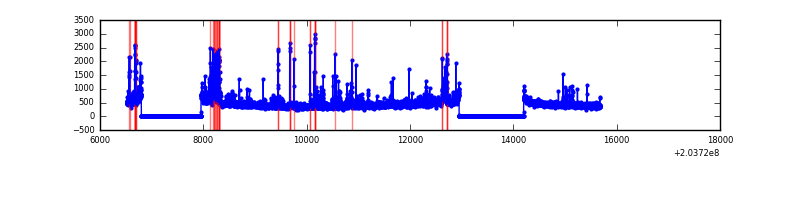 |
Top three noisy pixels from each quadrant. If the there are fewer than three noisy pixels in the level2.evt file, extra rows are filled as -1
| Pixel properties | Quadrant properties | ||||||
|---|---|---|---|---|---|---|---|
| Quadrant | DetID | PixID | Counts | Sigma | Mean | Median | Sigma |
| A | 0 | 118 | 520417 | 3345.69 | 761 | 743 | 155.3 |
| A | 0 | 226 | 55030 | 349.5 | 761 | 743 | 155.3 |
| A | 15 | 234 | 38066 | 240.29 | 761 | 743 | 155.3 |
| B | 15 | 204 | 362213 | 2453.15 | 780 | 763 | 147.3 |
| B | 4 | 48 | 66073 | 443.26 | 780 | 763 | 147.3 |
| B | 15 | 54 | 22952 | 150.6 | 780 | 763 | 147.3 |
| C | 2 | 53 | 8234933 | 60432.36 | 592 | 595 | 136.3 |
| C | 1 | 16 | 29233 | 210.18 | 592 | 595 | 136.3 |
| C | 10 | 65 | 14566 | 102.53 | 592 | 595 | 136.3 |
| D | 1 | 20 | 168374 | 952.03 | 739 | 717 | 176.1 |
| D | 13 | 248 | 137850 | 778.7 | 739 | 717 | 176.1 |
| D | 13 | 239 | 56063 | 314.28 | 739 | 717 | 176.1 |
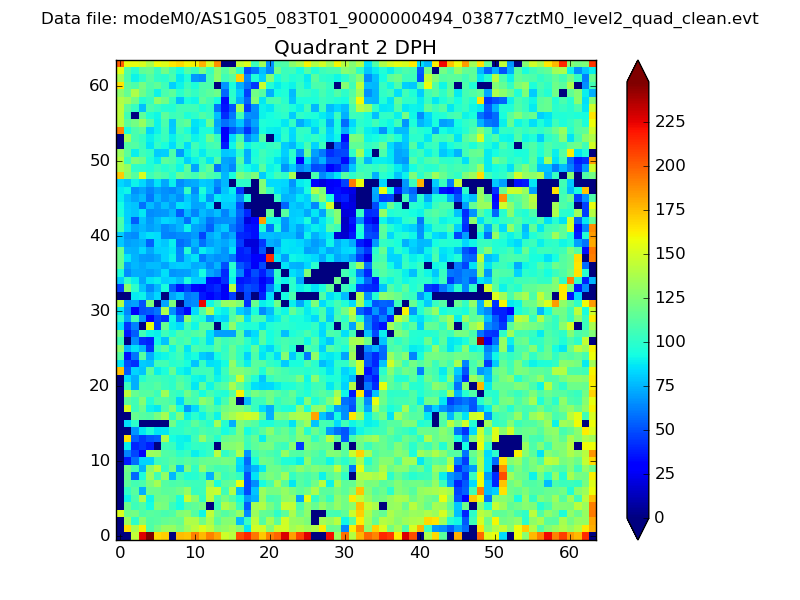
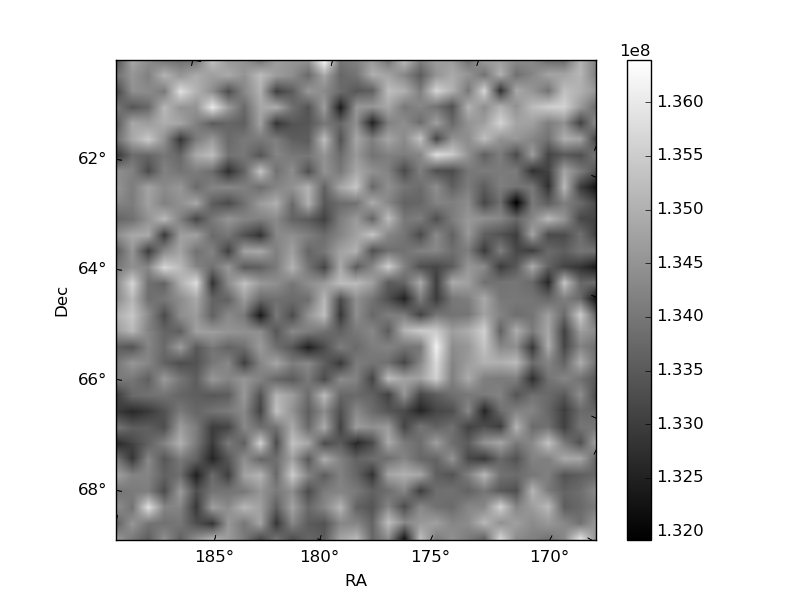
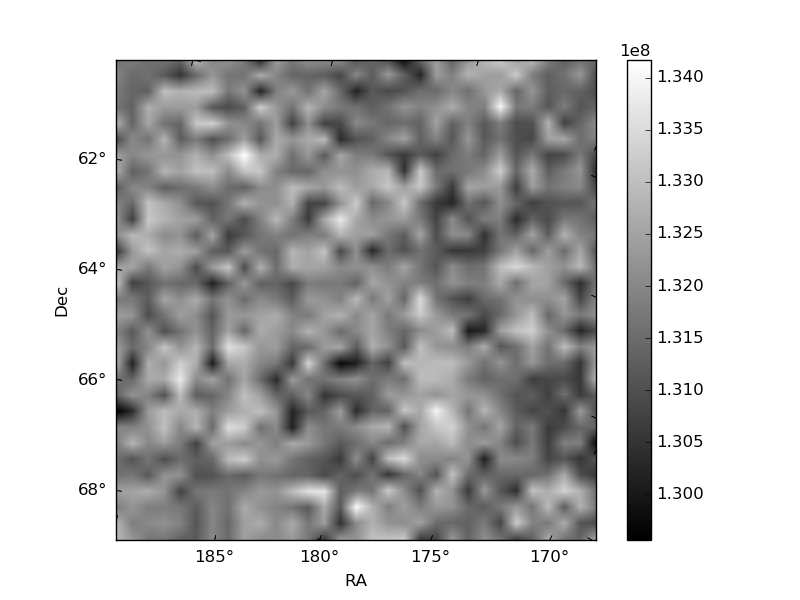
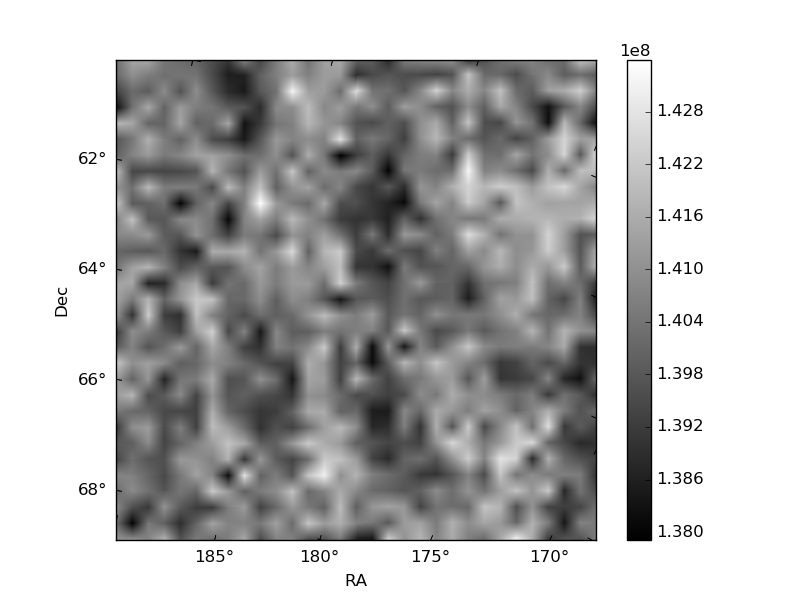
Histogram calculated using DETX and DETY for each event in the final _common_clean file
| Quadrant A | 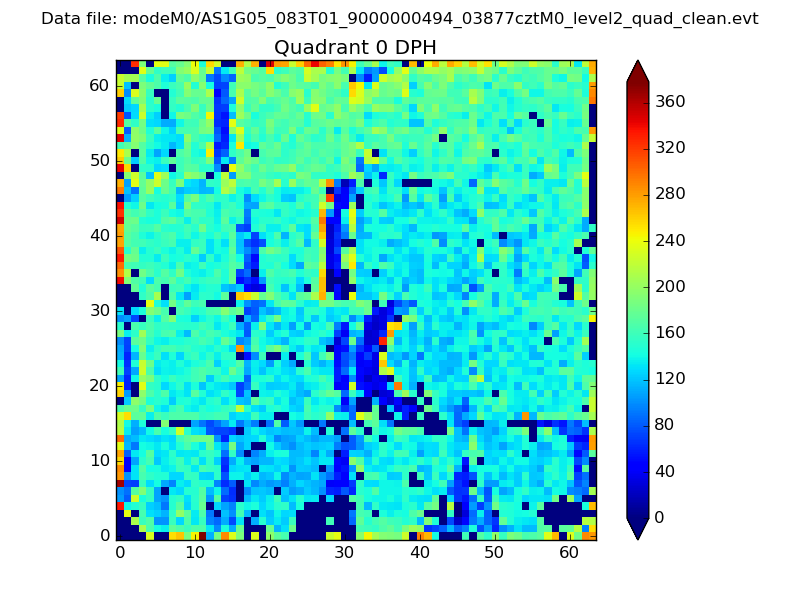 |
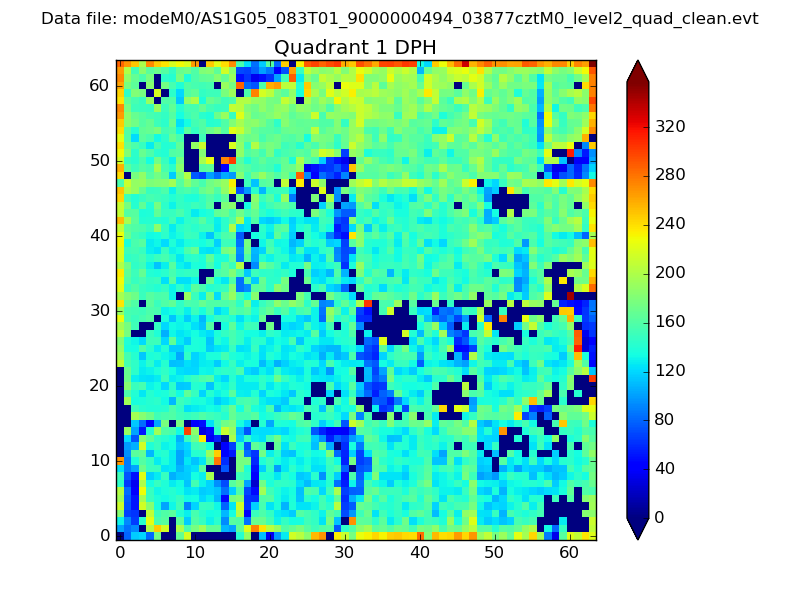 |
Quadrant B |
|---|---|---|---|
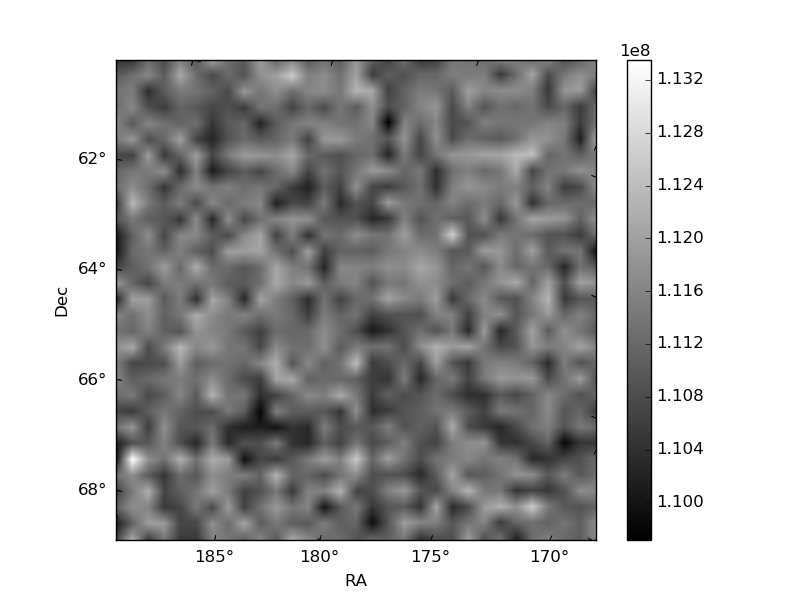
| Quadrant D | 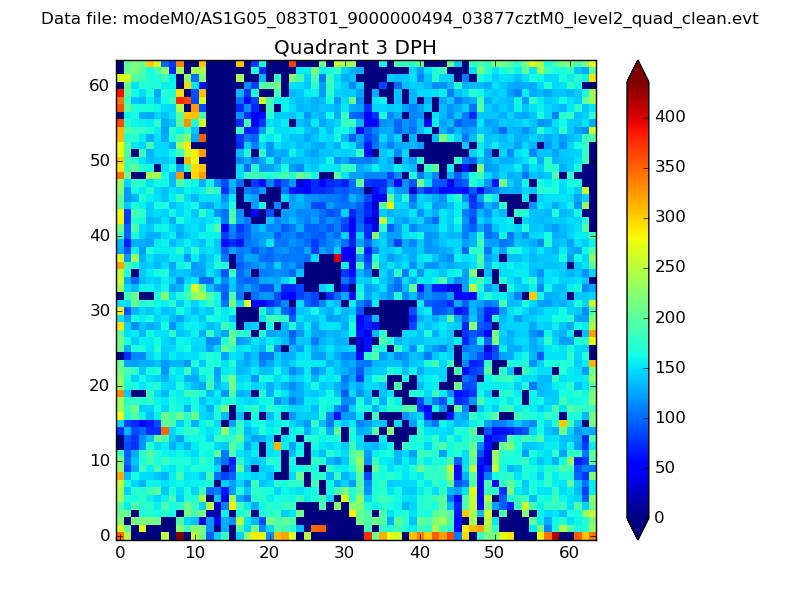 |
 |
Quadrant C |
| Plot type | Count rate plots | Images |
|---|---|---|
| Comparison with Poisson distribution Blue bars denote a histogram of data divided into 1 sec bins. Red curve is a Poisson curve with rate = median count rate of data. |
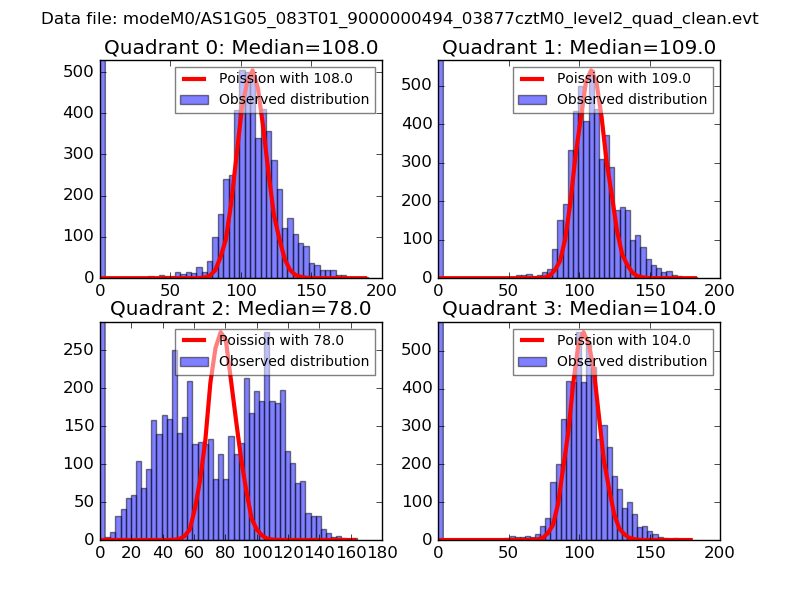 |
 |
| Quadrant-wise count rates Data is divided into 100 sec bins |
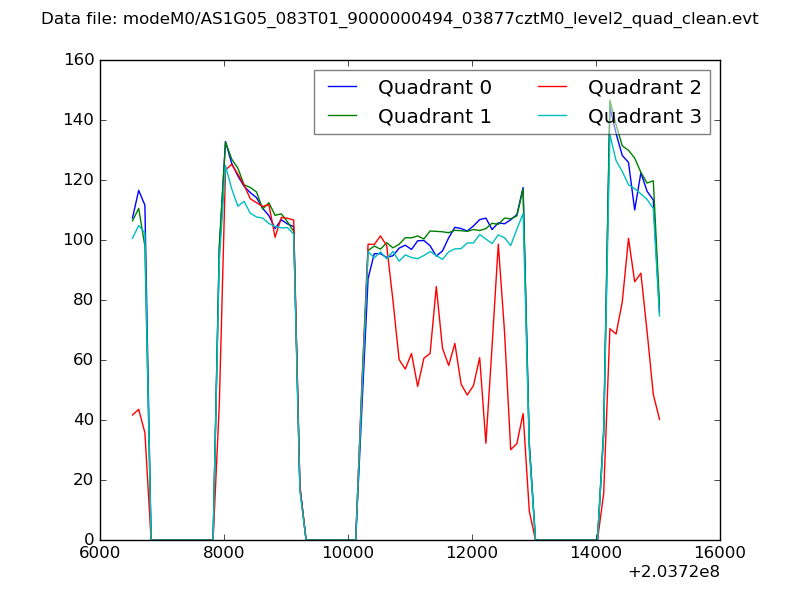 |
|
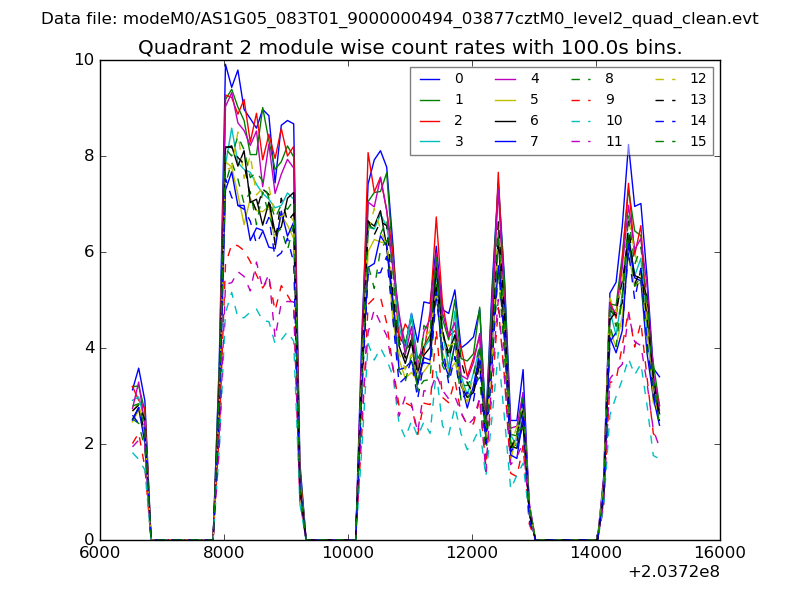
| Module-wise count rates for Quadrant A Data is divided into 100 sec bins |
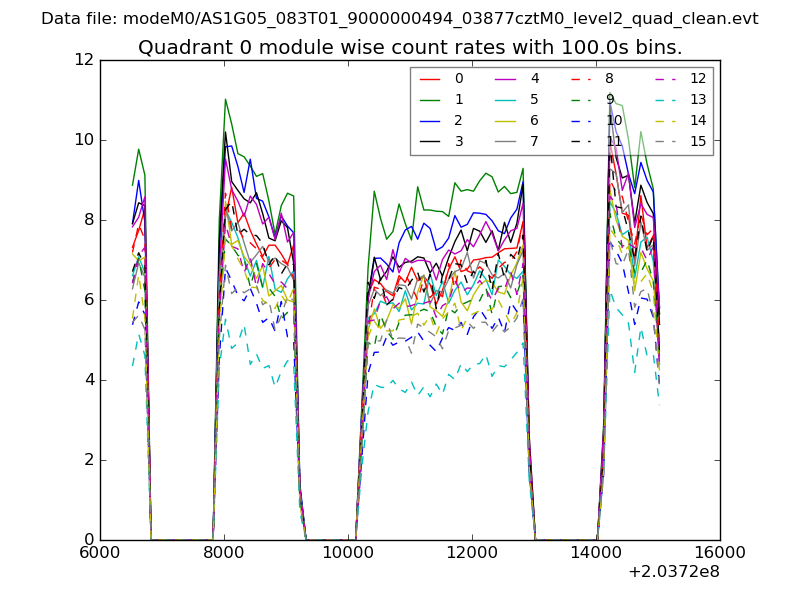 |
 |
| Module-wise count rates for Quadrant B Data is divided into 100 sec bins |
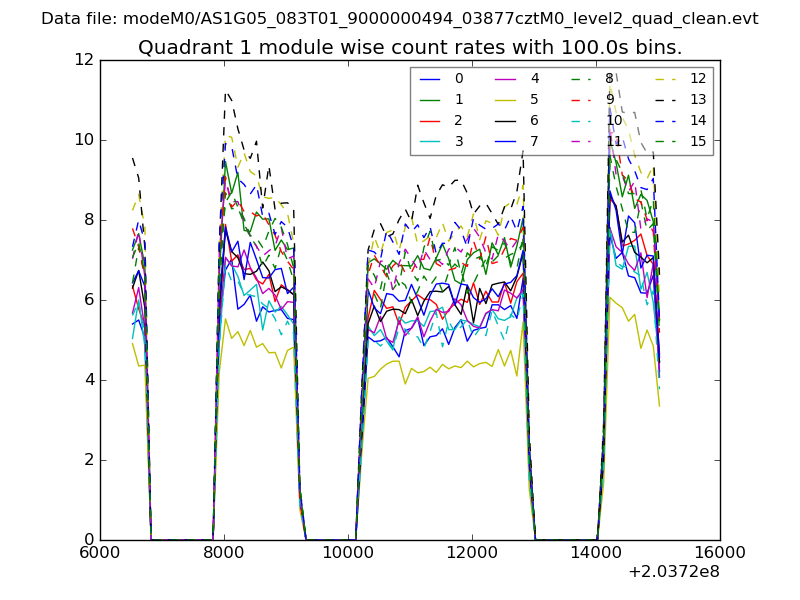 |
 |
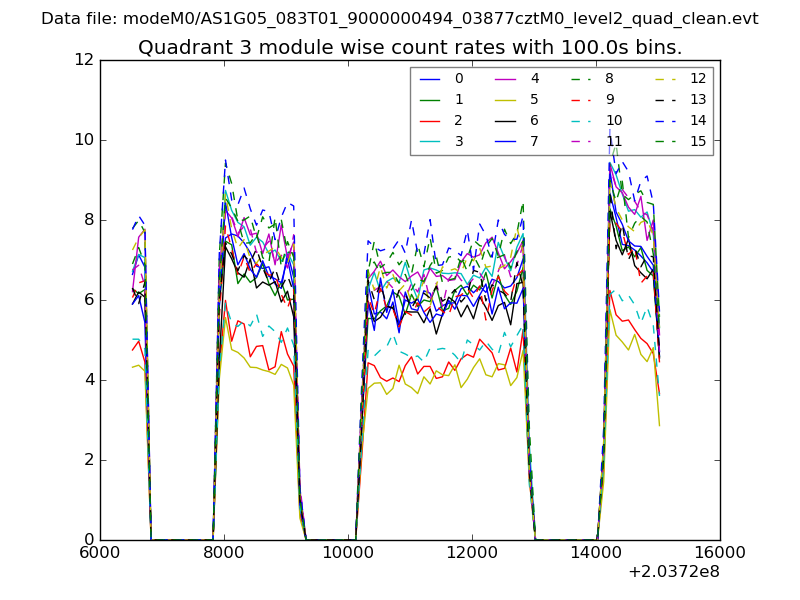
| Module-wise count rates for Quadrant C Data is divided into 100 sec bins |
 |
 |
| Module-wise count rates for Quadrant D Data is divided into 100 sec bins |
 |
 |
| Parameter | Plot |
|---|---|
| CZT HV Monitor | 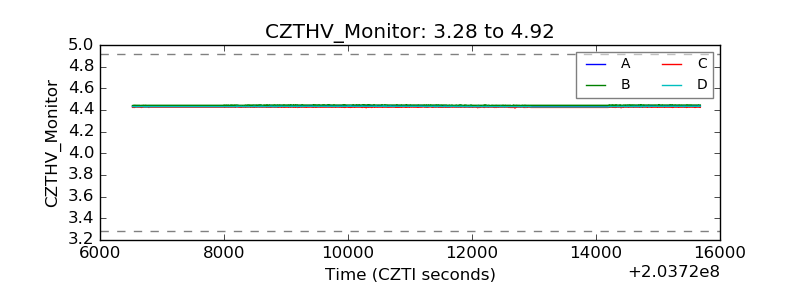 |
| D_VDD |  |
| Temperature 1 | 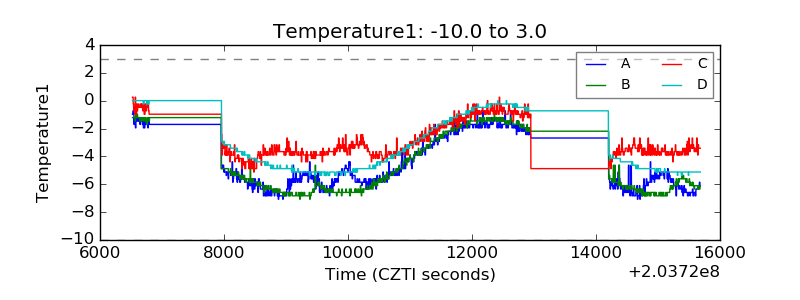 |
| Veto HV Monitor | 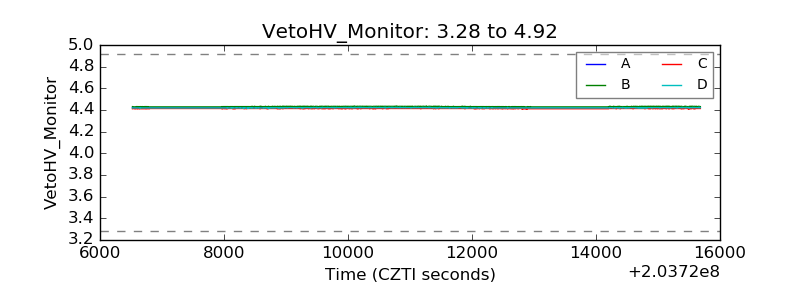 |
| Veto LLD | 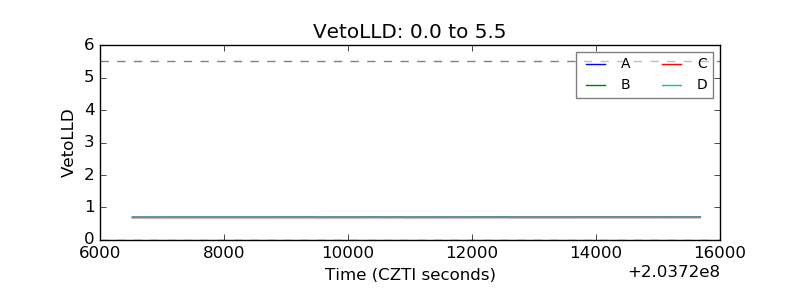 |
| Alpha Counter | 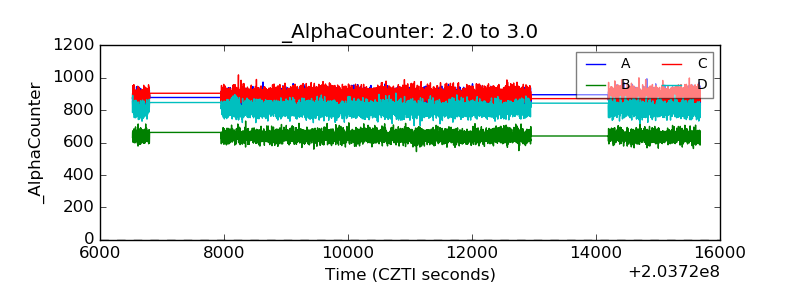 |
| _CPM_Rate | 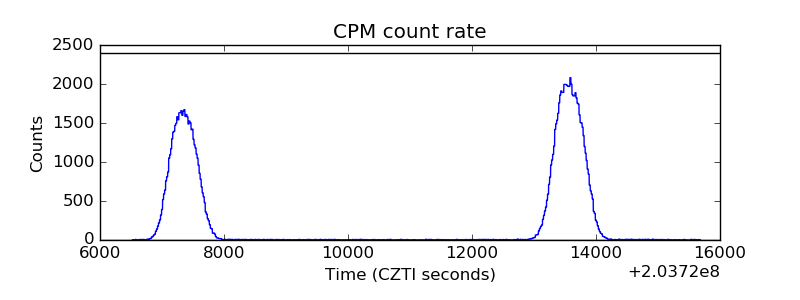 |
| CZT Counter | 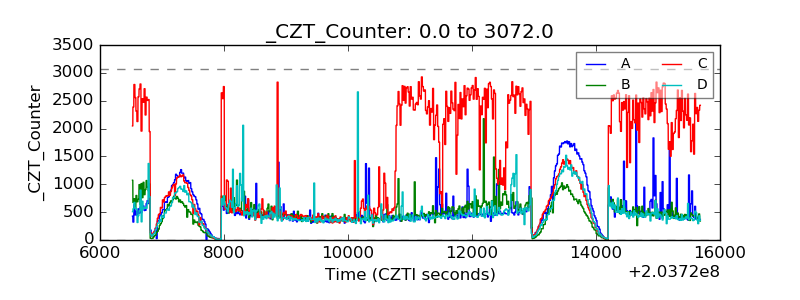 |
| +2.5 Volts monitor | 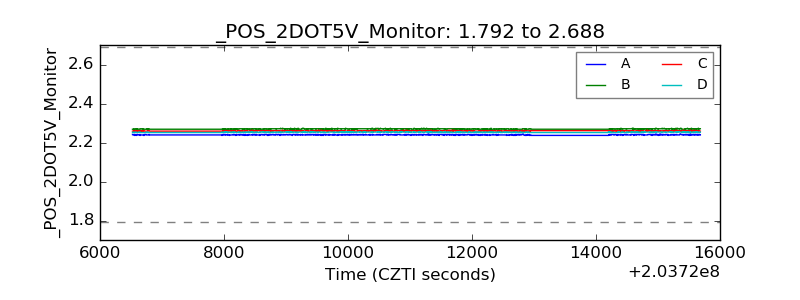 |
| +5 Volts monitor |  |
| _ROLL_ROT | 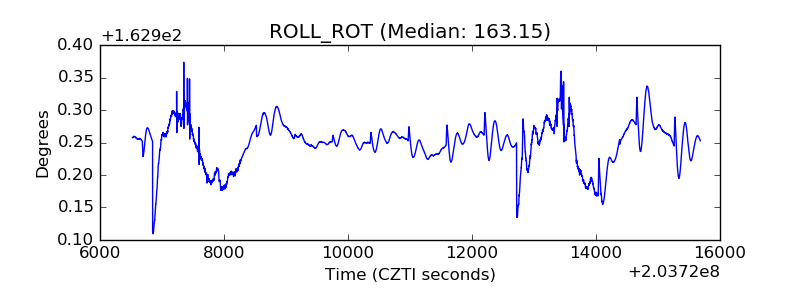 |
| _Roll_DEC | 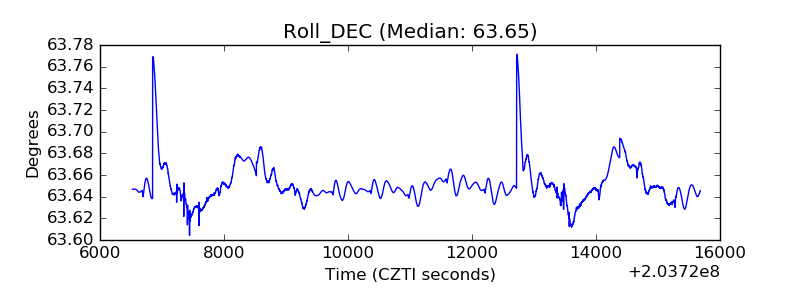 |
| _Roll_RA | 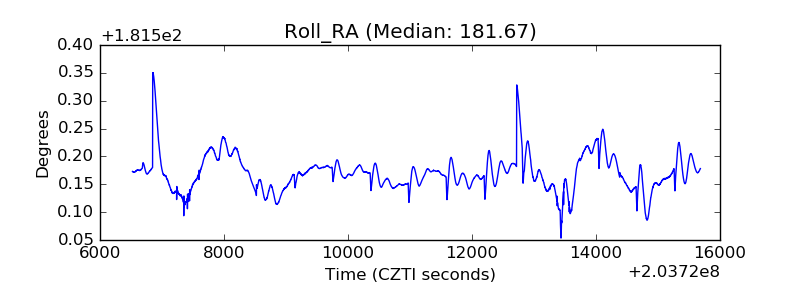 |
| Veto Counter | 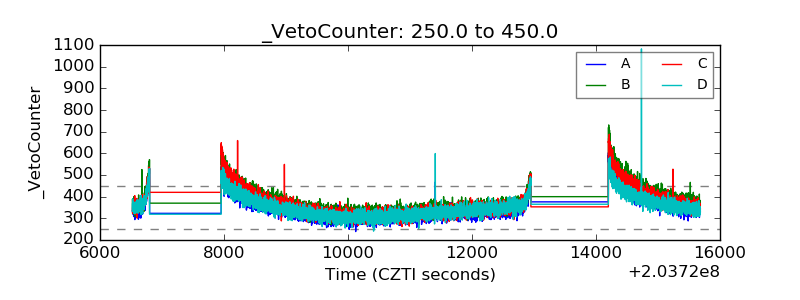 |