| Param | Original file | Final file |
|---|---|---|
| Filename | modeM0/AS1G05_083T01_9000000494_03878cztM0_level2.evt | modeM0/AS1G05_083T01_9000000494_03878cztM0_level2_quad_clean.evt |
| Size (bytes) | 719,648,640 | 74,888,640 |
| Size | 686.3 MB | 71.4 MB |
| Events in quadrant A | 3,388,921 | 492,842 |
| Events in quadrant B | 3,407,724 | 499,402 |
| Events in quadrant C | 11,272,145 | 360,146 |
| Events in quadrant D | 3,292,723 | 467,380 |
| Mode M0 | |||
|---|---|---|---|
| Quadrant | BADHDUFLAG | Total packets | Discarded packets |
| A | 0 | 14521 | 2 |
| B | 0 | 14426 | 1 |
| C | 0 | 37793 | 1 |
| D | 0 | 14543 | 1 |
| Mode M9 | |||
|---|---|---|---|
| Quadrant | BADHDUFLAG | Total packets | Discarded packets |
| A | 0 | 13 | 0 |
| B | 0 | 13 | 0 |
| C | 0 | 13 | 0 |
| D | 0 | 13 | 0 |
| Mode SS | |||
|---|---|---|---|
| Quadrant | BADHDUFLAG | Total packets | Discarded packets |
| A | 0 | 130 | 0 |
| B | 0 | 130 | 0 |
| C | 0 | 130 | 0 |
| D | 0 | 130 | 0 |
| Quadrant | Total seconds | Saturated seconds | Saturation percentage |
|---|---|---|---|
| A | 6398 | 82 | 1.281651% |
| B | 6398 | 109 | 1.703657% |
| C | 6398 | 3453 | 53.969991% |
| D | 6398 | 80 | 1.250391% |
Noise dominated data is calculated using 1-second bins in cleaned event files. If a bin has >2000 counts, and if more than 50% of those come from <1% of pixels, then it is considered to be noise-dominated and hence unusable.
| Quadrant | # 1 sec bins | Bins with >0 counts | Bins with >2000 counts | High rate bins dominated by noise | Noise dominated (total time) | Noise dominated (detector-on time) | Marked lightcurve |
|---|---|---|---|---|---|---|---|
| A | 7698 | 6398 | 39 | 39 | 0.51% | 0.61% | 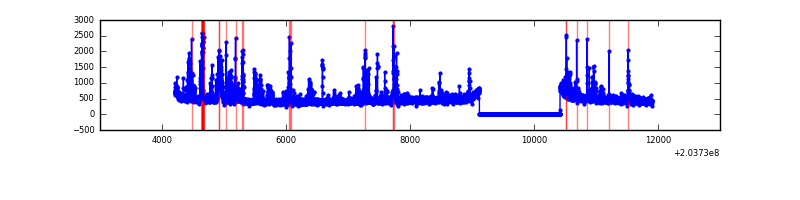 |
| B | 7698 | 6398 | 49 | 49 | 0.64% | 0.77% | 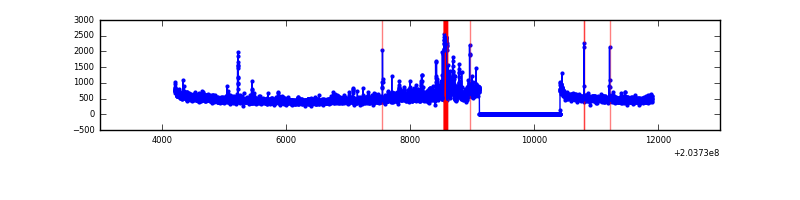 |
| C | 7698 | 6399 | 3763 | 3763 | 48.88% | 58.81% | 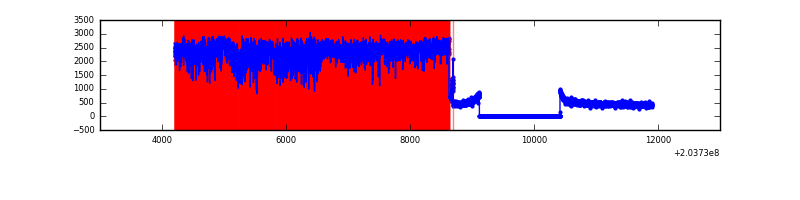 |
| D | 7698 | 6399 | 58 | 58 | 0.75% | 0.91% | 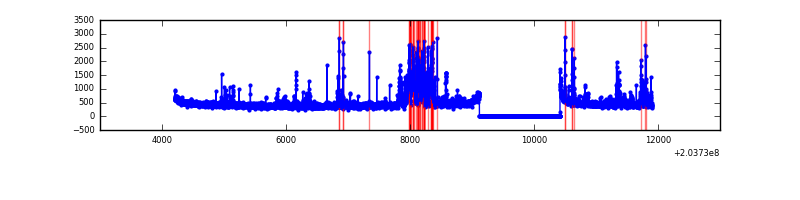 |
Top three noisy pixels from each quadrant. If the there are fewer than three noisy pixels in the level2.evt file, extra rows are filled as -1
| Pixel properties | Quadrant properties | ||||||
|---|---|---|---|---|---|---|---|
| Quadrant | DetID | PixID | Counts | Sigma | Mean | Median | Sigma |
| A | 0 | 118 | 402078 | 2697.89 | 737 | 721 | 148.8 |
| A | 0 | 226 | 44568 | 294.74 | 737 | 721 | 148.8 |
| A | 15 | 174 | 27448 | 179.66 | 737 | 721 | 148.8 |
| B | 15 | 204 | 306493 | 2175.19 | 749 | 732 | 140.6 |
| B | 4 | 81 | 122666 | 867.44 | 749 | 732 | 140.6 |
| B | 0 | 219 | 21355 | 146.71 | 749 | 732 | 140.6 |
| C | 2 | 53 | 8843955 | 63836.13 | 601 | 604 | 138.5 |
| C | 1 | 16 | 50235 | 358.26 | 601 | 604 | 138.5 |
| C | 10 | 65 | 18831 | 131.57 | 601 | 604 | 138.5 |
| D | 14 | 34 | 429652 | 2506.66 | 708 | 685 | 171.1 |
| D | 13 | 248 | 71470 | 413.63 | 708 | 685 | 171.1 |
| D | 13 | 239 | 36094 | 206.91 | 708 | 685 | 171.1 |
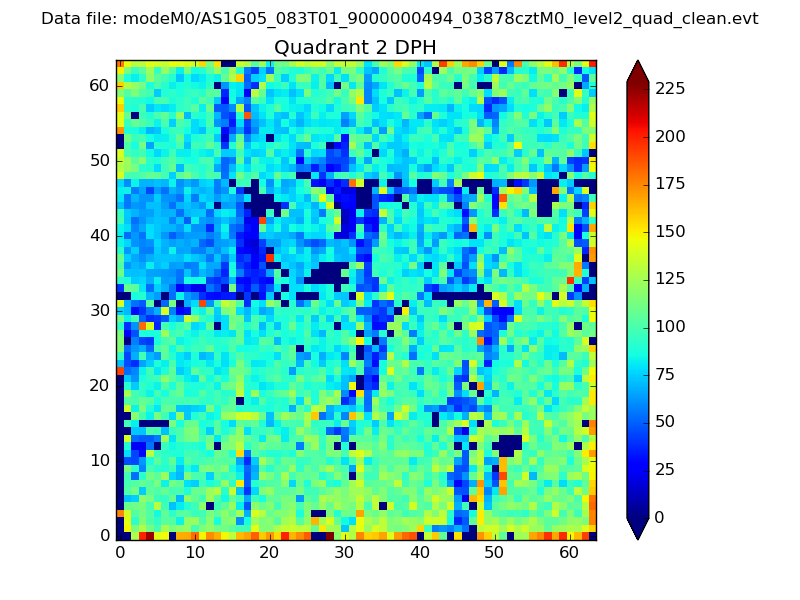
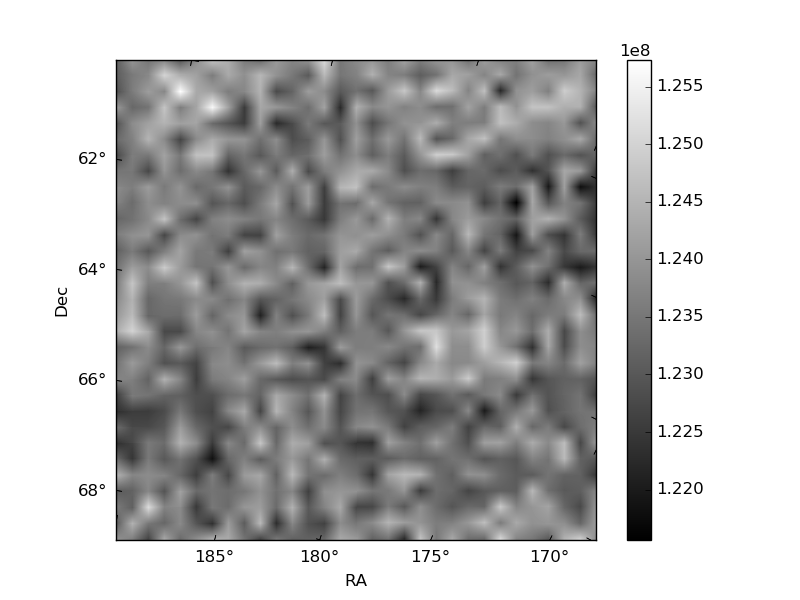
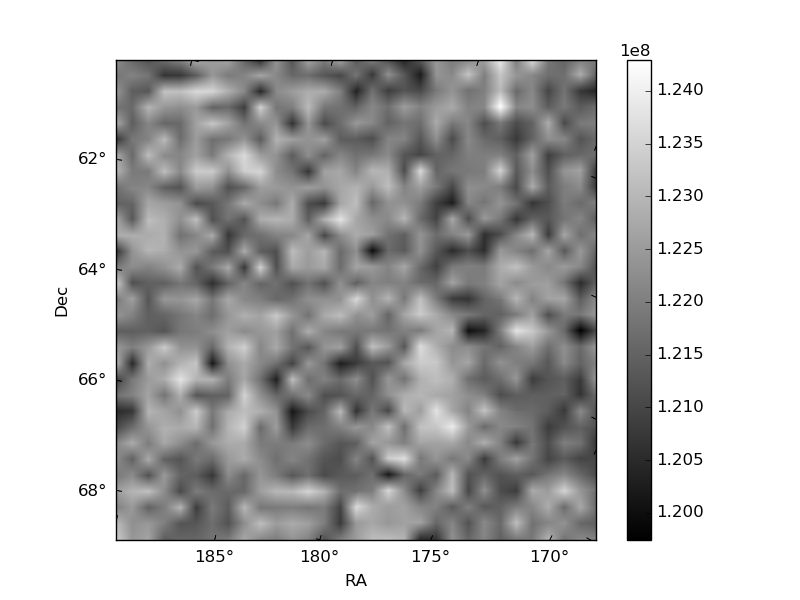
Histogram calculated using DETX and DETY for each event in the final _common_clean file
| Quadrant A | 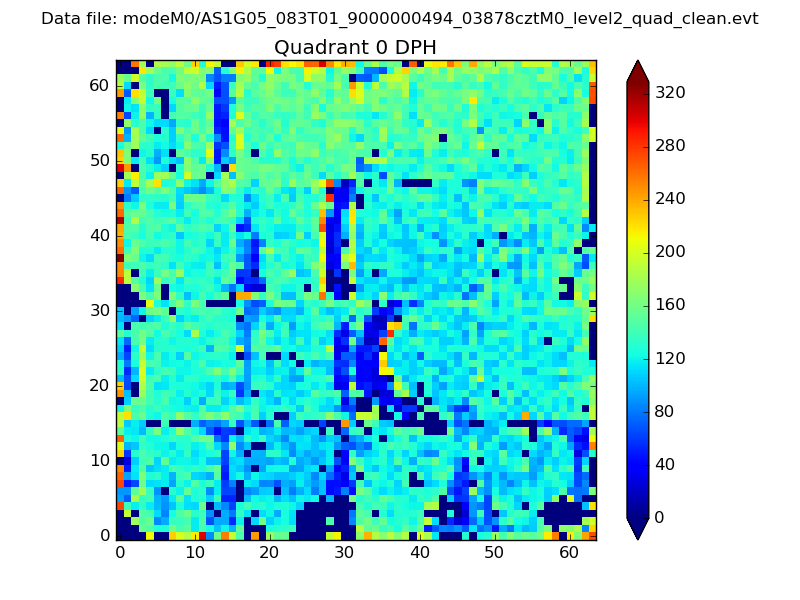 |
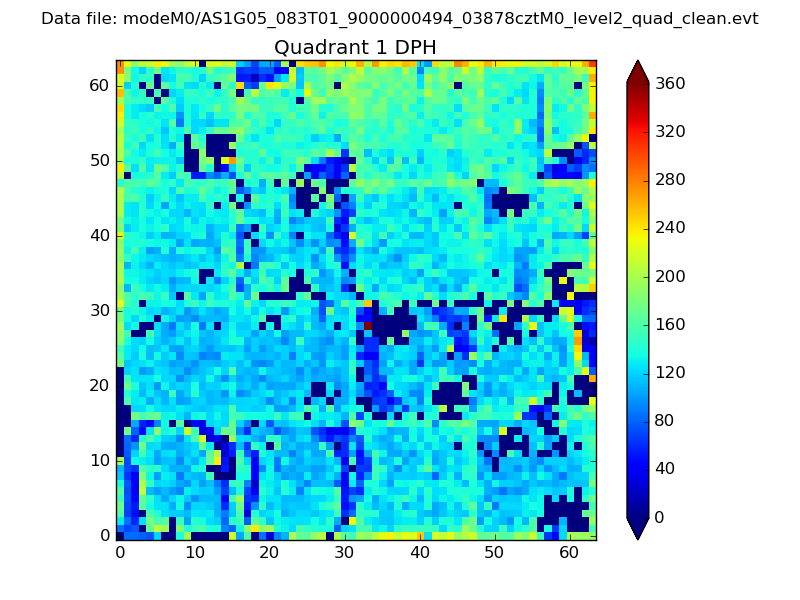 |
Quadrant B |
|---|---|---|---|
| Quadrant D | 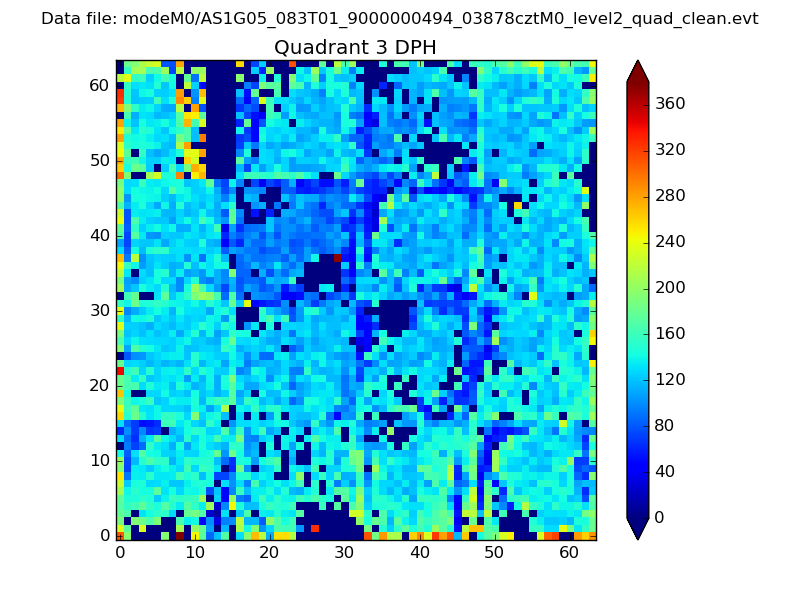 |
 |
Quadrant C |
| Plot type | Count rate plots | Images |
|---|---|---|
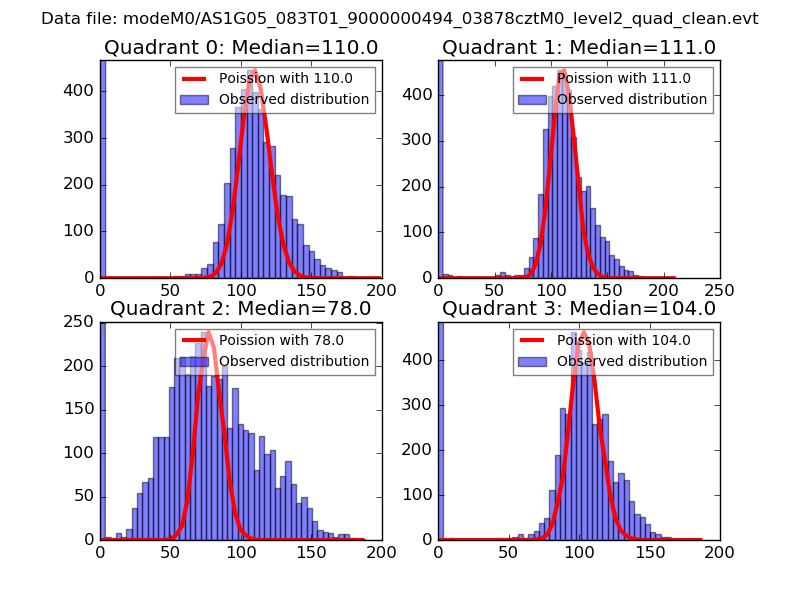
| Comparison with Poisson distribution Blue bars denote a histogram of data divided into 1 sec bins. Red curve is a Poisson curve with rate = median count rate of data. |
 |
 |
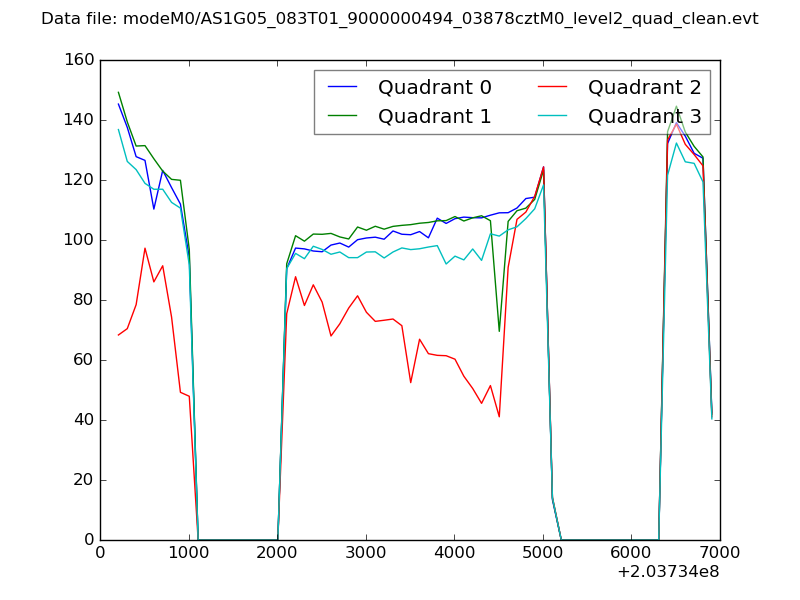
| Quadrant-wise count rates Data is divided into 100 sec bins |
 |
|
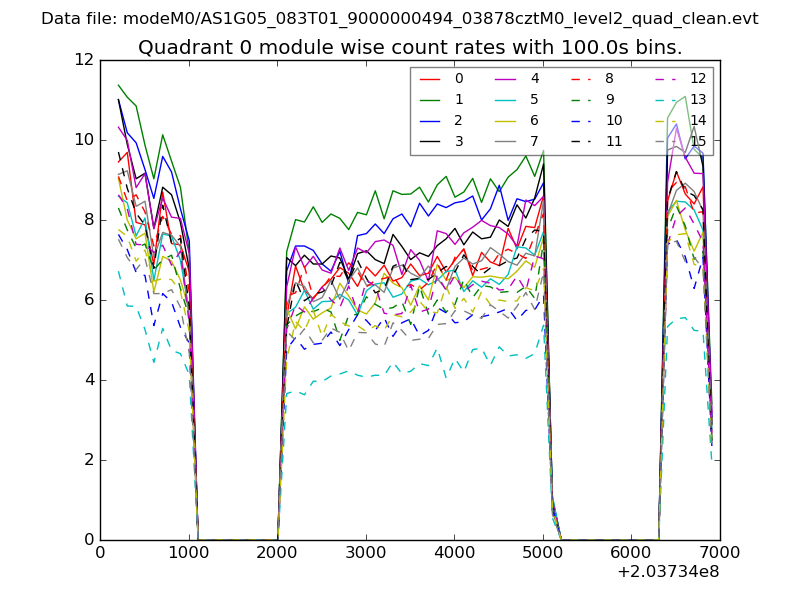
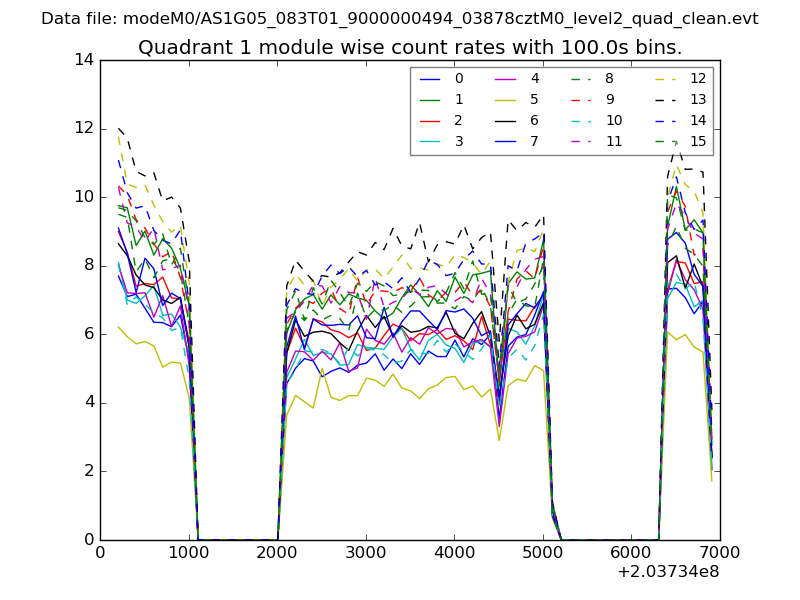
| Module-wise count rates for Quadrant A Data is divided into 100 sec bins |
 |
 |
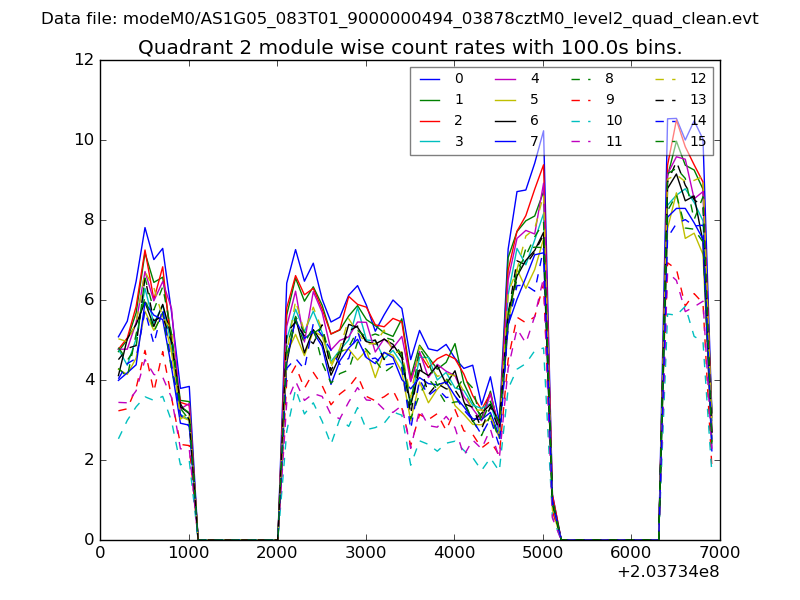
| Module-wise count rates for Quadrant B Data is divided into 100 sec bins |
 |
 |
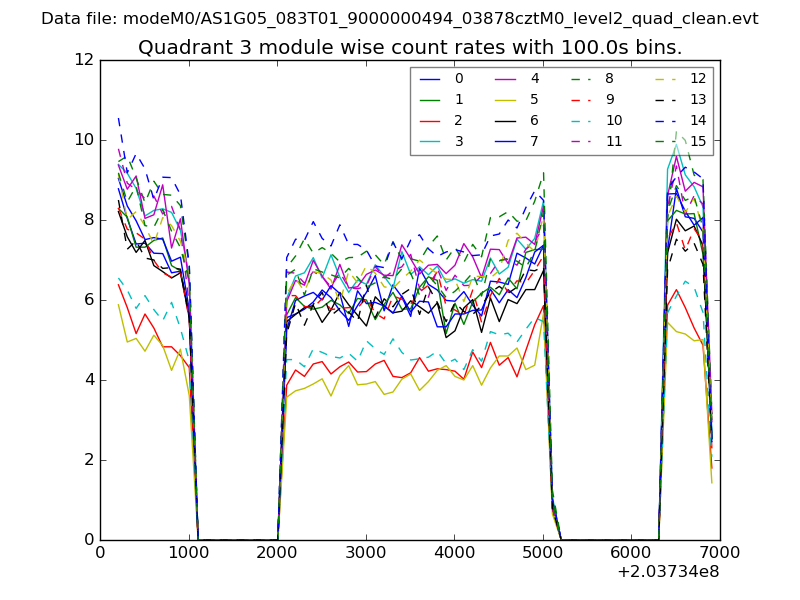
| Module-wise count rates for Quadrant C Data is divided into 100 sec bins |
 |
 |
| Module-wise count rates for Quadrant D Data is divided into 100 sec bins |
 |
 |
| Parameter | Plot |
|---|---|
| CZT HV Monitor | 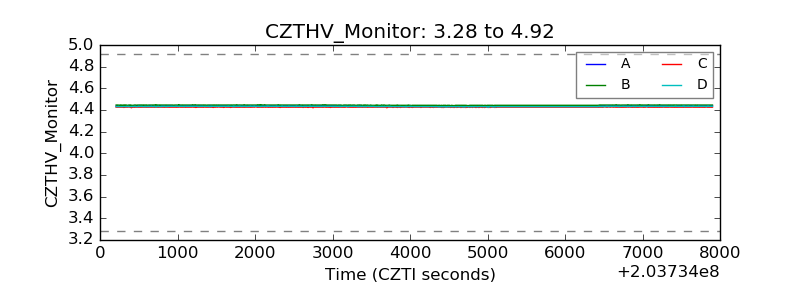 |
| D_VDD | 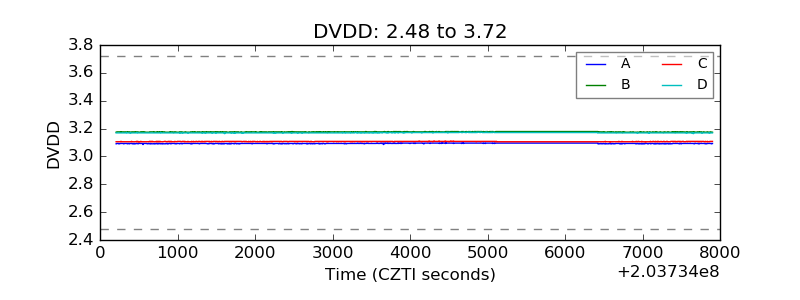 |
| Temperature 1 | 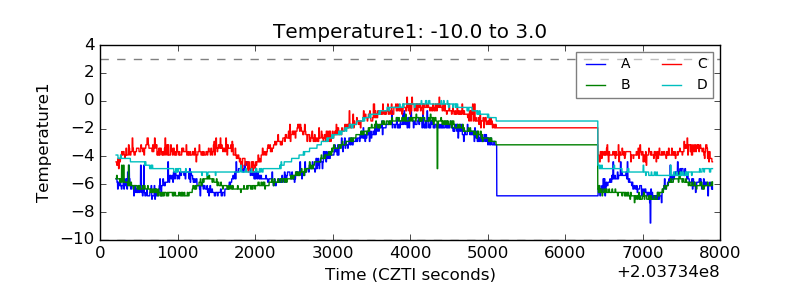 |
| Veto HV Monitor | 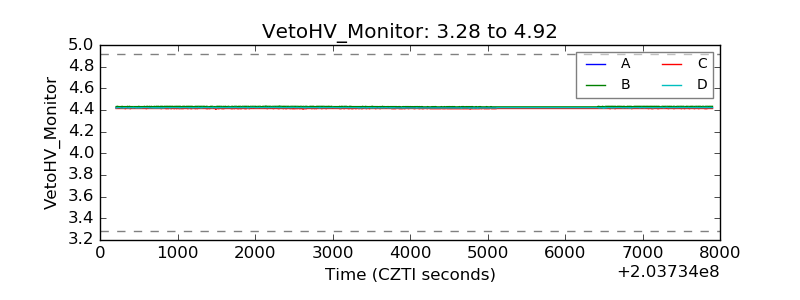 |
| Veto LLD | 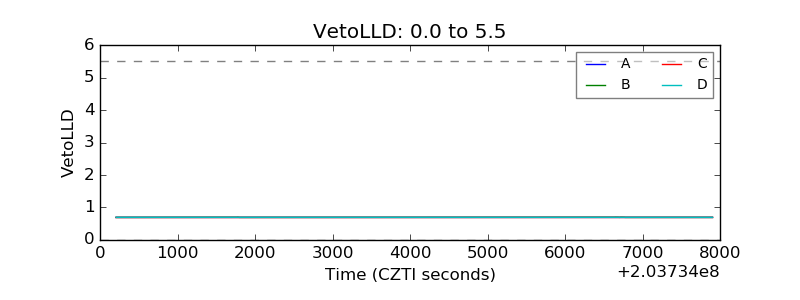 |
| Alpha Counter | 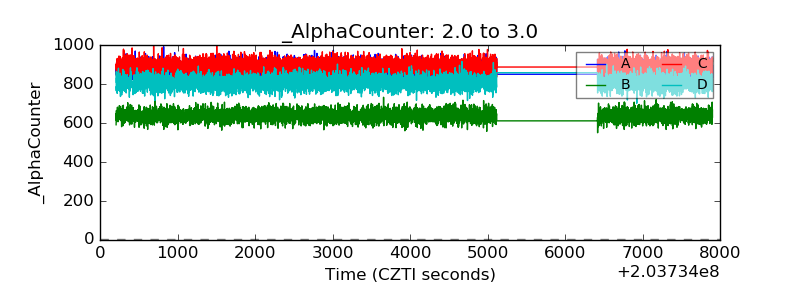 |
| _CPM_Rate | 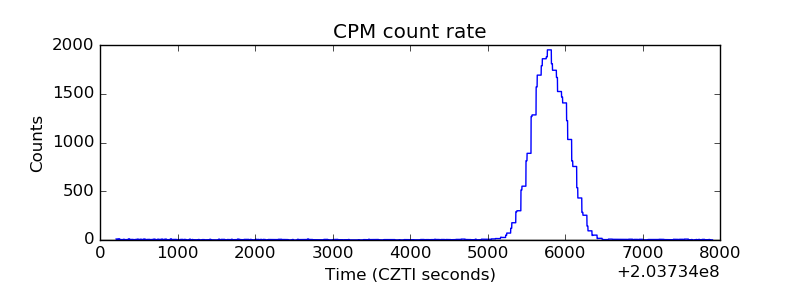 |
| CZT Counter | 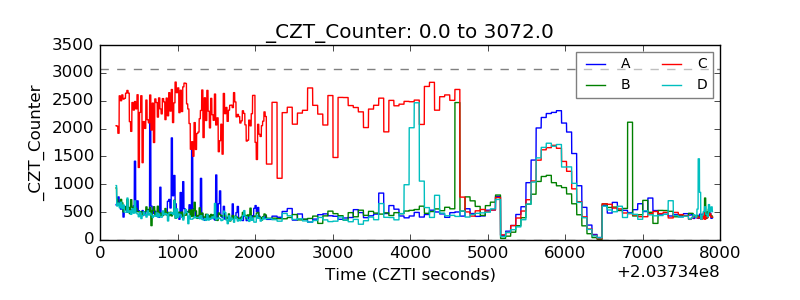 |
| +2.5 Volts monitor |  |
| +5 Volts monitor |  |
| _ROLL_ROT | 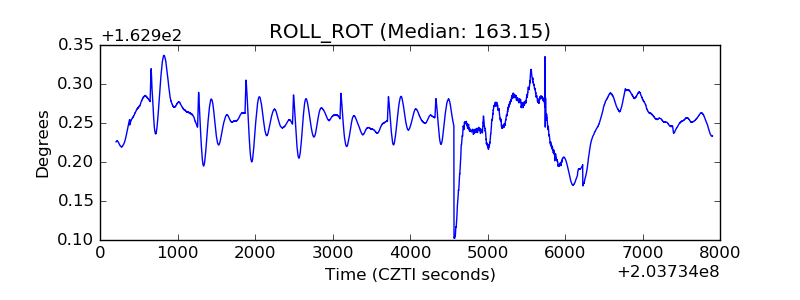 |
| _Roll_DEC | 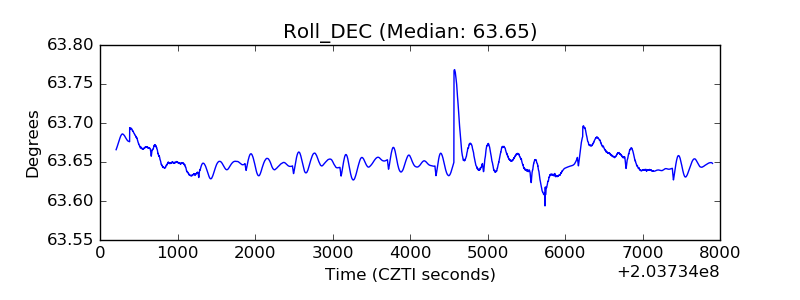 |
| _Roll_RA | 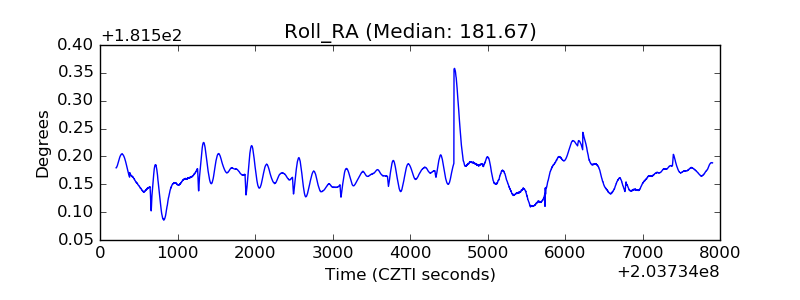 |
| Veto Counter | 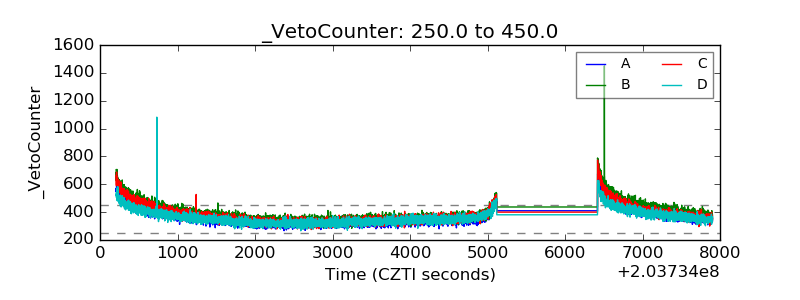 |