| Param | Original file | Final file |
|---|---|---|
| Filename | modeM0/AS1G05_083T01_9000000494_03879cztM0_level2.evt | modeM0/AS1G05_083T01_9000000494_03879cztM0_level2_quad_clean.evt |
| Size (bytes) | 442,261,440 | 81,377,280 |
| Size | 421.8 MB | 77.6 MB |
| Events in quadrant A | 3,284,262 | 506,460 |
| Events in quadrant B | 3,331,289 | 512,375 |
| Events in quadrant C | 3,108,743 | 504,490 |
| Events in quadrant D | 3,221,658 | 481,544 |
| Mode M0 | |||
|---|---|---|---|
| Quadrant | BADHDUFLAG | Total packets | Discarded packets |
| A | 0 | 14246 | 3 |
| B | 0 | 14201 | 2 |
| C | 0 | 13707 | 2 |
| D | 0 | 14422 | 2 |
| Mode M9 | |||
|---|---|---|---|
| Quadrant | BADHDUFLAG | Total packets | Discarded packets |
| A | 0 | 26 | 0 |
| B | 0 | 26 | 0 |
| C | 0 | 26 | 0 |
| D | 0 | 26 | 0 |
| Mode SS | |||
|---|---|---|---|
| Quadrant | BADHDUFLAG | Total packets | Discarded packets |
| A | 0 | 136 | 0 |
| B | 0 | 136 | 0 |
| C | 0 | 136 | 0 |
| D | 0 | 136 | 0 |
| Quadrant | Total seconds | Saturated seconds | Saturation percentage |
|---|---|---|---|
| A | 6586 | 111 | 1.685393% |
| B | 6586 | 144 | 2.186456% |
| C | 6586 | 68 | 1.032493% |
| D | 6586 | 90 | 1.366535% |
Noise dominated data is calculated using 1-second bins in cleaned event files. If a bin has >2000 counts, and if more than 50% of those come from <1% of pixels, then it is considered to be noise-dominated and hence unusable.
| Quadrant | # 1 sec bins | Bins with >0 counts | Bins with >2000 counts | High rate bins dominated by noise | Noise dominated (total time) | Noise dominated (detector-on time) | Marked lightcurve |
|---|---|---|---|---|---|---|---|
| A | 9186 | 6586 | 13 | 13 | 0.14% | 0.20% | 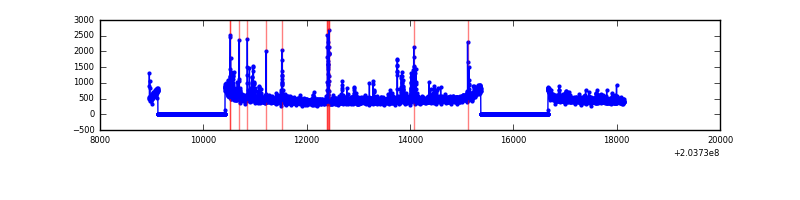 |
| B | 9186 | 6586 | 9 | 9 | 0.10% | 0.14% | 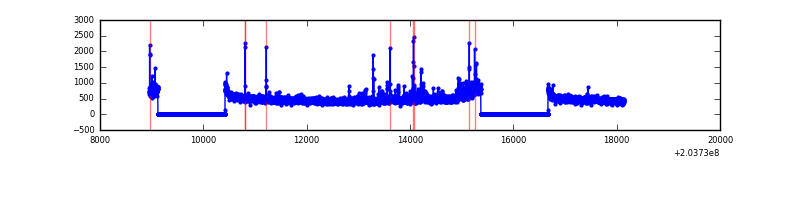 |
| C | 9186 | 6587 | 0 | 0 | 0.00% | 0.00% | 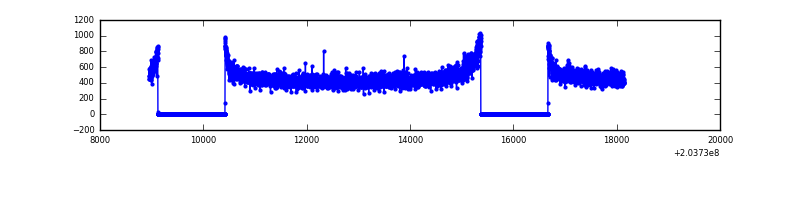 |
| D | 9186 | 6587 | 45 | 45 | 0.49% | 0.68% | 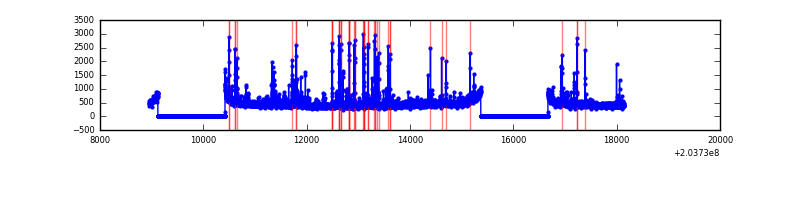 |
Top three noisy pixels from each quadrant. If the there are fewer than three noisy pixels in the level2.evt file, extra rows are filled as -1
| Pixel properties | Quadrant properties | ||||||
|---|---|---|---|---|---|---|---|
| Quadrant | DetID | PixID | Counts | Sigma | Mean | Median | Sigma |
| A | 0 | 118 | 130195 | 817.3 | 781 | 763 | 158.4 |
| A | 0 | 50 | 54230 | 337.62 | 781 | 763 | 158.4 |
| A | 8 | 15 | 35897 | 221.85 | 781 | 763 | 158.4 |
| B | 15 | 204 | 182165 | 1215.01 | 793 | 776 | 149.3 |
| B | 4 | 81 | 34149 | 223.54 | 793 | 776 | 149.3 |
| B | 15 | 54 | 27781 | 180.89 | 793 | 776 | 149.3 |
| C | 2 | 53 | 142126 | 813.82 | 756 | 761 | 173.7 |
| C | 13 | 61 | 6539 | 33.26 | 756 | 761 | 173.7 |
| C | 14 | 67 | 4428 | 21.11 | 756 | 761 | 173.7 |
| D | 1 | 84 | 133791 | 735.61 | 750 | 725 | 180.9 |
| D | 14 | 34 | 127317 | 699.82 | 750 | 725 | 180.9 |
| D | 13 | 248 | 32599 | 176.2 | 750 | 725 | 180.9 |
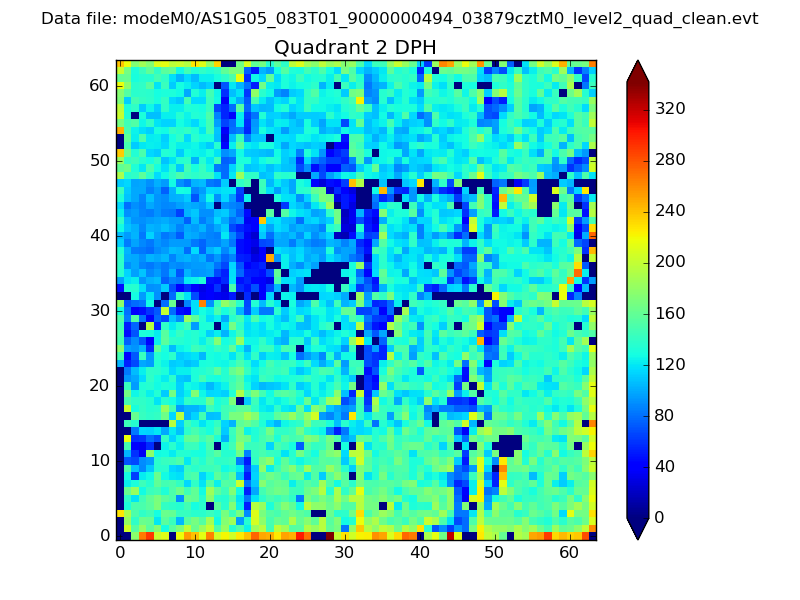
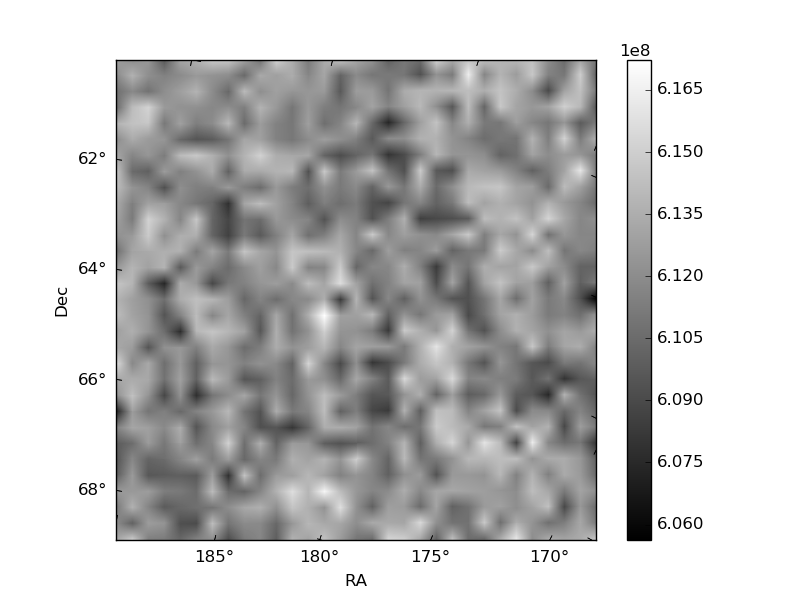
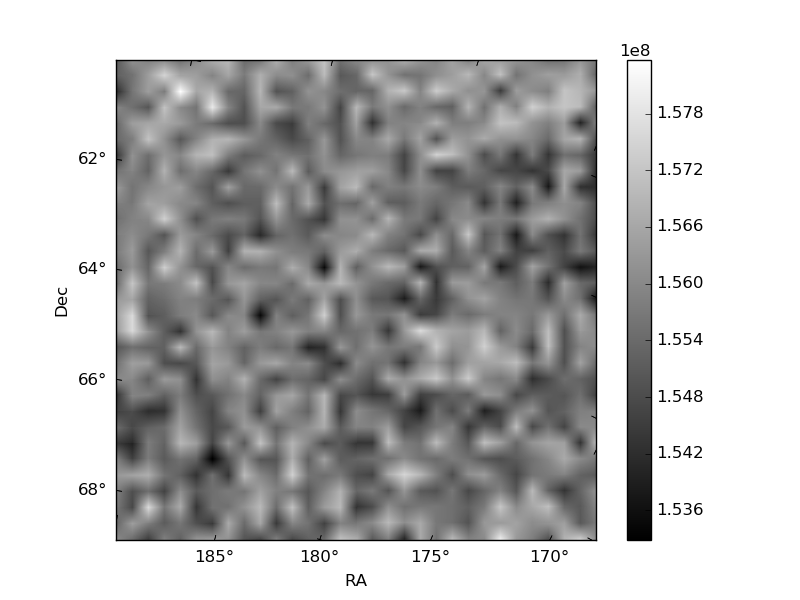
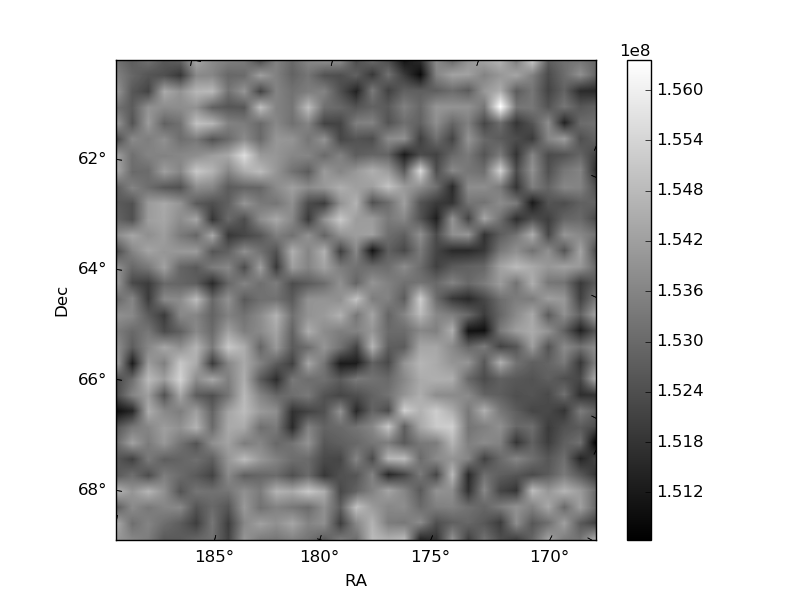
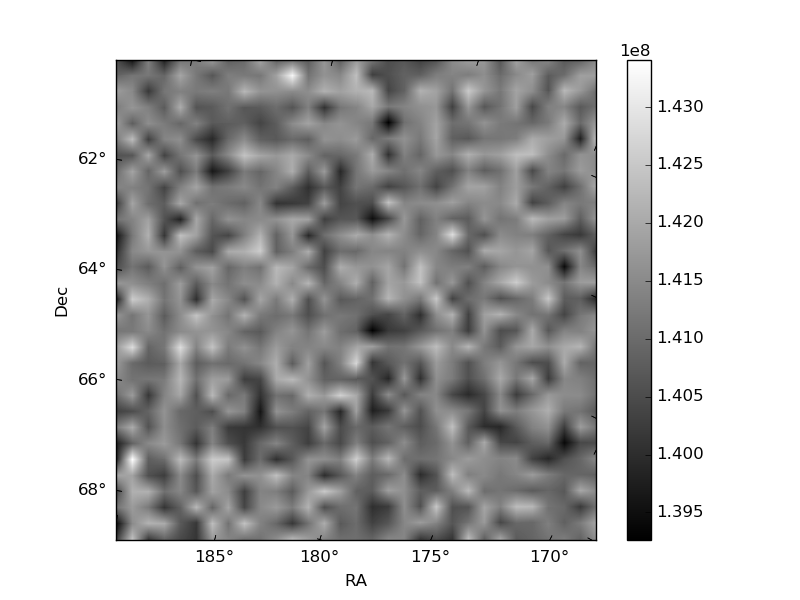
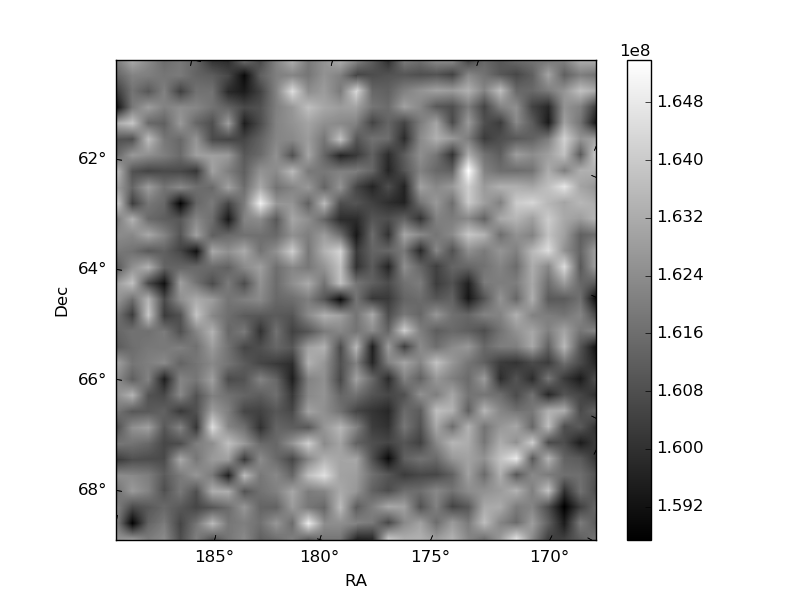
Histogram calculated using DETX and DETY for each event in the final _common_clean file
| Quadrant A | 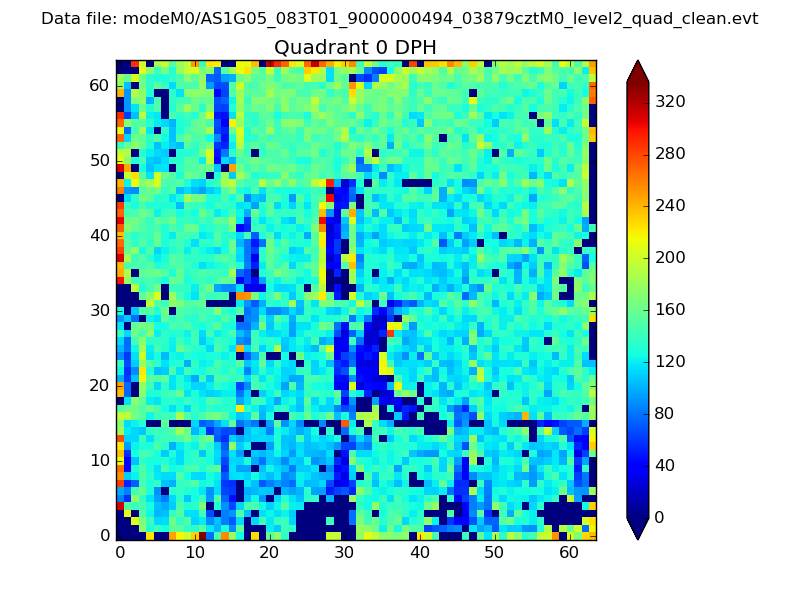 |
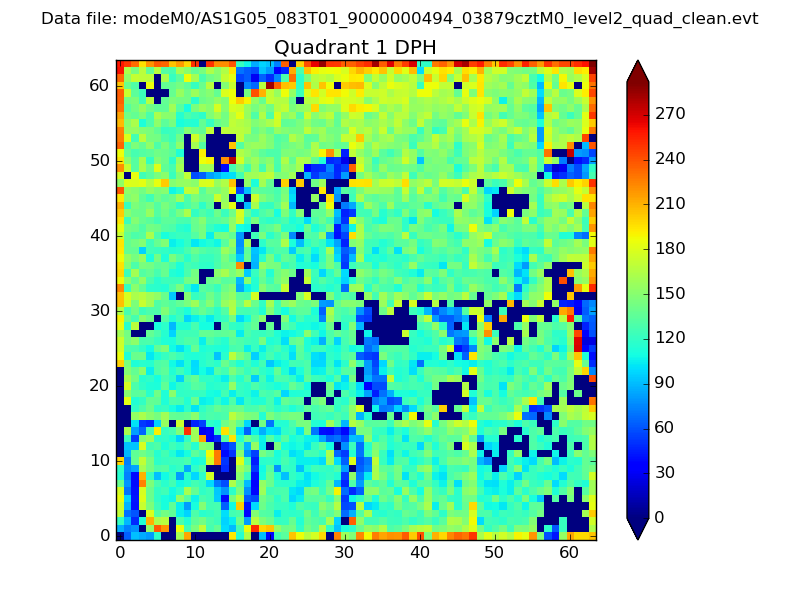 |
Quadrant B |
|---|---|---|---|
| Quadrant D | 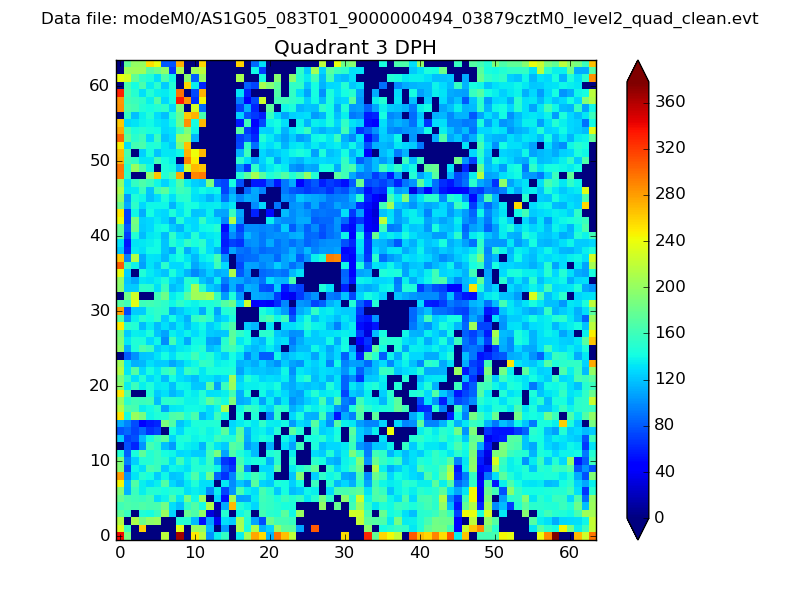 |
 |
Quadrant C |
| Plot type | Count rate plots | Images |
|---|---|---|
| Comparison with Poisson distribution Blue bars denote a histogram of data divided into 1 sec bins. Red curve is a Poisson curve with rate = median count rate of data. |
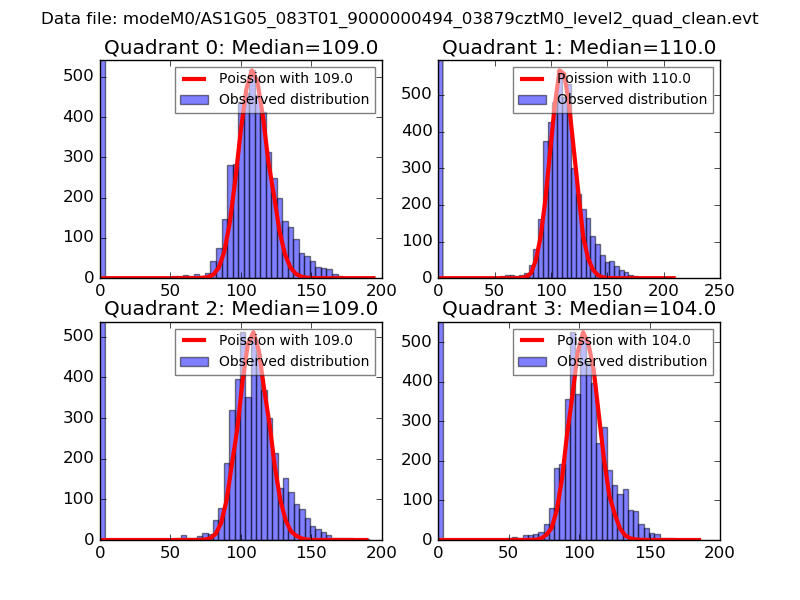 |
 |
| Quadrant-wise count rates Data is divided into 100 sec bins |
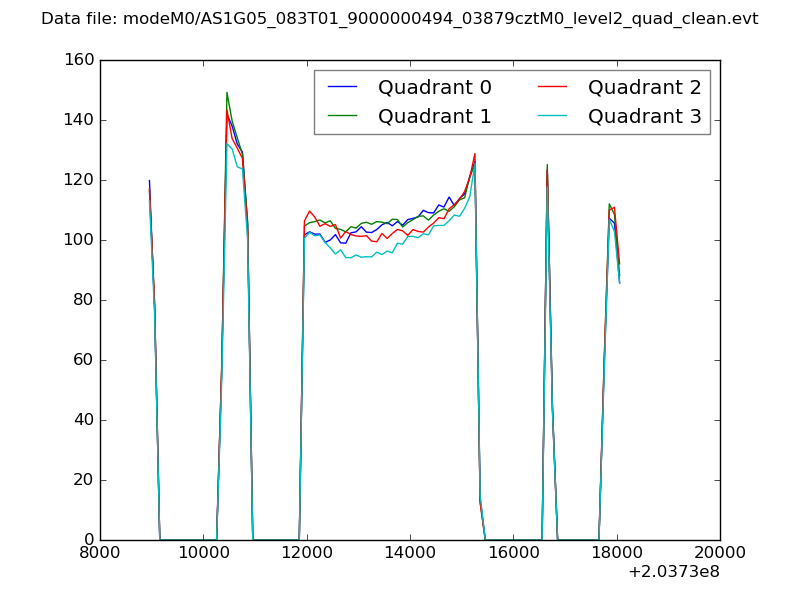 |
|
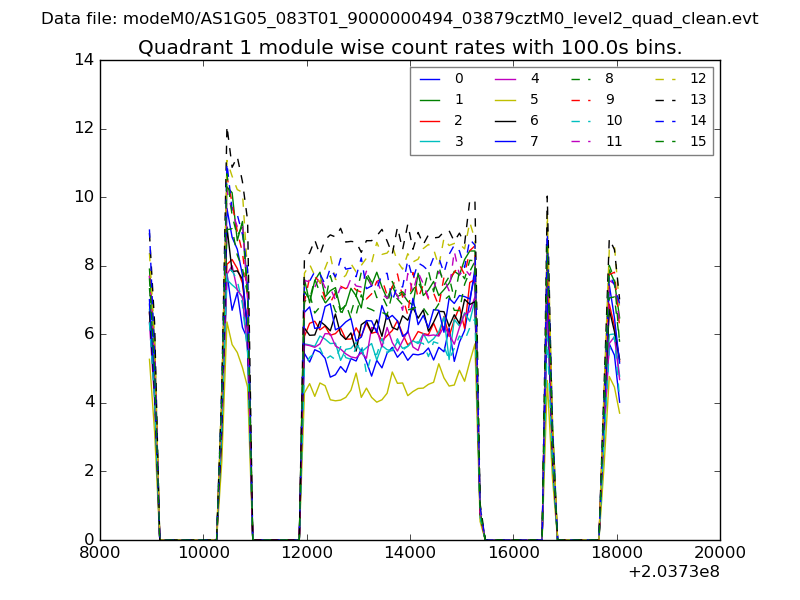
| Module-wise count rates for Quadrant A Data is divided into 100 sec bins |
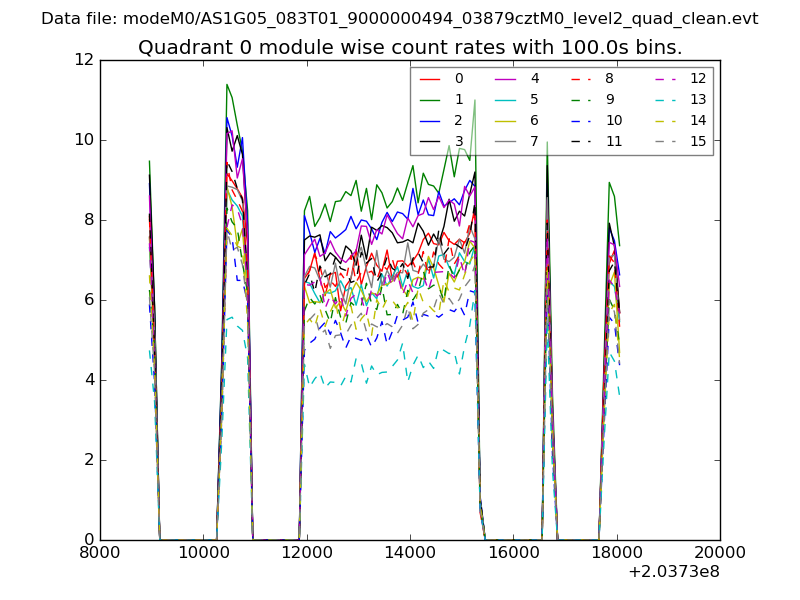 |
 |
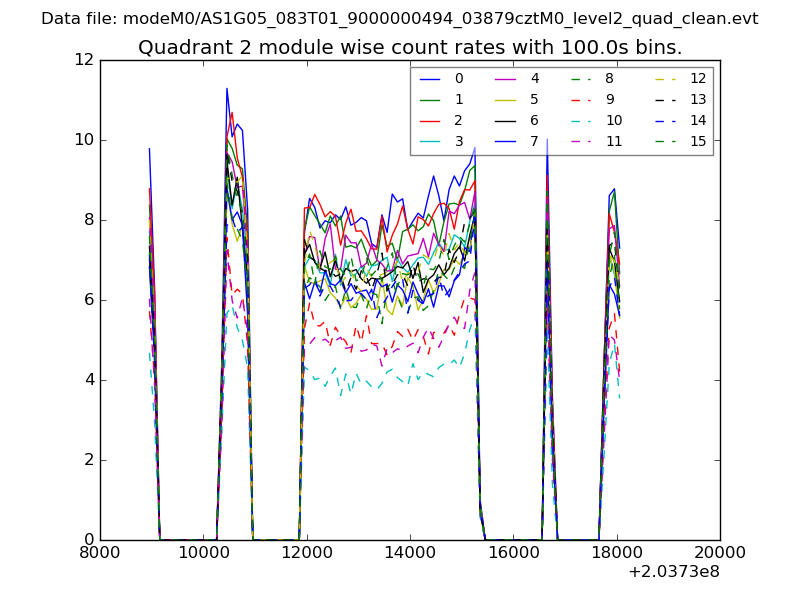
| Module-wise count rates for Quadrant B Data is divided into 100 sec bins |
 |
 |
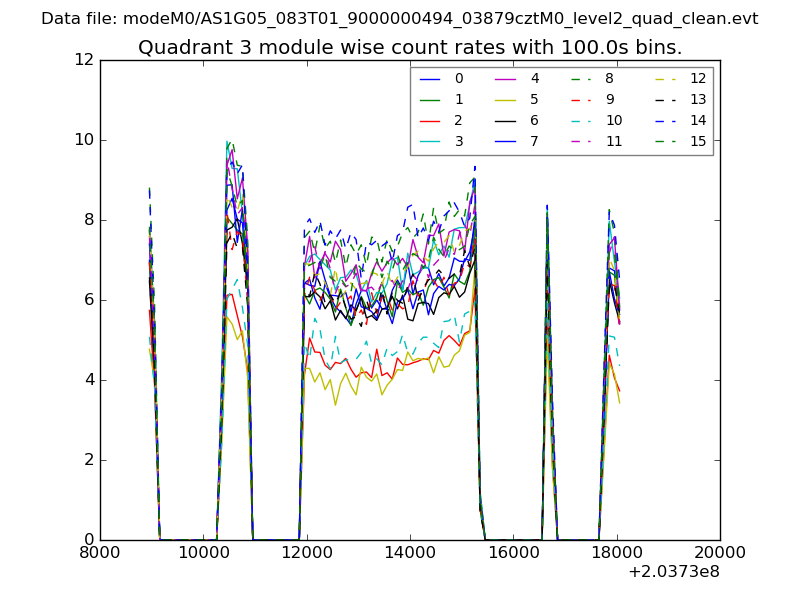
| Module-wise count rates for Quadrant C Data is divided into 100 sec bins |
 |
 |
| Module-wise count rates for Quadrant D Data is divided into 100 sec bins |
 |
 |
| Parameter | Plot |
|---|---|
| CZT HV Monitor | 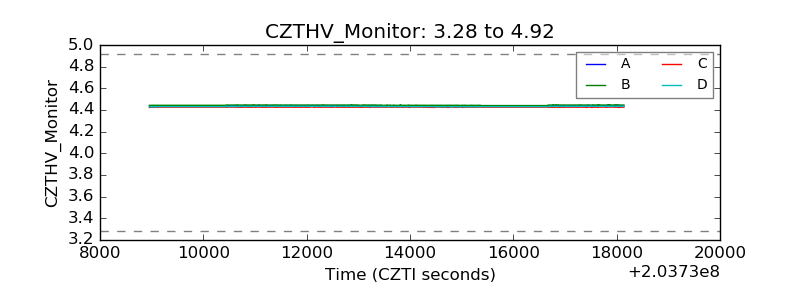 |
| D_VDD | 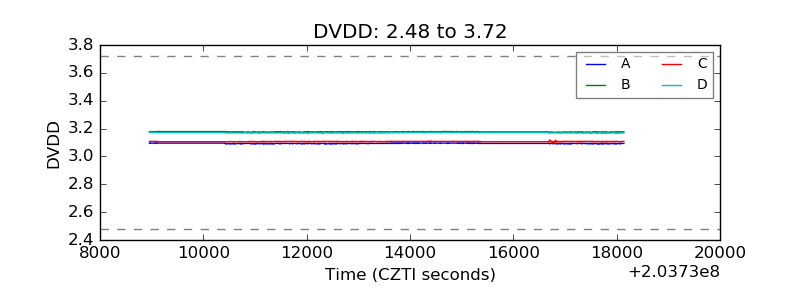 |
| Temperature 1 | 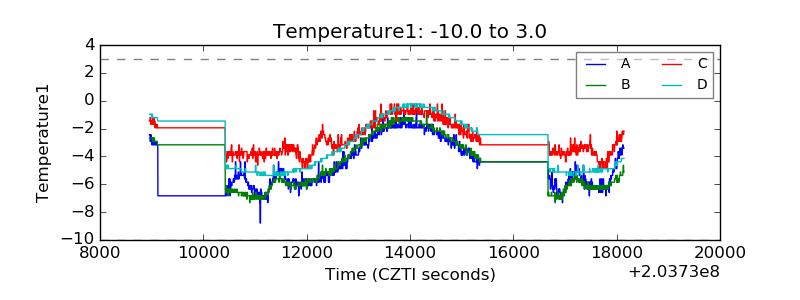 |
| Veto HV Monitor | 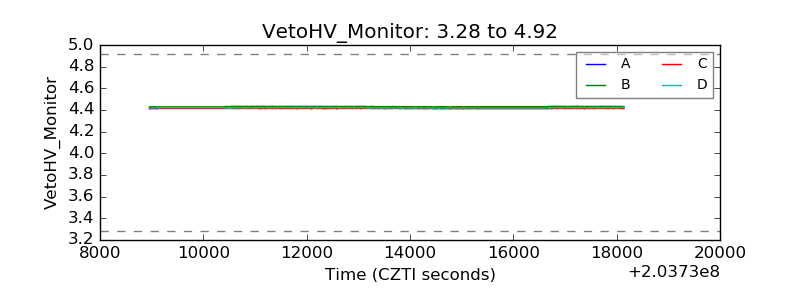 |
| Veto LLD | 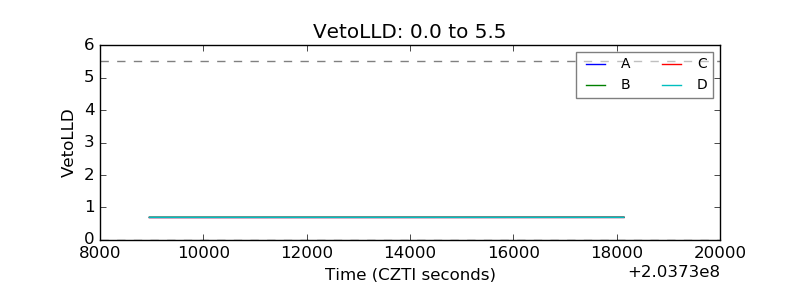 |
| Alpha Counter | 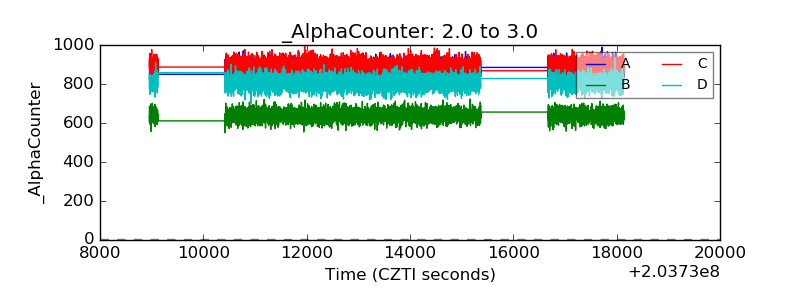 |
| _CPM_Rate | 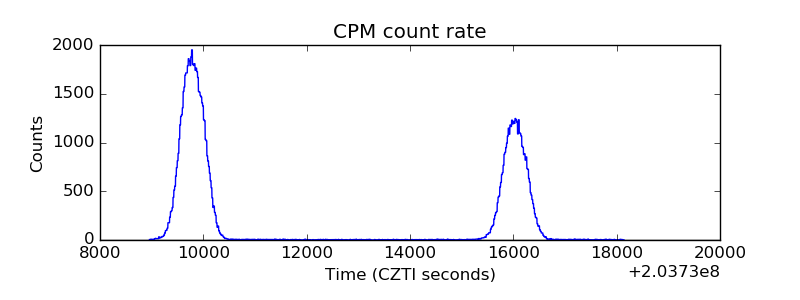 |
| CZT Counter | 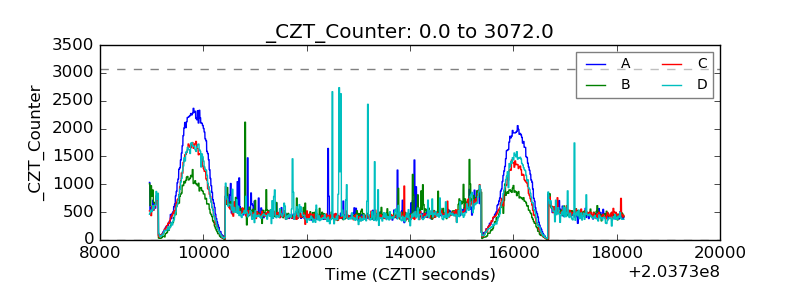 |
| +2.5 Volts monitor |  |
| +5 Volts monitor |  |
| _ROLL_ROT | 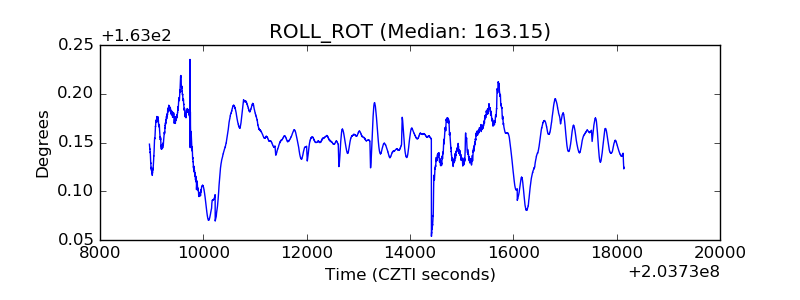 |
| _Roll_DEC | 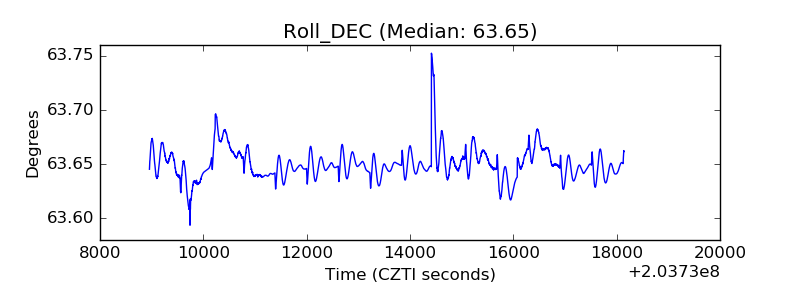 |
| _Roll_RA | 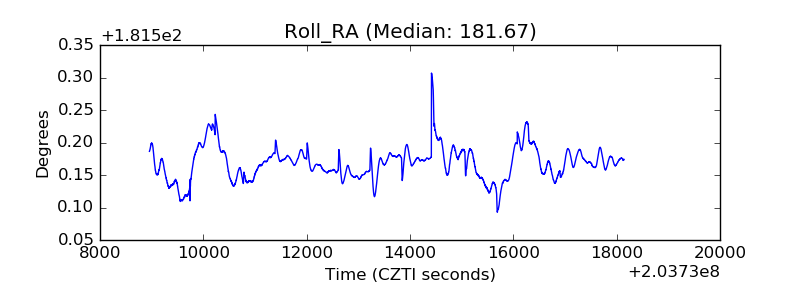 |
| Veto Counter | 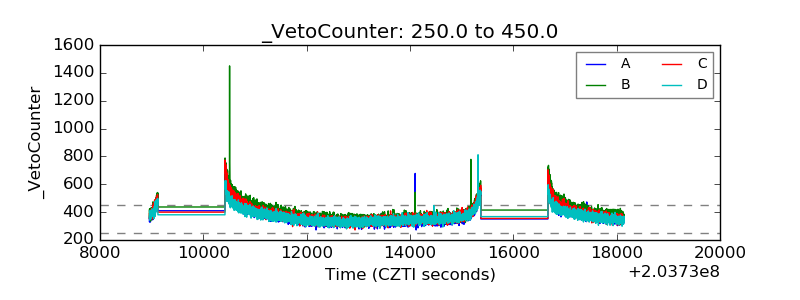 |