| Param | Original file | Final file |
|---|---|---|
| Filename | modeM0/AS1G05_083T01_9000000494_03880cztM0_level2.evt | modeM0/AS1G05_083T01_9000000494_03880cztM0_level2_quad_clean.evt |
| Size (bytes) | 460,840,320 | 78,206,400 |
| Size | 439.5 MB | 74.6 MB |
| Events in quadrant A | 3,221,511 | 486,030 |
| Events in quadrant B | 3,154,124 | 496,613 |
| Events in quadrant C | 3,388,641 | 486,055 |
| Events in quadrant D | 3,762,812 | 458,392 |
| Mode M0 | |||
|---|---|---|---|
| Quadrant | BADHDUFLAG | Total packets | Discarded packets |
| A | 0 | 13937 | 3 |
| B | 0 | 13523 | 2 |
| C | 0 | 14539 | 2 |
| D | 0 | 15906 | 2 |
| Mode M9 | |||
|---|---|---|---|
| Quadrant | BADHDUFLAG | Total packets | Discarded packets |
| A | 0 | 21 | 0 |
| B | 0 | 21 | 0 |
| C | 0 | 21 | 0 |
| D | 0 | 22 | 0 |
| Mode SS | |||
|---|---|---|---|
| Quadrant | BADHDUFLAG | Total packets | Discarded packets |
| A | 0 | 128 | 0 |
| B | 0 | 128 | 0 |
| C | 0 | 128 | 0 |
| D | 0 | 128 | 0 |
| Quadrant | Total seconds | Saturated seconds | Saturation percentage |
|---|---|---|---|
| A | 6317 | 174 | 2.754472% |
| B | 6317 | 113 | 1.788824% |
| C | 6317 | 95 | 1.503878% |
| D | 6317 | 302 | 4.780750% |
Noise dominated data is calculated using 1-second bins in cleaned event files. If a bin has >2000 counts, and if more than 50% of those come from <1% of pixels, then it is considered to be noise-dominated and hence unusable.
| Quadrant | # 1 sec bins | Bins with >0 counts | Bins with >2000 counts | High rate bins dominated by noise | Noise dominated (total time) | Noise dominated (detector-on time) | Marked lightcurve |
|---|---|---|---|---|---|---|---|
| A | 7567 | 6317 | 83 | 83 | 1.10% | 1.31% | 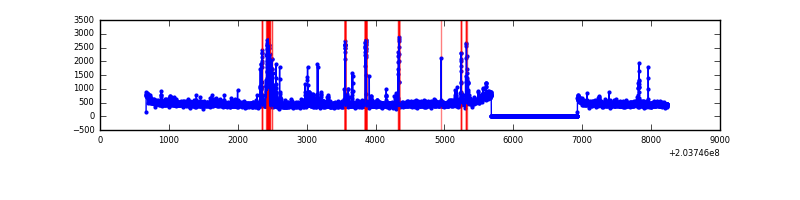 |
| B | 7567 | 6317 | 11 | 11 | 0.15% | 0.17% |  |
| C | 7567 | 6317 | 28 | 28 | 0.37% | 0.44% | 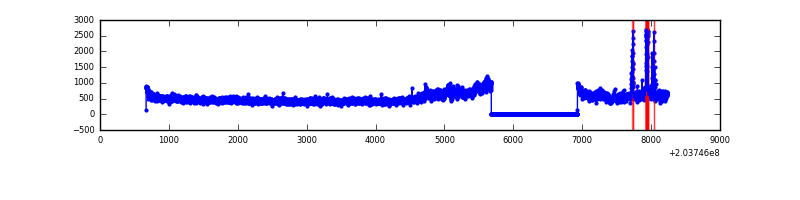 |
| D | 7567 | 6317 | 277 | 277 | 3.66% | 4.38% |  |
Top three noisy pixels from each quadrant. If the there are fewer than three noisy pixels in the level2.evt file, extra rows are filled as -1
| Pixel properties | Quadrant properties | ||||||
|---|---|---|---|---|---|---|---|
| Quadrant | DetID | PixID | Counts | Sigma | Mean | Median | Sigma |
| A | 0 | 118 | 220201 | 1497.34 | 730 | 714 | 146.6 |
| A | 15 | 174 | 93822 | 635.18 | 730 | 714 | 146.6 |
| A | 0 | 50 | 49975 | 336.06 | 730 | 714 | 146.6 |
| B | 15 | 204 | 106732 | 757.23 | 744 | 728 | 140.0 |
| B | 4 | 81 | 54306 | 382.73 | 744 | 728 | 140.0 |
| B | 5 | 172 | 42543 | 298.7 | 744 | 728 | 140.0 |
| C | 2 | 53 | 517439 | 3171.66 | 706 | 709 | 162.9 |
| C | 1 | 16 | 59257 | 359.36 | 706 | 709 | 162.9 |
| C | 12 | 4 | 42194 | 254.63 | 706 | 709 | 162.9 |
| D | 14 | 34 | 955446 | 5667.49 | 697 | 677 | 168.5 |
| D | 13 | 248 | 49764 | 291.38 | 697 | 677 | 168.5 |
| D | 2 | 118 | 35389 | 206.05 | 697 | 677 | 168.5 |
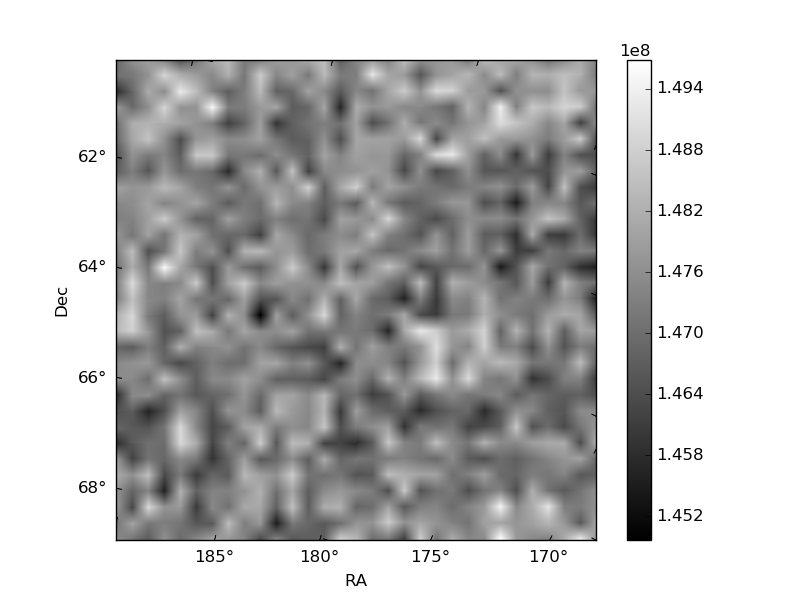
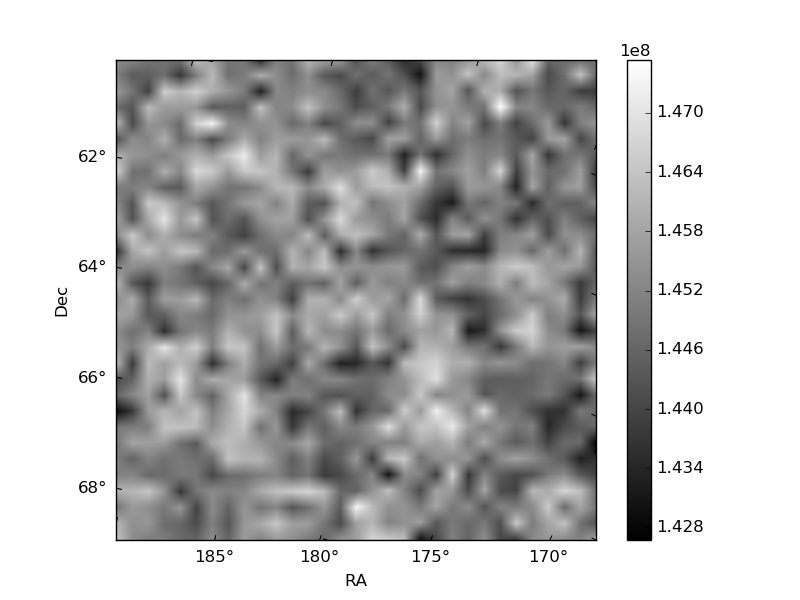
Histogram calculated using DETX and DETY for each event in the final _common_clean file
| Quadrant A | 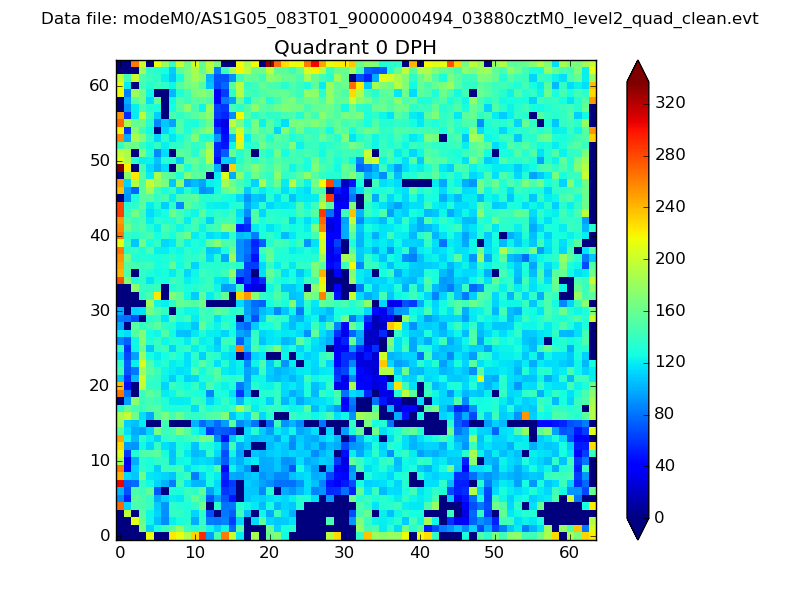 |
 |
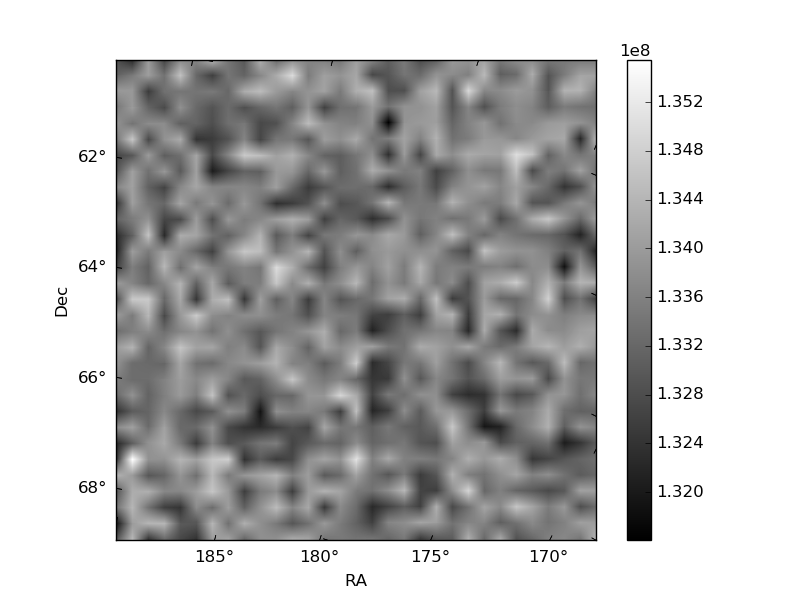
Quadrant B |
|---|---|---|---|
| Quadrant D | 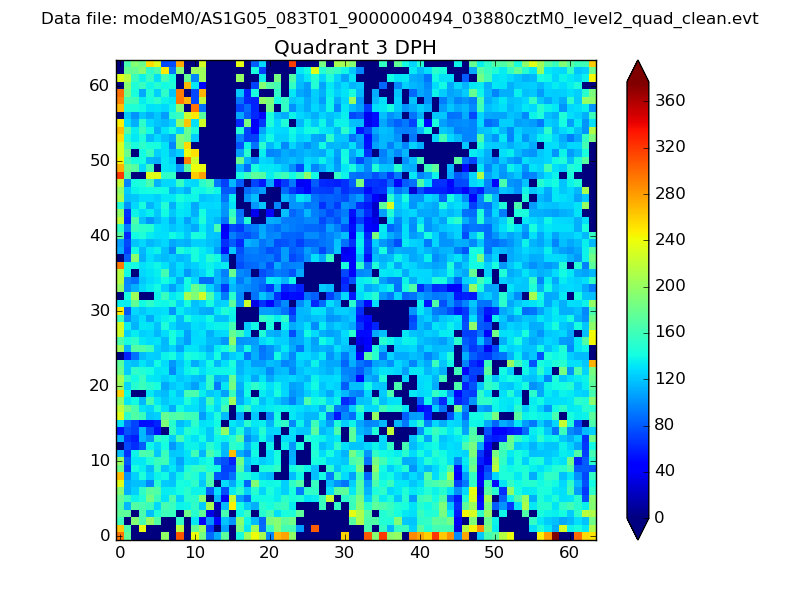 |
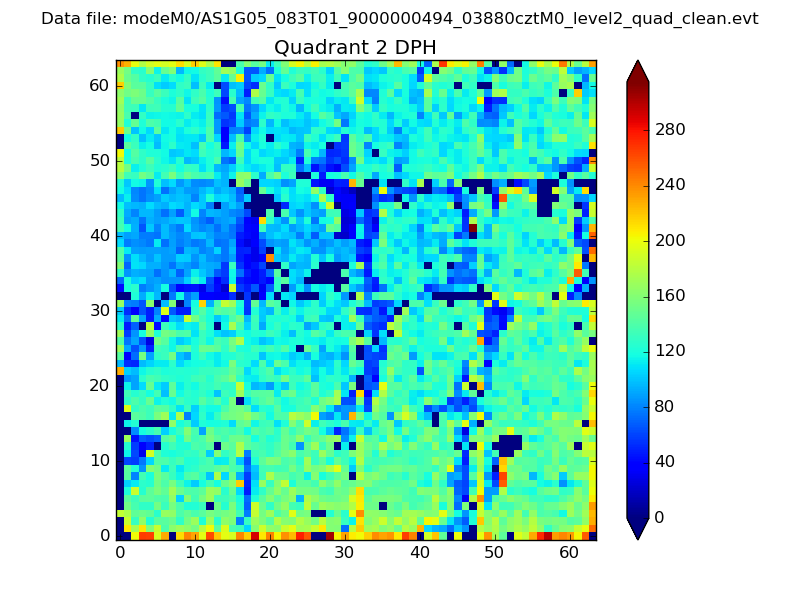 |
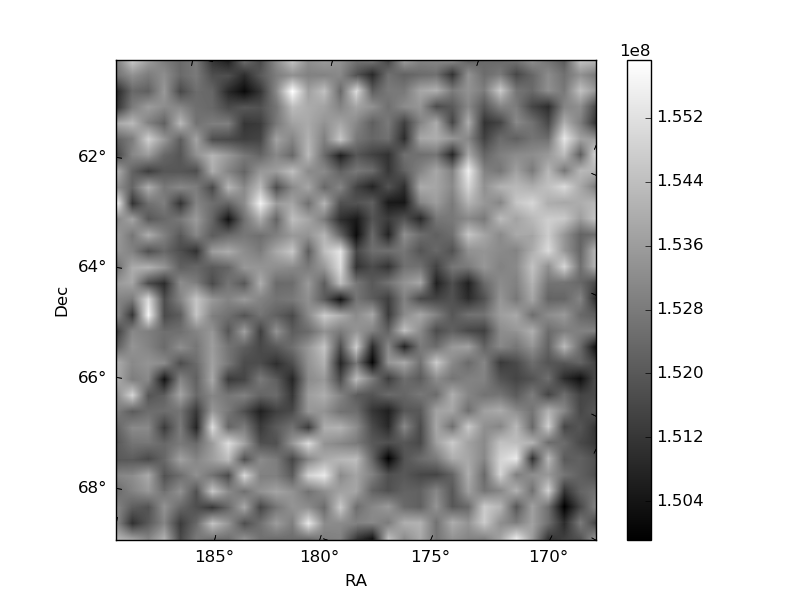
Quadrant C |
| Plot type | Count rate plots | Images |
|---|---|---|
| Comparison with Poisson distribution Blue bars denote a histogram of data divided into 1 sec bins. Red curve is a Poisson curve with rate = median count rate of data. |
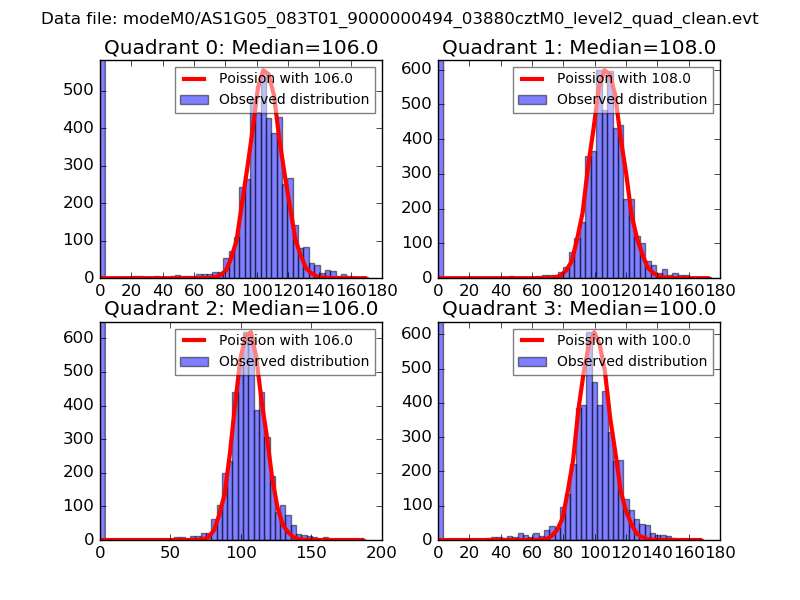 |
 |
| Quadrant-wise count rates Data is divided into 100 sec bins |
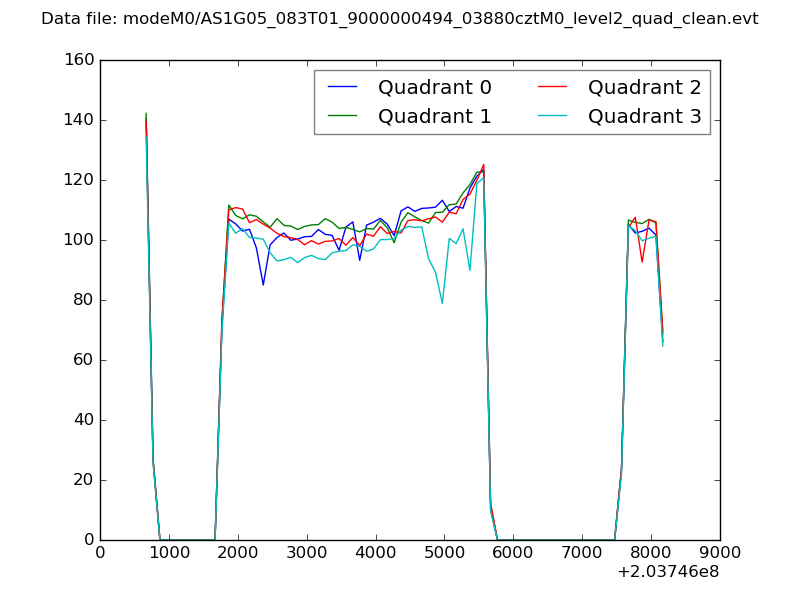 |
|
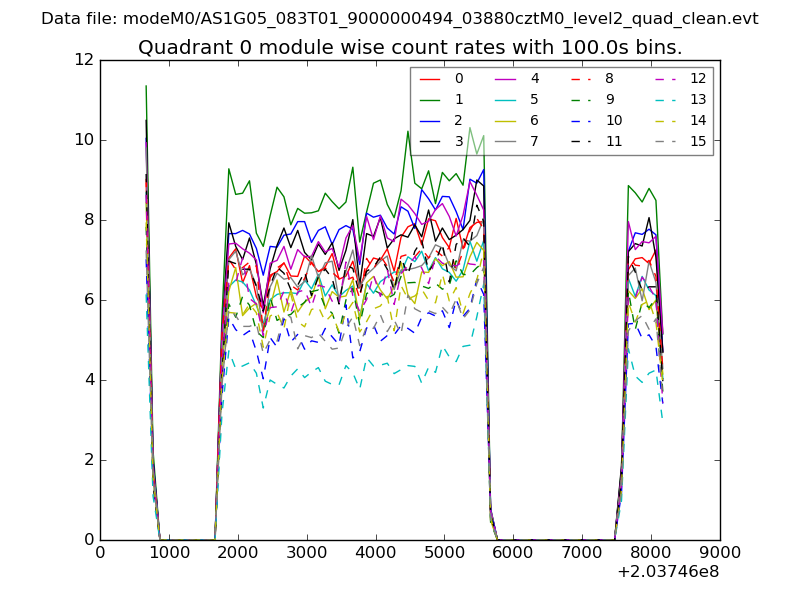
| Module-wise count rates for Quadrant A Data is divided into 100 sec bins |
 |
 |
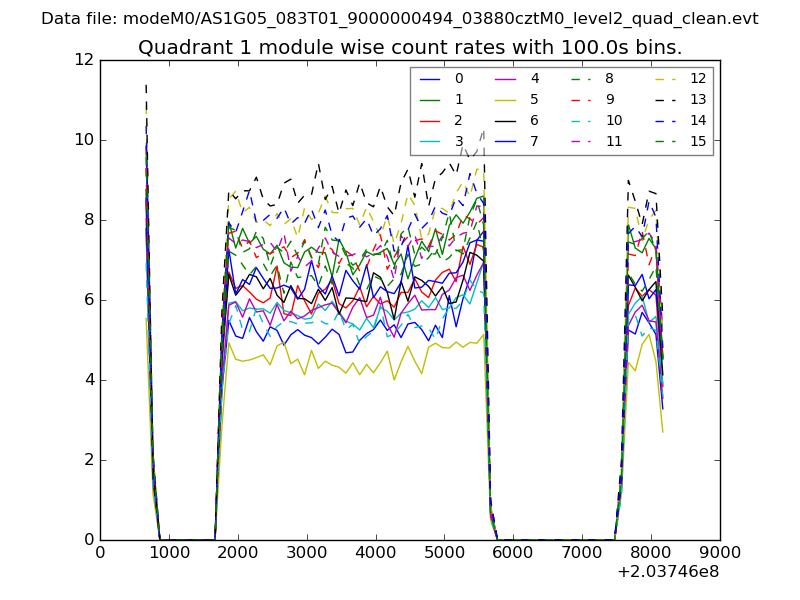
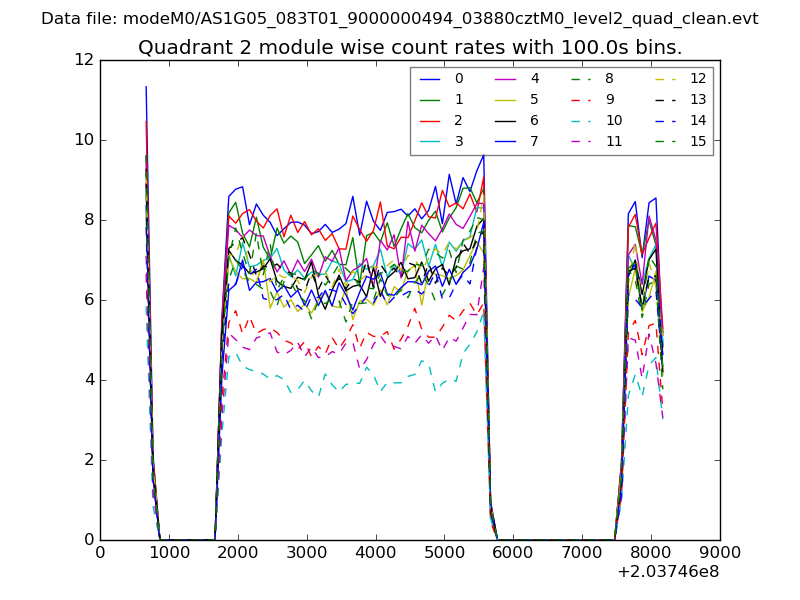
| Module-wise count rates for Quadrant B Data is divided into 100 sec bins |
 |
 |
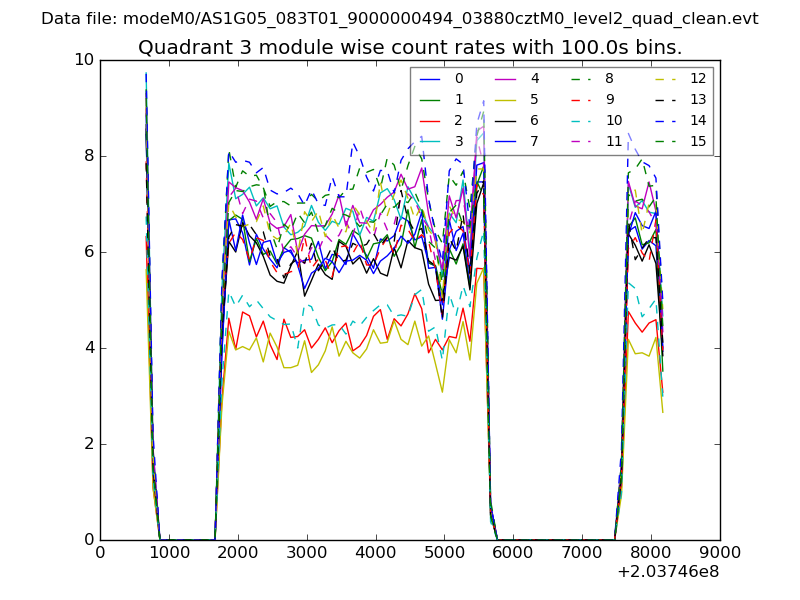
| Module-wise count rates for Quadrant C Data is divided into 100 sec bins |
 |
 |
| Module-wise count rates for Quadrant D Data is divided into 100 sec bins |
 |
 |
| Parameter | Plot |
|---|---|
| CZT HV Monitor | 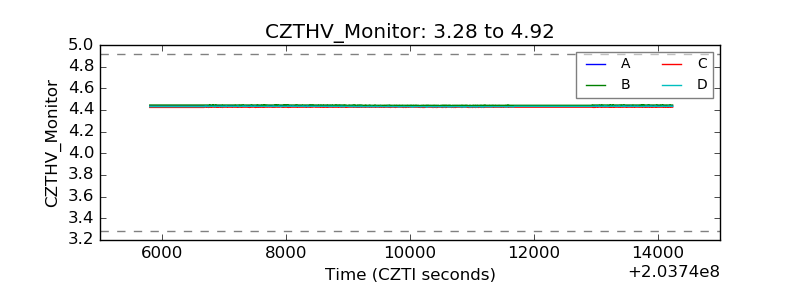 |
| D_VDD | 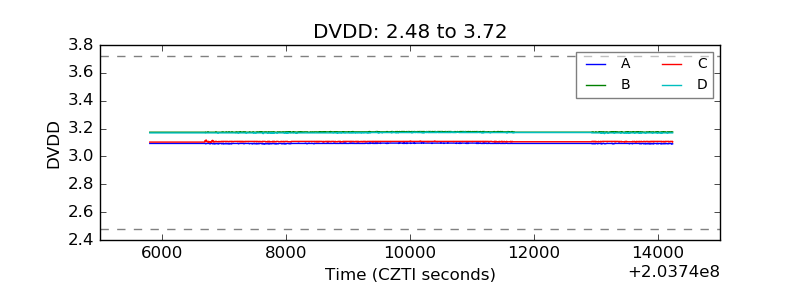 |
| Temperature 1 |  |
| Veto HV Monitor | 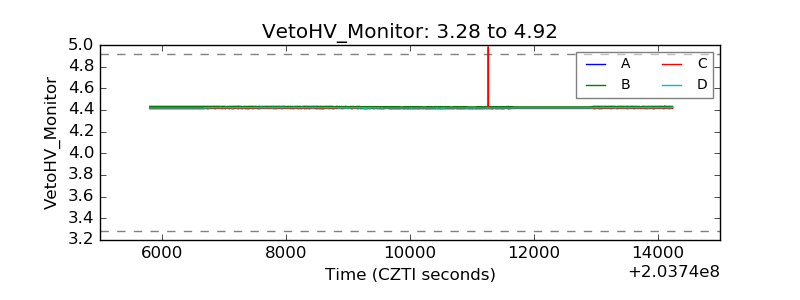 |
| Veto LLD | 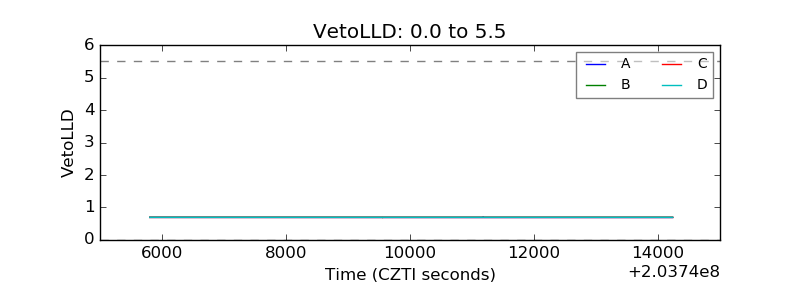 |
| Alpha Counter | 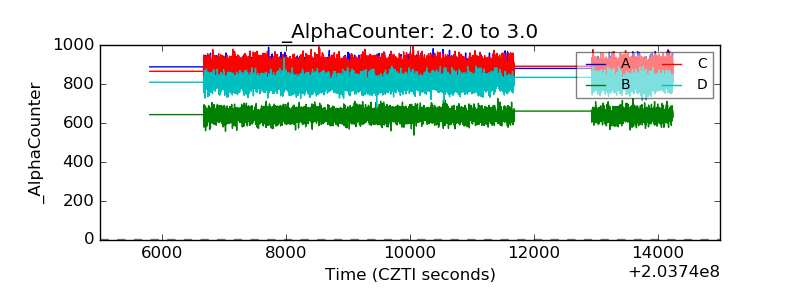 |
| _CPM_Rate | 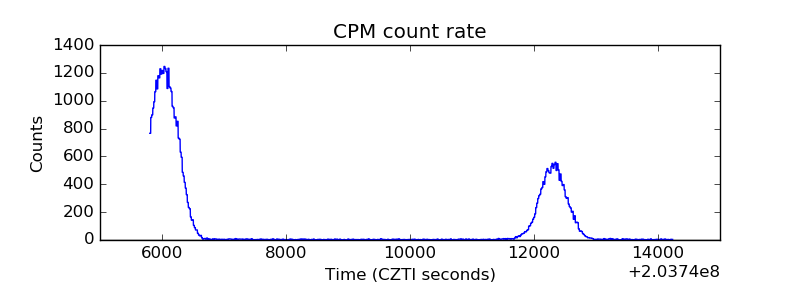 |
| CZT Counter | 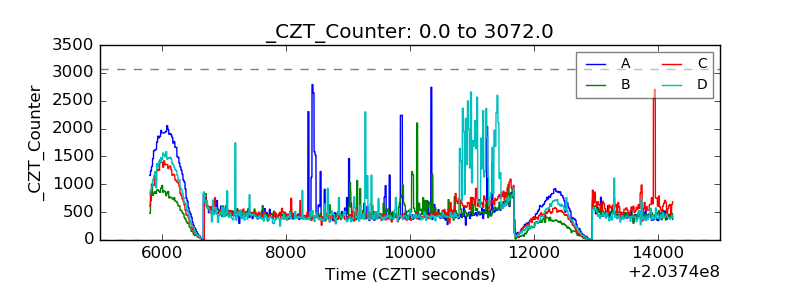 |
| +2.5 Volts monitor |  |
| +5 Volts monitor |  |
| Veto Counter |  |