| Param | Original file | Final file |
|---|---|---|
| Filename | modeM0/AS1G05_083T01_9000000494_03881cztM0_level2.evt | modeM0/AS1G05_083T01_9000000494_03881cztM0_level2_quad_clean.evt |
| Size (bytes) | 447,678,720 | 90,668,160 |
| Size | 426.9 MB | 86.5 MB |
| Events in quadrant A | 3,068,219 | 577,622 |
| Events in quadrant B | 3,222,786 | 579,877 |
| Events in quadrant C | 3,562,520 | 567,933 |
| Events in quadrant D | 3,250,600 | 555,228 |
| Mode M0 | |||
|---|---|---|---|
| Quadrant | BADHDUFLAG | Total packets | Discarded packets |
| A | 0 | 13951 | 3 |
| B | 0 | 14136 | 2 |
| C | 0 | 15417 | 2 |
| D | 0 | 14704 | 2 |
| Mode M9 | |||
|---|---|---|---|
| Quadrant | BADHDUFLAG | Total packets | Discarded packets |
| A | 0 | 17 | 0 |
| B | 0 | 17 | 0 |
| C | 0 | 17 | 0 |
| D | 0 | 18 | 0 |
| Mode SS | |||
|---|---|---|---|
| Quadrant | BADHDUFLAG | Total packets | Discarded packets |
| A | 0 | 134 | 0 |
| B | 0 | 134 | 0 |
| C | 0 | 134 | 0 |
| D | 0 | 134 | 0 |
| Quadrant | Total seconds | Saturated seconds | Saturation percentage |
|---|---|---|---|
| A | 6675 | 140 | 2.097378% |
| B | 6675 | 147 | 2.202247% |
| C | 6675 | 197 | 2.951311% |
| D | 6675 | 129 | 1.932584% |
Noise dominated data is calculated using 1-second bins in cleaned event files. If a bin has >2000 counts, and if more than 50% of those come from <1% of pixels, then it is considered to be noise-dominated and hence unusable.
| Quadrant | # 1 sec bins | Bins with >0 counts | Bins with >2000 counts | High rate bins dominated by noise | Noise dominated (total time) | Noise dominated (detector-on time) | Marked lightcurve |
|---|---|---|---|---|---|---|---|
| A | 7595 | 6675 | 0 | 0 | 0.00% | 0.00% | 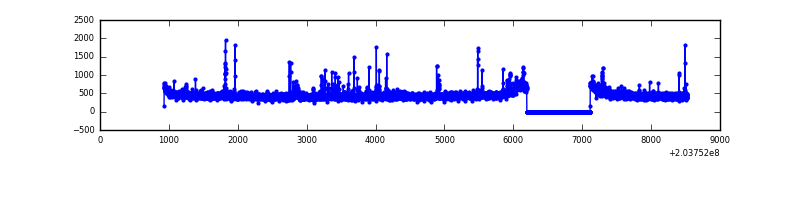 |
| B | 7595 | 6675 | 12 | 12 | 0.16% | 0.18% | 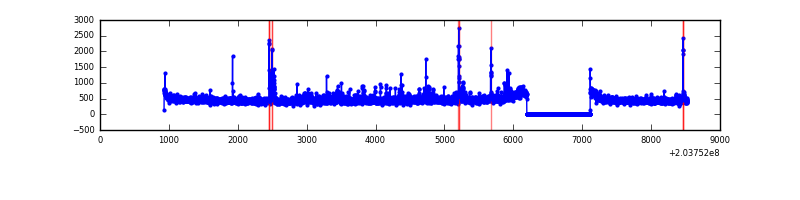 |
| C | 7595 | 6675 | 95 | 95 | 1.25% | 1.42% | 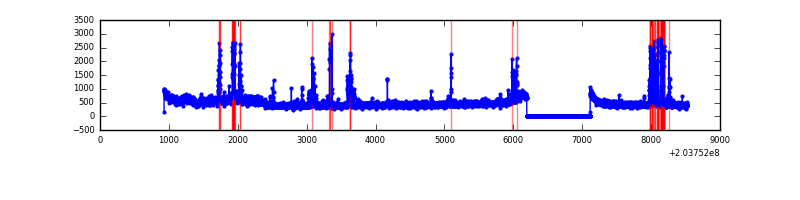 |
| D | 7595 | 6675 | 30 | 30 | 0.39% | 0.45% | 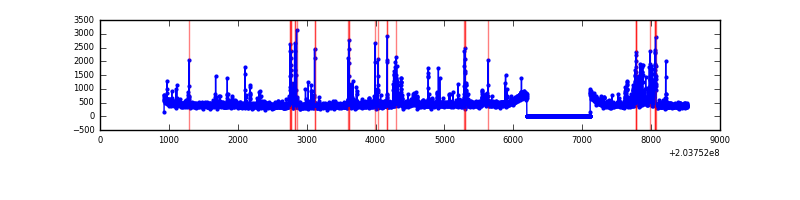 |
Top three noisy pixels from each quadrant. If the there are fewer than three noisy pixels in the level2.evt file, extra rows are filled as -1
| Pixel properties | Quadrant properties | ||||||
|---|---|---|---|---|---|---|---|
| Quadrant | DetID | PixID | Counts | Sigma | Mean | Median | Sigma |
| A | 0 | 118 | 95941 | 618.15 | 758 | 741 | 154.0 |
| A | 0 | 226 | 16801 | 104.28 | 758 | 741 | 154.0 |
| A | 15 | 174 | 13317 | 81.66 | 758 | 741 | 154.0 |
| B | 15 | 204 | 92404 | 626.18 | 766 | 748 | 146.4 |
| B | 10 | 16 | 59035 | 398.21 | 766 | 748 | 146.4 |
| B | 4 | 81 | 35289 | 235.98 | 766 | 748 | 146.4 |
| C | 2 | 53 | 416546 | 2467.25 | 728 | 730 | 168.5 |
| C | 14 | 234 | 99521 | 586.18 | 728 | 730 | 168.5 |
| C | 1 | 16 | 82595 | 485.75 | 728 | 730 | 168.5 |
| D | 14 | 34 | 194372 | 1102.43 | 731 | 709 | 175.7 |
| D | 13 | 248 | 81206 | 458.23 | 731 | 709 | 175.7 |
| D | 13 | 223 | 38550 | 215.41 | 731 | 709 | 175.7 |
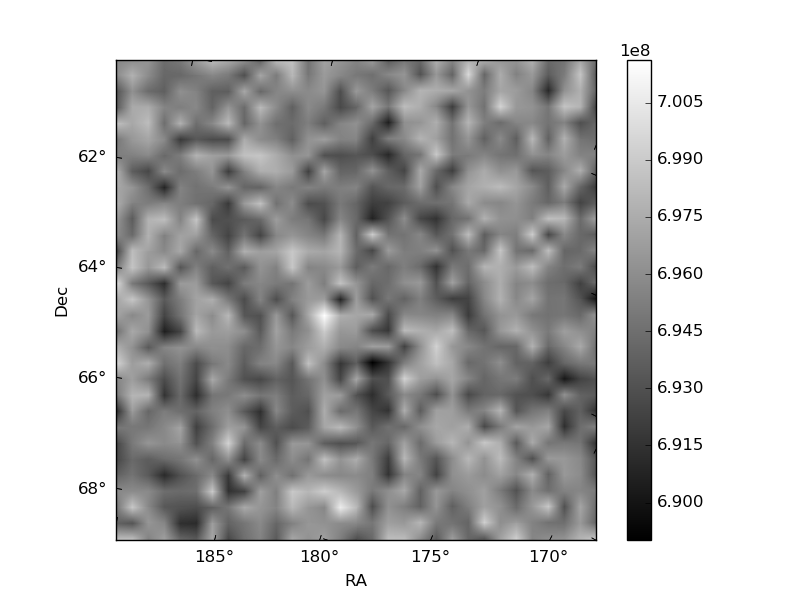
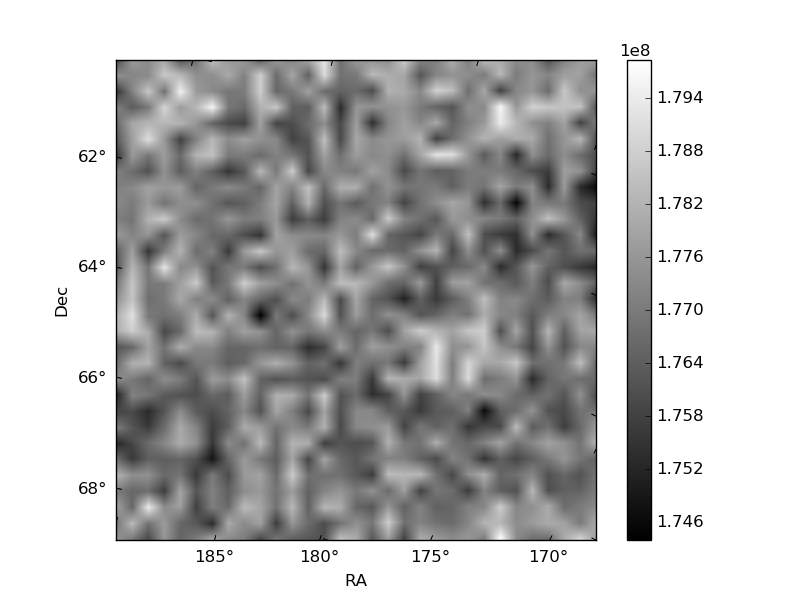
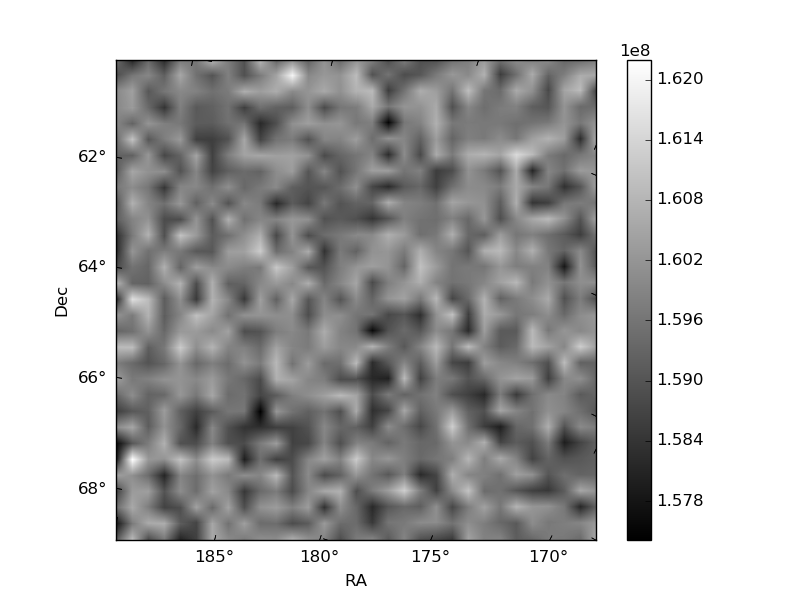
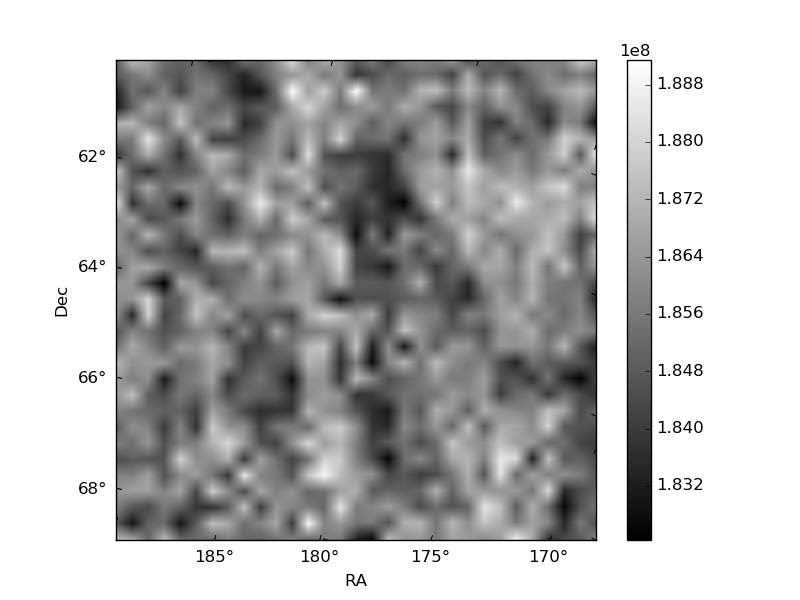
Histogram calculated using DETX and DETY for each event in the final _common_clean file
| Quadrant A | 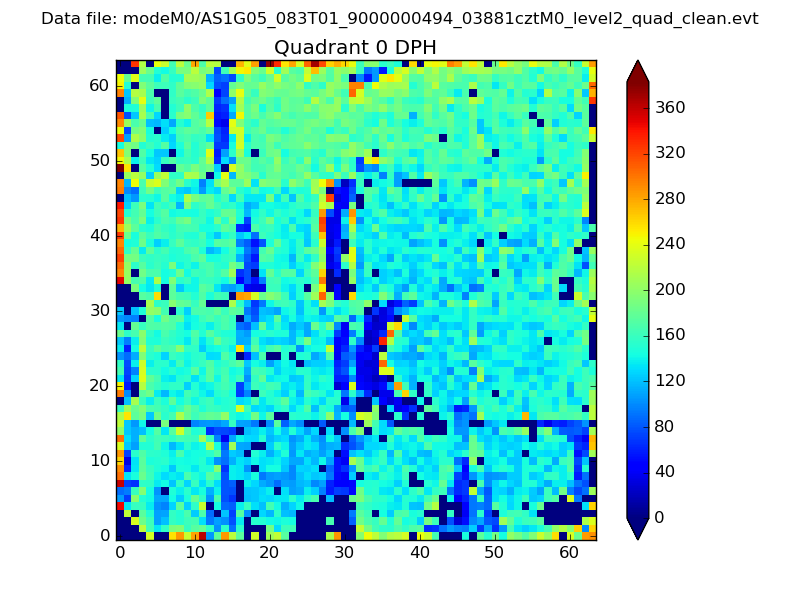 |
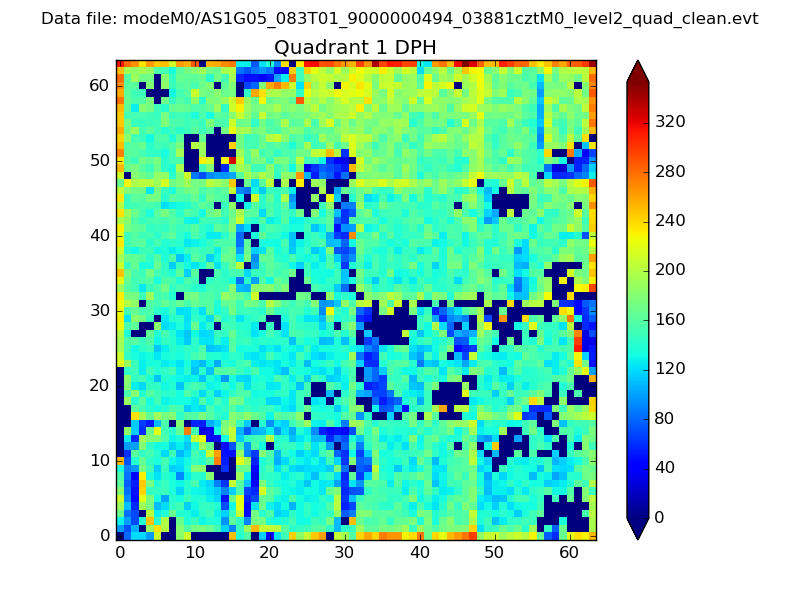 |
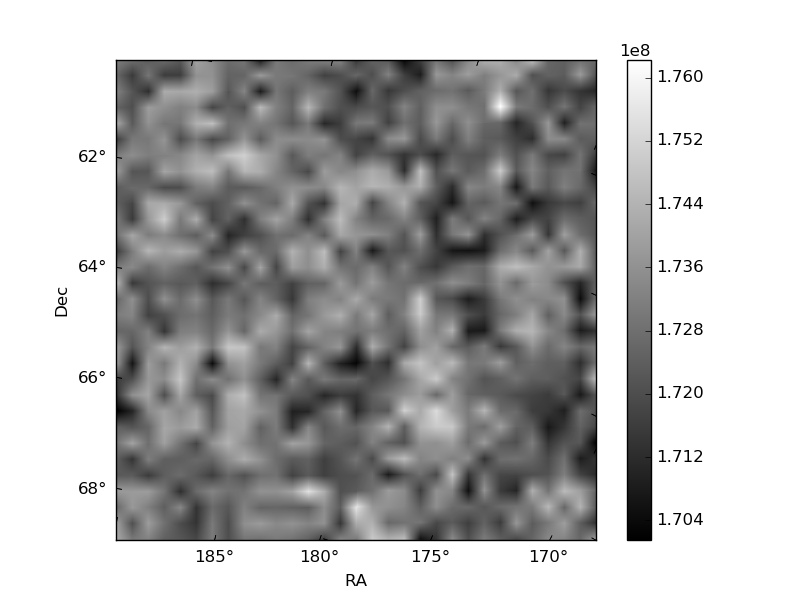
Quadrant B |
|---|---|---|---|
| Quadrant D | 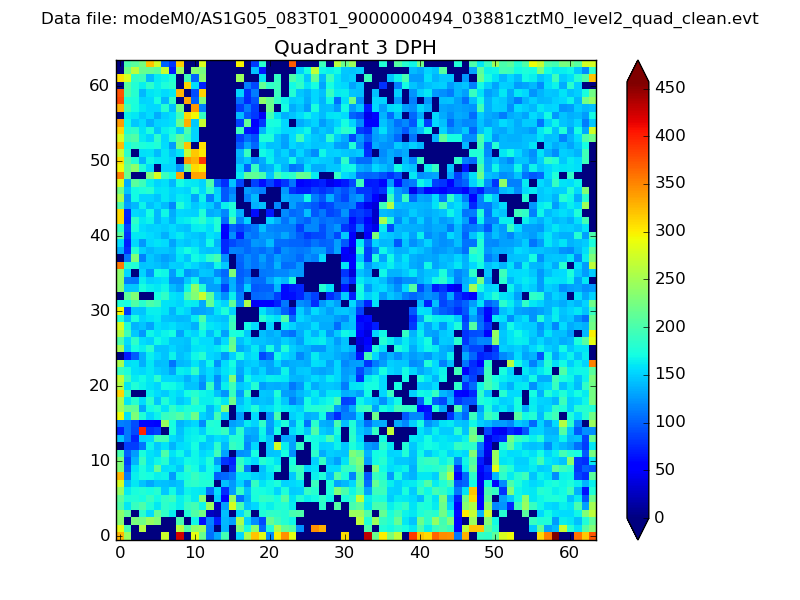 |
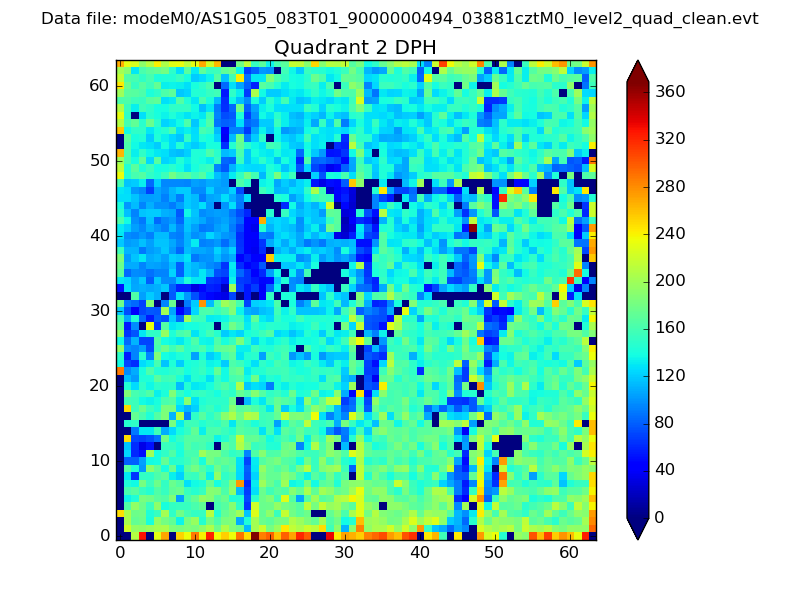 |
Quadrant C |
| Plot type | Count rate plots | Images |
|---|---|---|
| Comparison with Poisson distribution Blue bars denote a histogram of data divided into 1 sec bins. Red curve is a Poisson curve with rate = median count rate of data. |
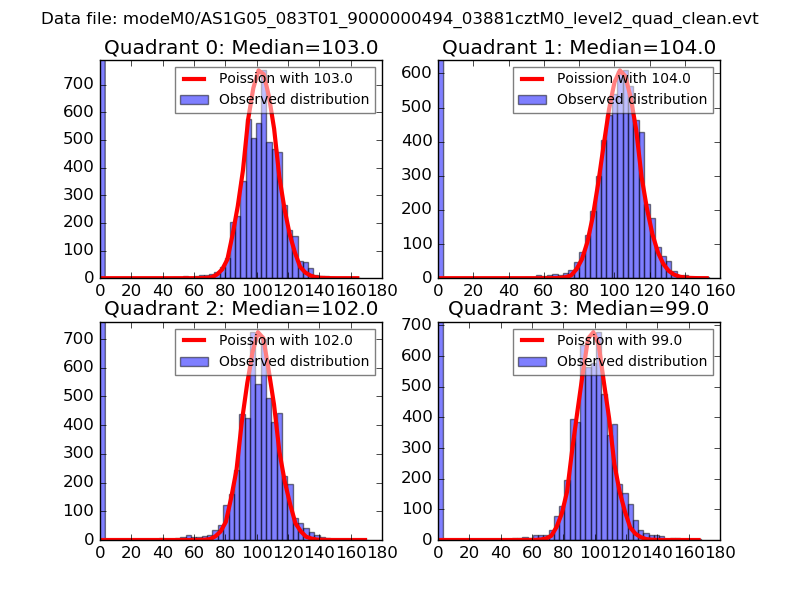 |
 |
| Quadrant-wise count rates Data is divided into 100 sec bins |
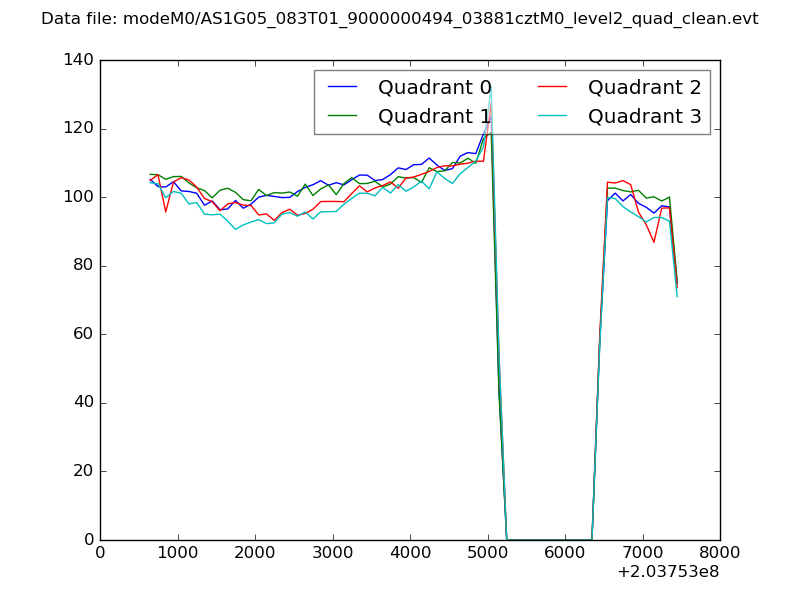 |
|
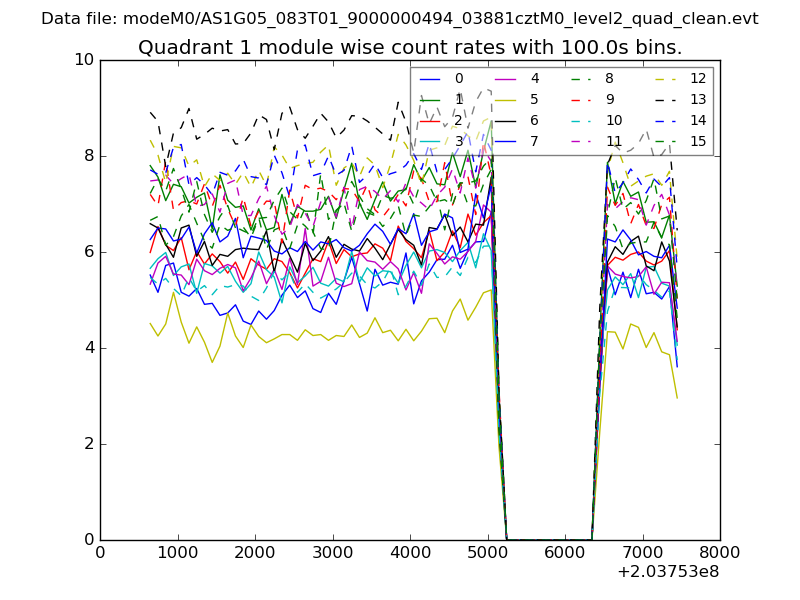
| Module-wise count rates for Quadrant A Data is divided into 100 sec bins |
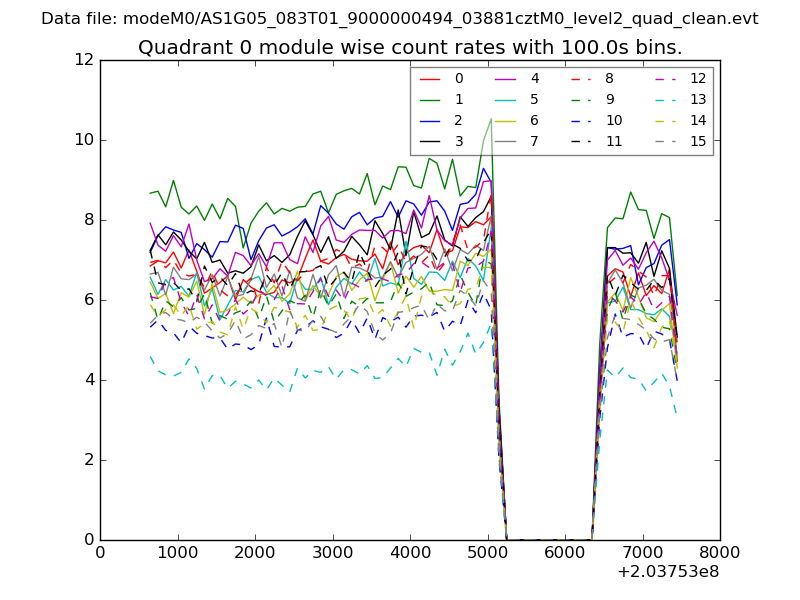 |
 |
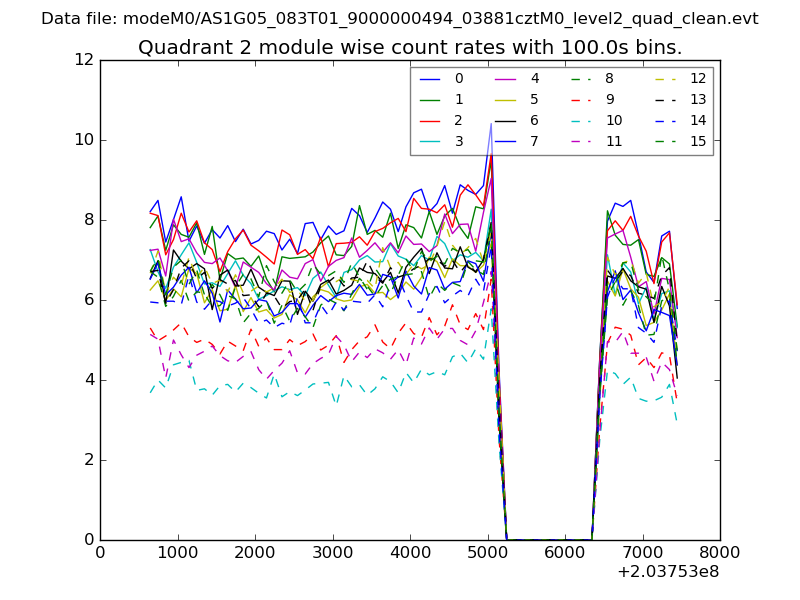
| Module-wise count rates for Quadrant B Data is divided into 100 sec bins |
 |
 |
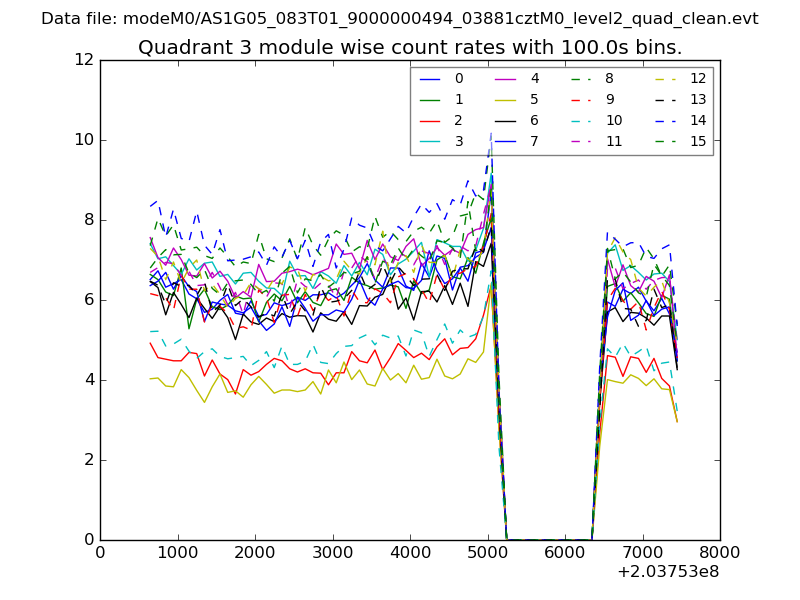
| Module-wise count rates for Quadrant C Data is divided into 100 sec bins |
 |
 |
| Module-wise count rates for Quadrant D Data is divided into 100 sec bins |
 |
 |
| Parameter | Plot |
|---|---|
| CZT HV Monitor | 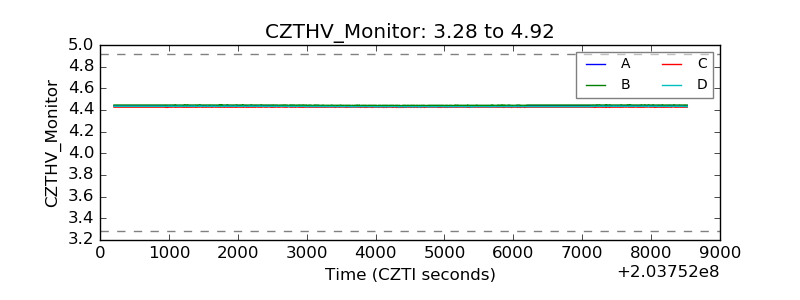 |
| D_VDD | 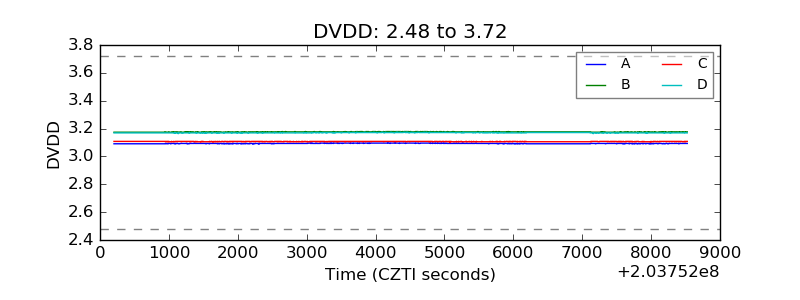 |
| Temperature 1 | 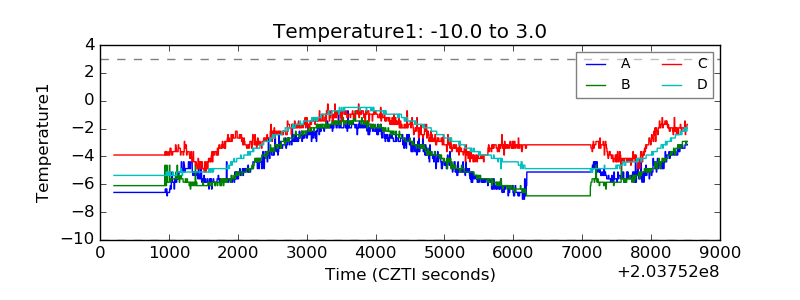 |
| Veto HV Monitor | 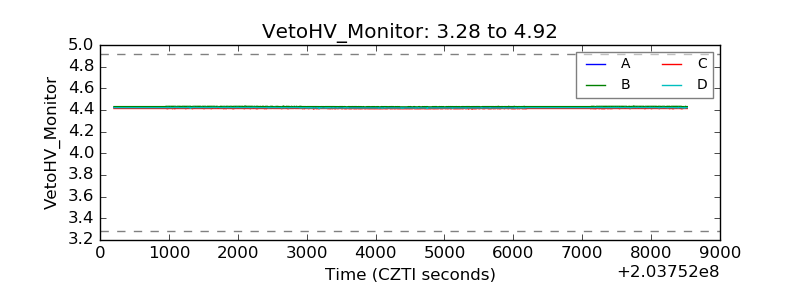 |
| Veto LLD | 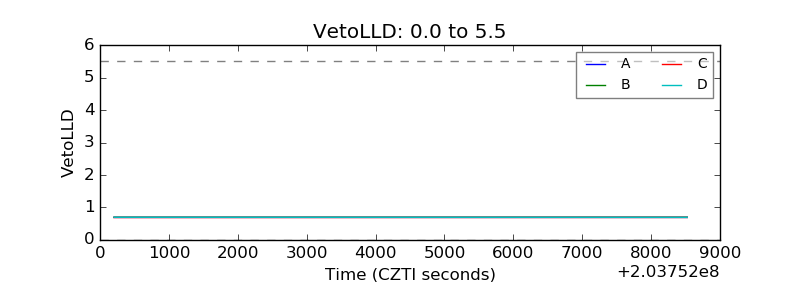 |
| Alpha Counter | 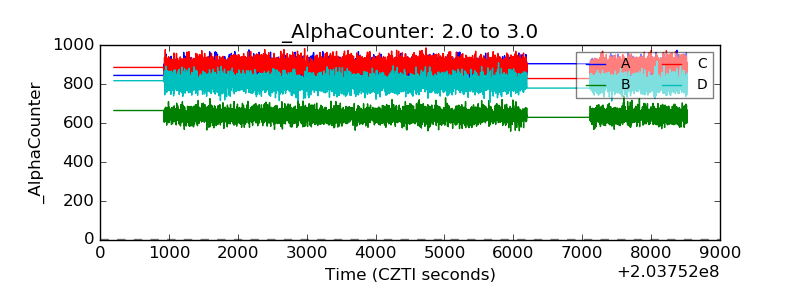 |
| _CPM_Rate | 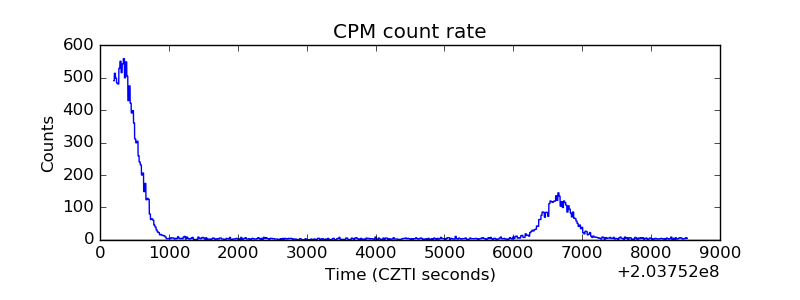 |
| CZT Counter | 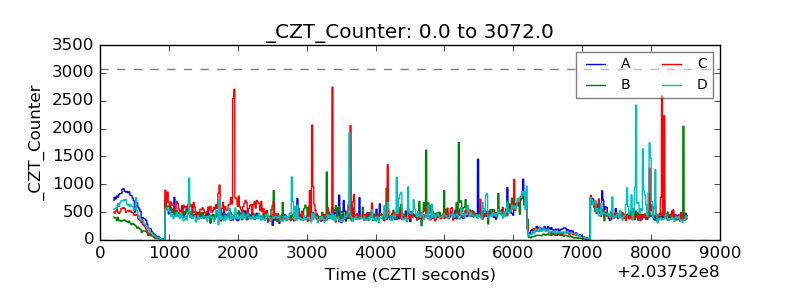 |
| +2.5 Volts monitor |  |
| +5 Volts monitor |  |
| Veto Counter | 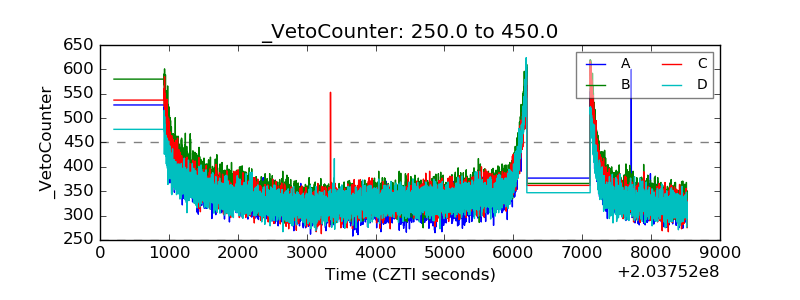 |