| Param | Original file | Final file |
|---|---|---|
| Filename | modeM0/AS1G05_083T01_9000000494_03882cztM0_level2.evt | modeM0/AS1G05_083T01_9000000494_03882cztM0_level2_quad_clean.evt |
| Size (bytes) | 477,688,320 | 99,184,320 |
| Size | 455.6 MB | 94.6 MB |
| Events in quadrant A | 3,392,070 | 632,326 |
| Events in quadrant B | 3,575,181 | 633,938 |
| Events in quadrant C | 3,602,880 | 624,823 |
| Events in quadrant D | 3,404,272 | 608,638 |
| Mode M0 | |||
|---|---|---|---|
| Quadrant | BADHDUFLAG | Total packets | Discarded packets |
| A | 0 | 15379 | 3 |
| B | 0 | 15473 | 2 |
| C | 0 | 15949 | 2 |
| D | 0 | 15704 | 2 |
| Mode M9 | |||
|---|---|---|---|
| Quadrant | BADHDUFLAG | Total packets | Discarded packets |
| A | 0 | 7 | 0 |
| B | 0 | 7 | 0 |
| C | 0 | 7 | 0 |
| D | 0 | 8 | 0 |
| Mode SS | |||
|---|---|---|---|
| Quadrant | BADHDUFLAG | Total packets | Discarded packets |
| A | 0 | 146 | 0 |
| B | 0 | 146 | 0 |
| C | 0 | 146 | 0 |
| D | 0 | 146 | 0 |
| Quadrant | Total seconds | Saturated seconds | Saturation percentage |
|---|---|---|---|
| A | 7243 | 227 | 3.134060% |
| B | 7243 | 169 | 2.333287% |
| C | 7243 | 190 | 2.623222% |
| D | 7243 | 162 | 2.236642% |
Noise dominated data is calculated using 1-second bins in cleaned event files. If a bin has >2000 counts, and if more than 50% of those come from <1% of pixels, then it is considered to be noise-dominated and hence unusable.
| Quadrant | # 1 sec bins | Bins with >0 counts | Bins with >2000 counts | High rate bins dominated by noise | Noise dominated (total time) | Noise dominated (detector-on time) | Marked lightcurve |
|---|---|---|---|---|---|---|---|
| A | 7678 | 7243 | 14 | 14 | 0.18% | 0.19% | 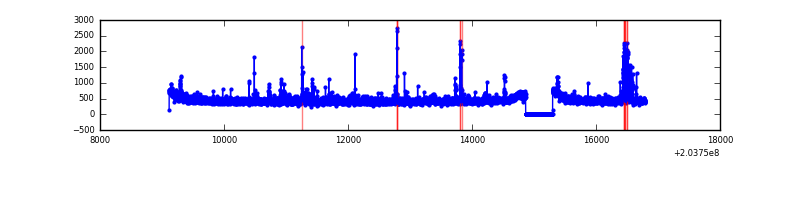 |
| B | 7678 | 7243 | 15 | 15 | 0.20% | 0.21% | 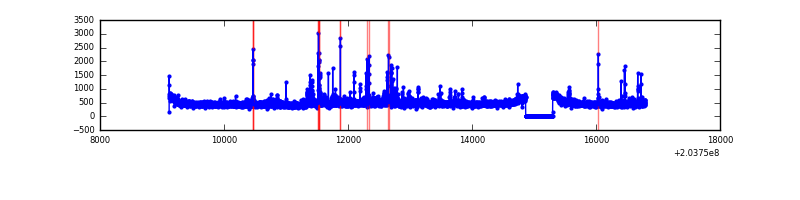 |
| C | 7678 | 7244 | 88 | 88 | 1.15% | 1.21% | 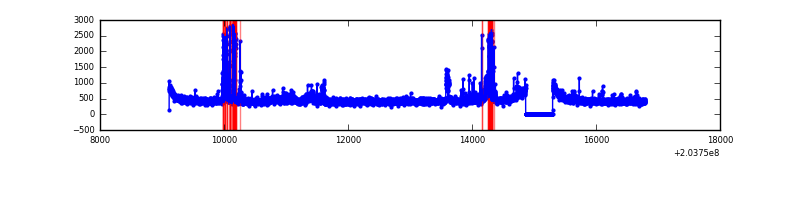 |
| D | 7678 | 7243 | 26 | 26 | 0.34% | 0.36% | 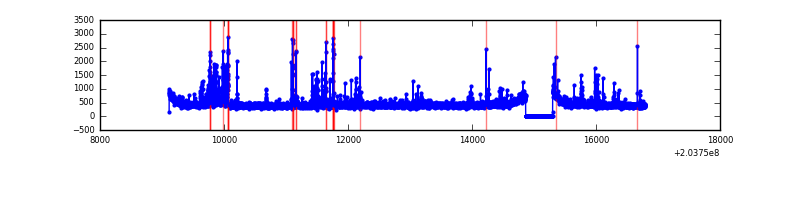 |
Top three noisy pixels from each quadrant. If the there are fewer than three noisy pixels in the level2.evt file, extra rows are filled as -1
| Pixel properties | Quadrant properties | ||||||
|---|---|---|---|---|---|---|---|
| Quadrant | DetID | PixID | Counts | Sigma | Mean | Median | Sigma |
| A | 0 | 118 | 146310 | 877.36 | 810 | 791 | 165.9 |
| A | 0 | 50 | 55976 | 332.72 | 810 | 791 | 165.9 |
| A | 8 | 15 | 34436 | 202.85 | 810 | 791 | 165.9 |
| B | 15 | 204 | 229682 | 1453.31 | 819 | 798 | 157.5 |
| B | 4 | 81 | 55056 | 344.51 | 819 | 798 | 157.5 |
| B | 15 | 54 | 29951 | 185.11 | 819 | 798 | 157.5 |
| C | 2 | 53 | 371256 | 2042.09 | 783 | 785 | 181.4 |
| C | 14 | 234 | 99594 | 544.65 | 783 | 785 | 181.4 |
| C | 14 | 67 | 34134 | 183.82 | 783 | 785 | 181.4 |
| D | 14 | 34 | 168905 | 876.03 | 786 | 760 | 191.9 |
| D | 13 | 248 | 68253 | 351.64 | 786 | 760 | 191.9 |
| D | 13 | 239 | 47038 | 241.11 | 786 | 760 | 191.9 |
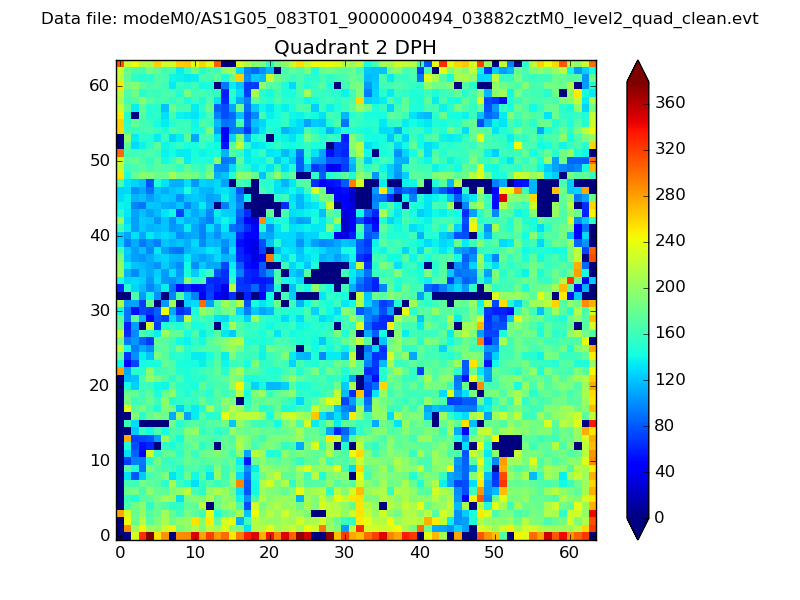
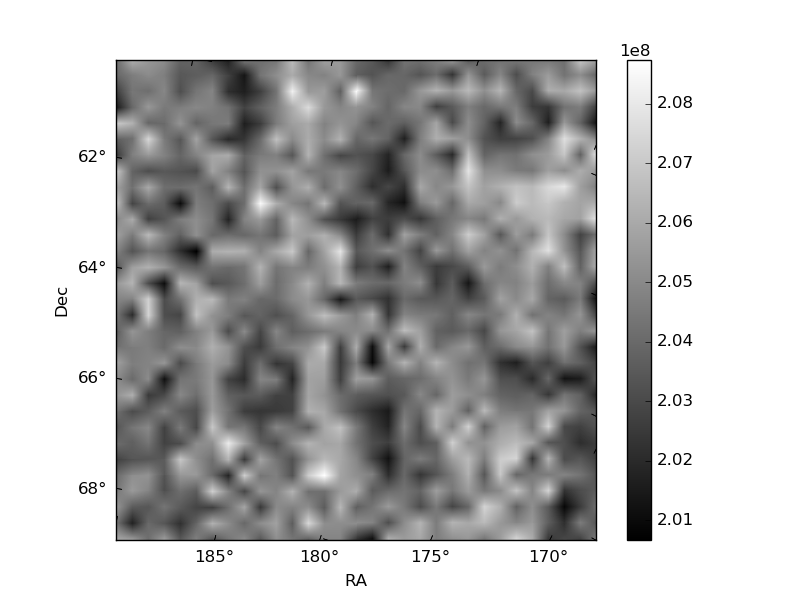
Histogram calculated using DETX and DETY for each event in the final _common_clean file
| Quadrant A | 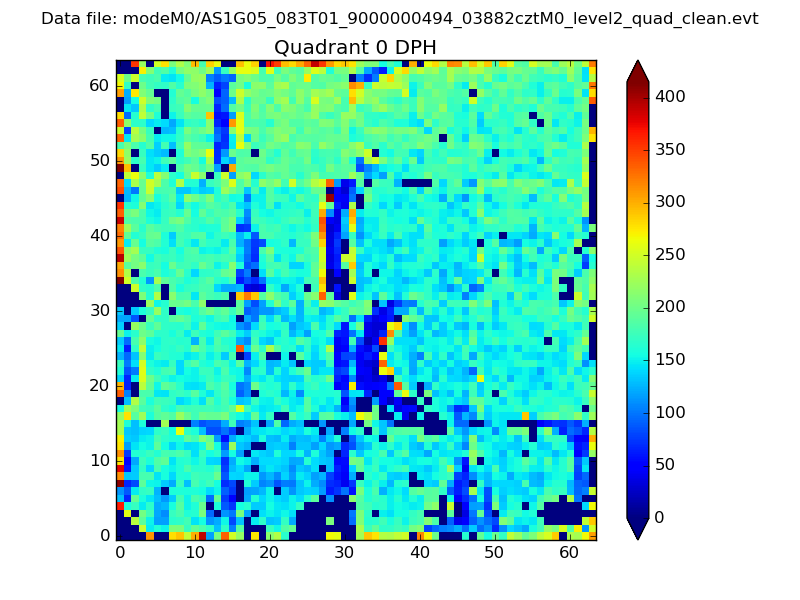 |
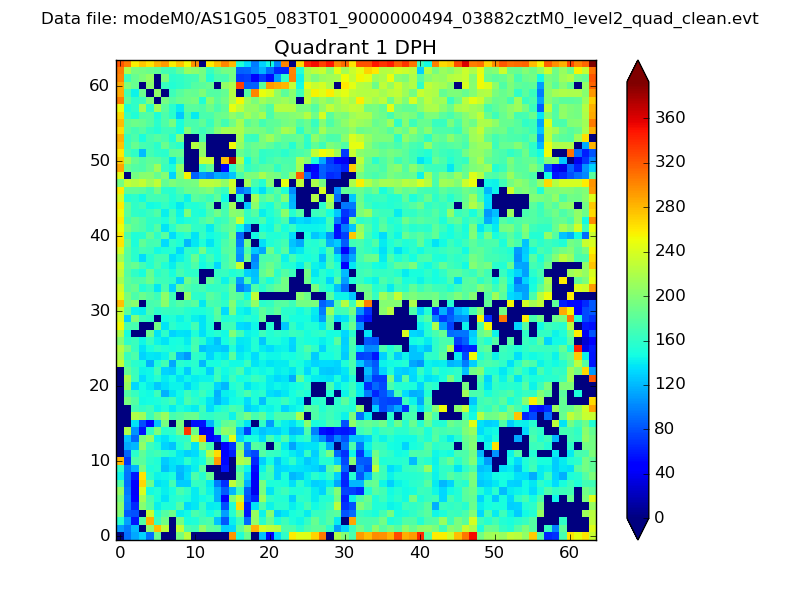 |
Quadrant B |
|---|---|---|---|
| Quadrant D | 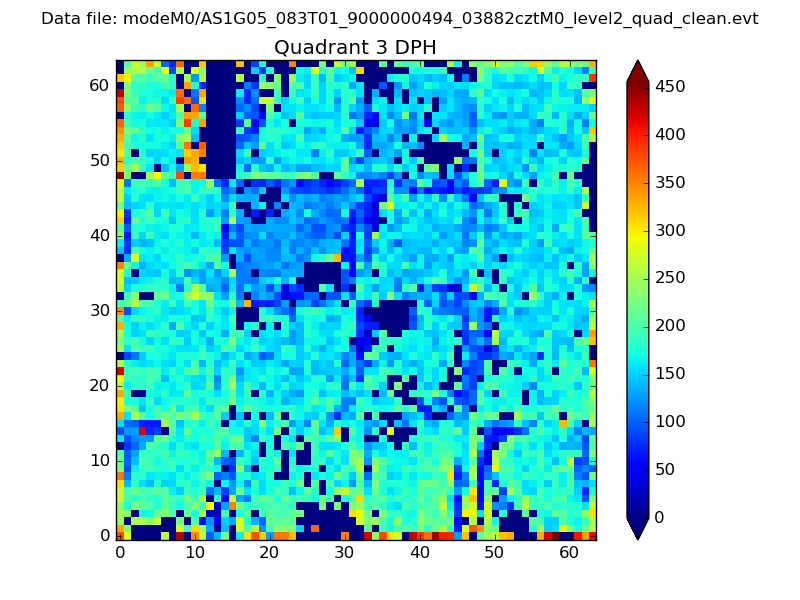 |
 |
Quadrant C |
| Plot type | Count rate plots | Images |
|---|---|---|
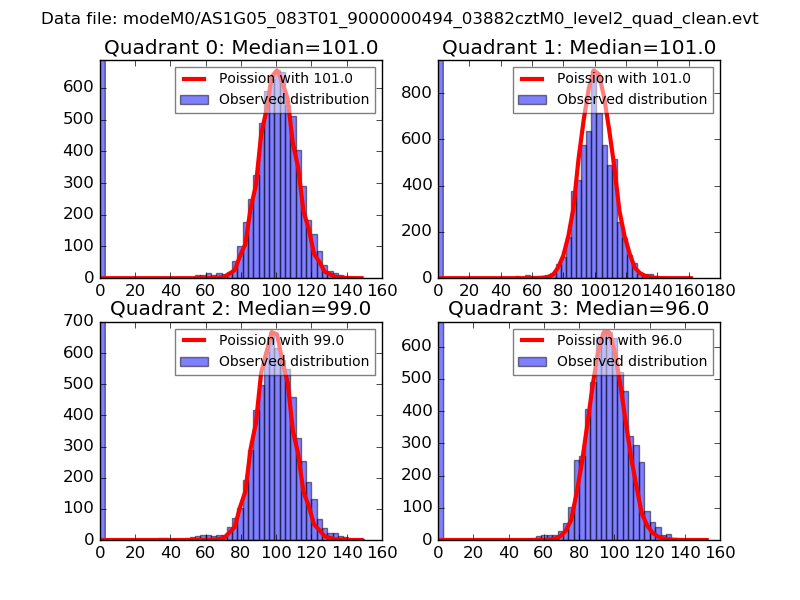
| Comparison with Poisson distribution Blue bars denote a histogram of data divided into 1 sec bins. Red curve is a Poisson curve with rate = median count rate of data. |
 |
 |
| Quadrant-wise count rates Data is divided into 100 sec bins |
 |
|
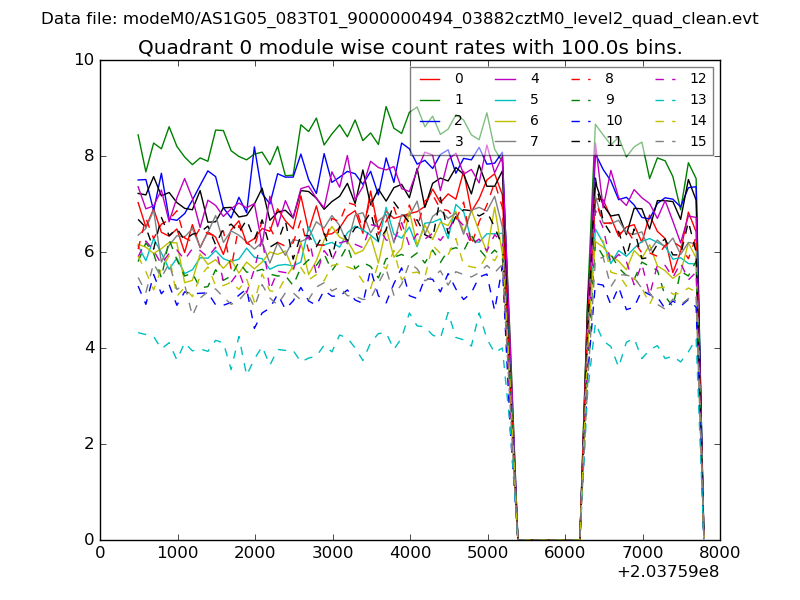
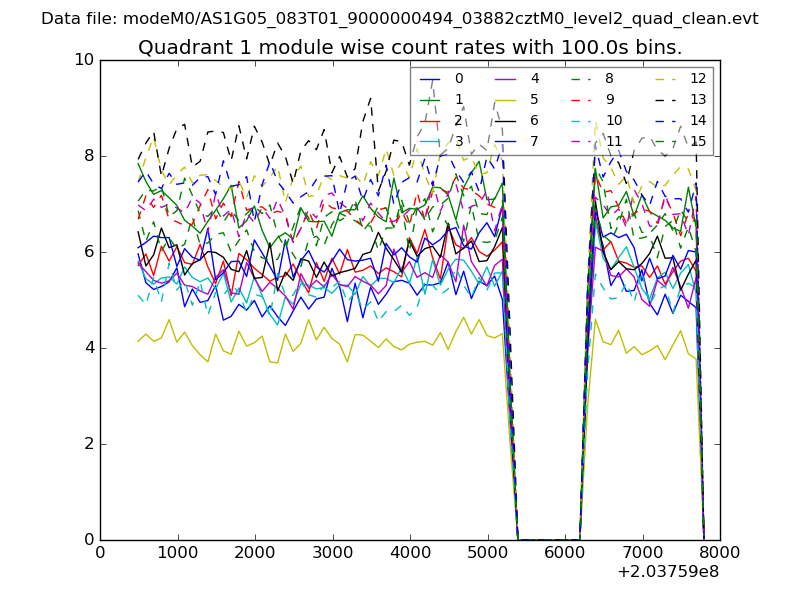
| Module-wise count rates for Quadrant A Data is divided into 100 sec bins |
 |
 |
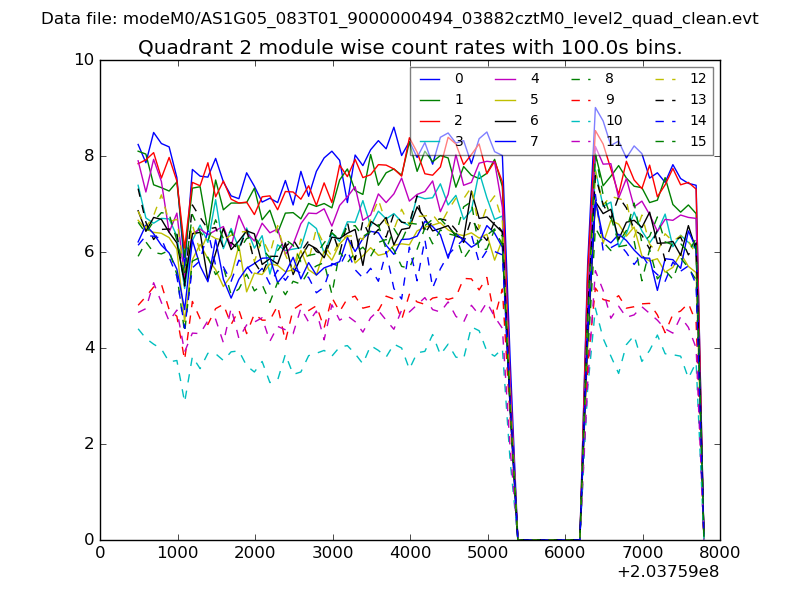
| Module-wise count rates for Quadrant B Data is divided into 100 sec bins |
 |
 |
| Module-wise count rates for Quadrant C Data is divided into 100 sec bins |
 |
 |
| Module-wise count rates for Quadrant D Data is divided into 100 sec bins |
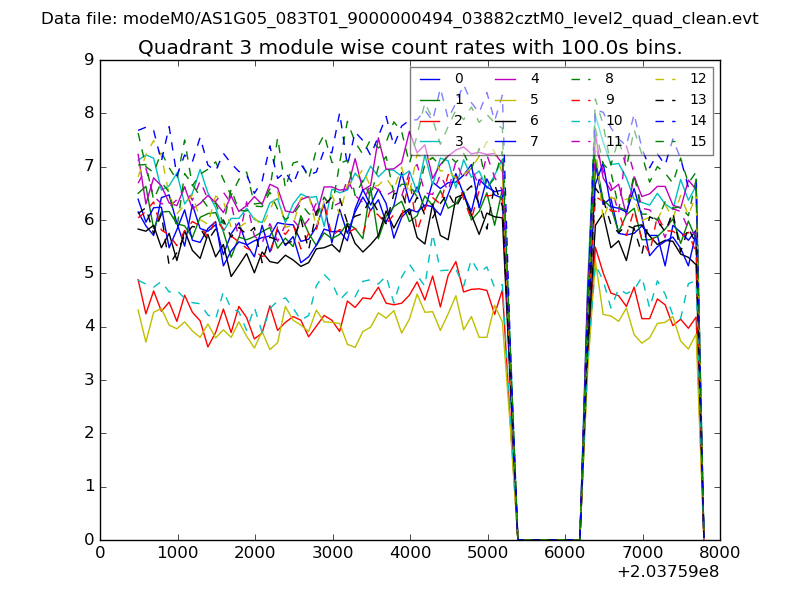 |
 |
| Parameter | Plot |
|---|---|
| CZT HV Monitor | 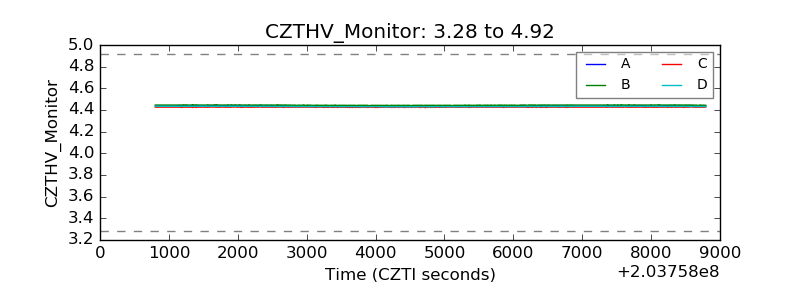 |
| D_VDD | 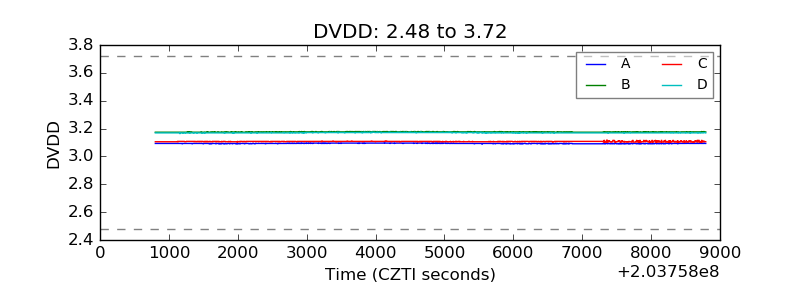 |
| Temperature 1 | 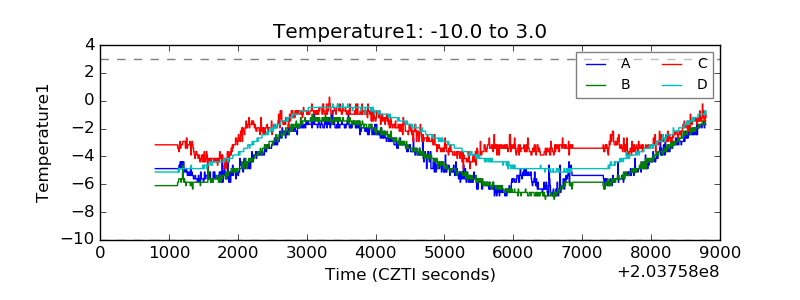 |
| Veto HV Monitor | 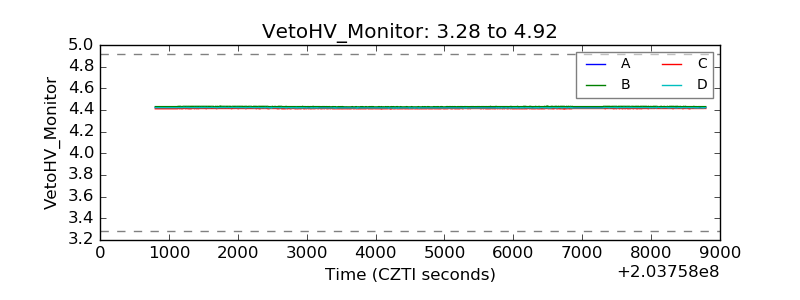 |
| Veto LLD | 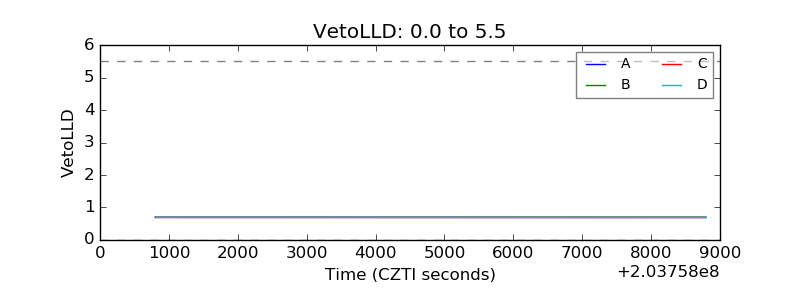 |
| Alpha Counter |  |
| _CPM_Rate | 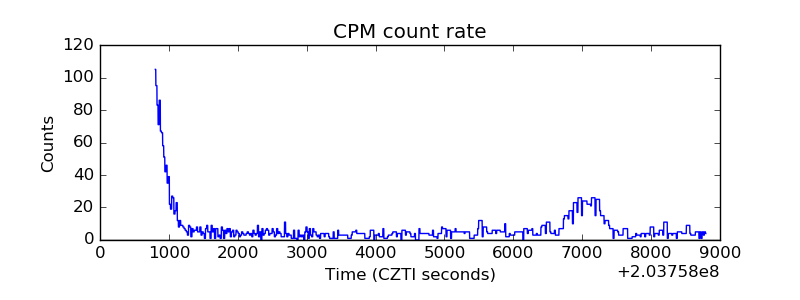 |
| CZT Counter | 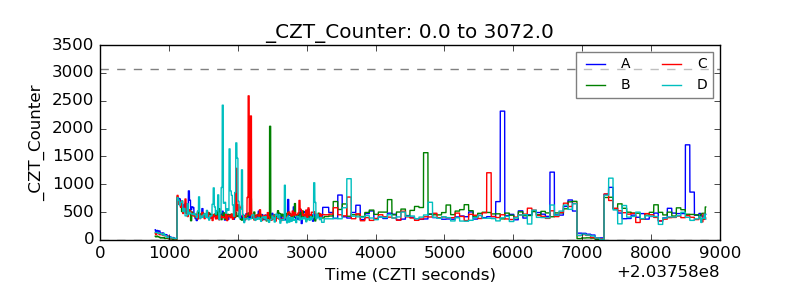 |
| +2.5 Volts monitor |  |
| +5 Volts monitor |  |
| Veto Counter | 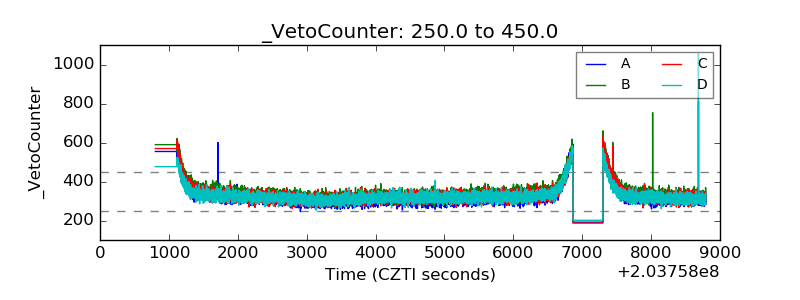 |