| Param | Original file | Final file |
|---|---|---|
| Filename | modeM0/AS1G05_083T01_9000000494_03883cztM0_level2.evt | modeM0/AS1G05_083T01_9000000494_03883cztM0_level2_quad_clean.evt |
| Size (bytes) | 521,714,880 | 107,959,680 |
| Size | 497.5 MB | 103.0 MB |
| Events in quadrant A | 3,747,150 | 686,236 |
| Events in quadrant B | 3,919,214 | 691,167 |
| Events in quadrant C | 3,609,091 | 684,841 |
| Events in quadrant D | 3,987,065 | 657,181 |
| Mode M0 | |||
|---|---|---|---|
| Quadrant | BADHDUFLAG | Total packets | Discarded packets |
| A | 0 | 16931 | 2 |
| B | 0 | 17024 | 1 |
| C | 0 | 16624 | 1 |
| D | 0 | 18050 | 1 |
| Mode M9 | |||
|---|---|---|---|
| Quadrant | BADHDUFLAG | Total packets | Discarded packets |
| A | 0 | 2 | 0 |
| B | 0 | 2 | 0 |
| C | 0 | 2 | 0 |
| D | 0 | 3 | 0 |
| Mode SS | |||
|---|---|---|---|
| Quadrant | BADHDUFLAG | Total packets | Discarded packets |
| A | 0 | 160 | 0 |
| B | 0 | 160 | 0 |
| C | 0 | 160 | 0 |
| D | 0 | 160 | 0 |
| Quadrant | Total seconds | Saturated seconds | Saturation percentage |
|---|---|---|---|
| A | 7905 | 204 | 2.580645% |
| B | 7905 | 134 | 1.695130% |
| C | 7905 | 78 | 0.986717% |
| D | 7905 | 252 | 3.187856% |
Noise dominated data is calculated using 1-second bins in cleaned event files. If a bin has >2000 counts, and if more than 50% of those come from <1% of pixels, then it is considered to be noise-dominated and hence unusable.
| Quadrant | # 1 sec bins | Bins with >0 counts | Bins with >2000 counts | High rate bins dominated by noise | Noise dominated (total time) | Noise dominated (detector-on time) | Marked lightcurve |
|---|---|---|---|---|---|---|---|
| A | 7905 | 7905 | 13 | 13 | 0.16% | 0.16% | 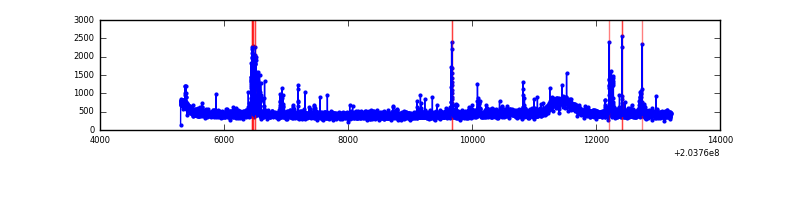 |
| B | 7905 | 7905 | 4 | 4 | 0.05% | 0.05% | 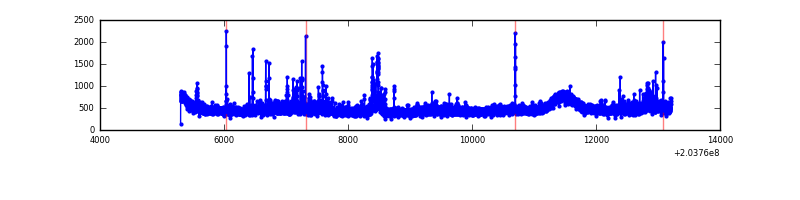 |
| C | 7905 | 7905 | 0 | 0 | 0.00% | 0.00% |  |
| D | 7905 | 7905 | 150 | 150 | 1.90% | 1.90% | 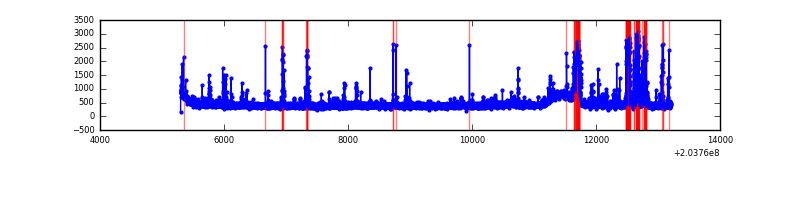 |
Top three noisy pixels from each quadrant. If the there are fewer than three noisy pixels in the level2.evt file, extra rows are filled as -1
| Pixel properties | Quadrant properties | ||||||
|---|---|---|---|---|---|---|---|
| Quadrant | DetID | PixID | Counts | Sigma | Mean | Median | Sigma |
| A | 0 | 118 | 157912 | 837.64 | 904 | 881 | 187.5 |
| A | 0 | 50 | 61548 | 323.61 | 904 | 881 | 187.5 |
| A | 0 | 226 | 23077 | 118.4 | 904 | 881 | 187.5 |
| B | 15 | 204 | 212491 | 1193.48 | 909 | 884 | 177.3 |
| B | 5 | 172 | 85786 | 478.85 | 909 | 884 | 177.3 |
| B | 15 | 54 | 46647 | 258.11 | 909 | 884 | 177.3 |
| C | 2 | 53 | 123323 | 603.25 | 875 | 875 | 203.0 |
| C | 8 | 128 | 19794 | 93.21 | 875 | 875 | 203.0 |
| C | 14 | 67 | 19628 | 92.39 | 875 | 875 | 203.0 |
| D | 12 | 79 | 311174 | 1471.25 | 871 | 844 | 210.9 |
| D | 2 | 232 | 167882 | 791.92 | 871 | 844 | 210.9 |
| D | 13 | 239 | 51079 | 238.16 | 871 | 844 | 210.9 |
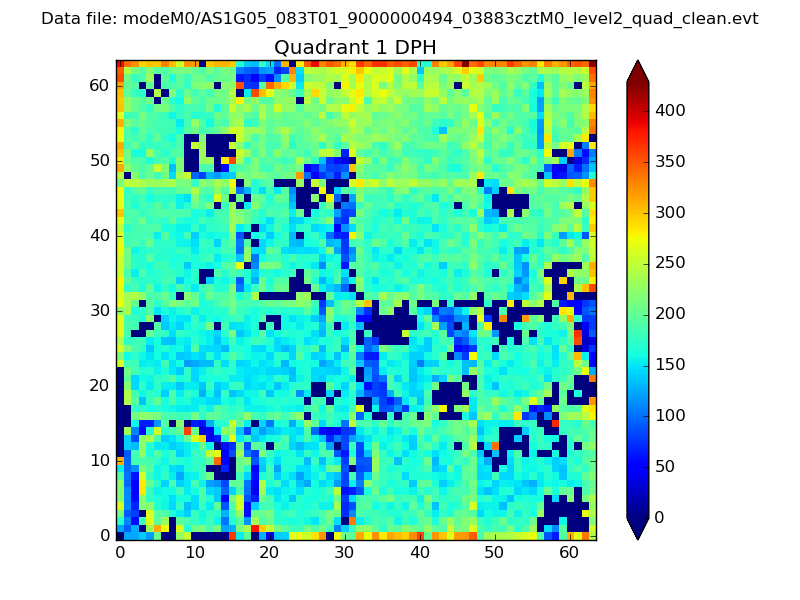
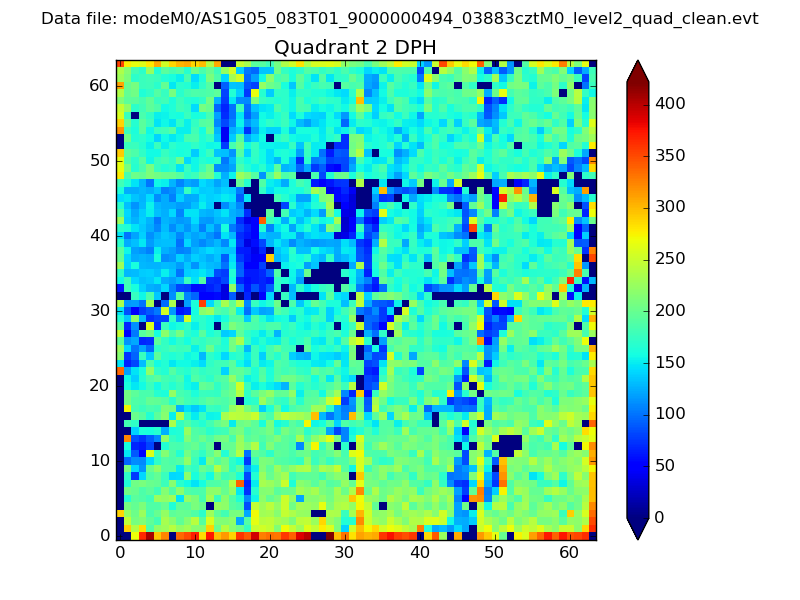
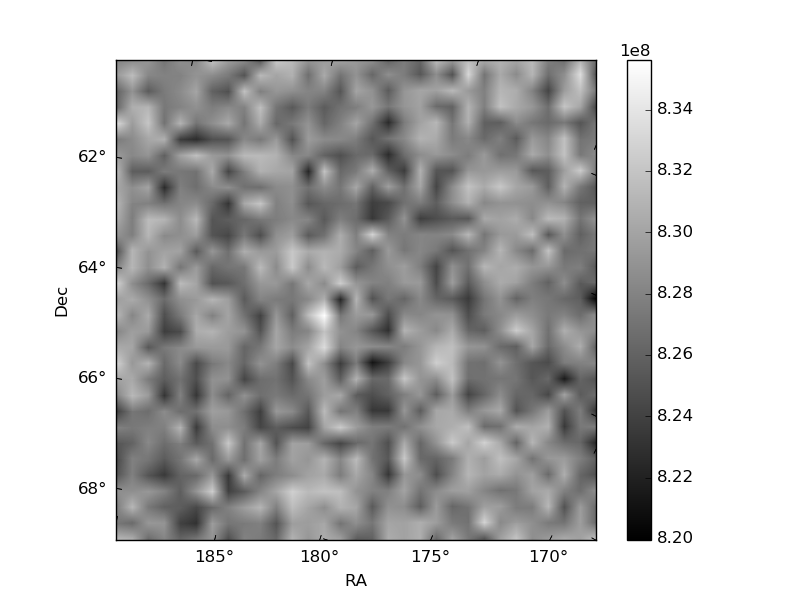
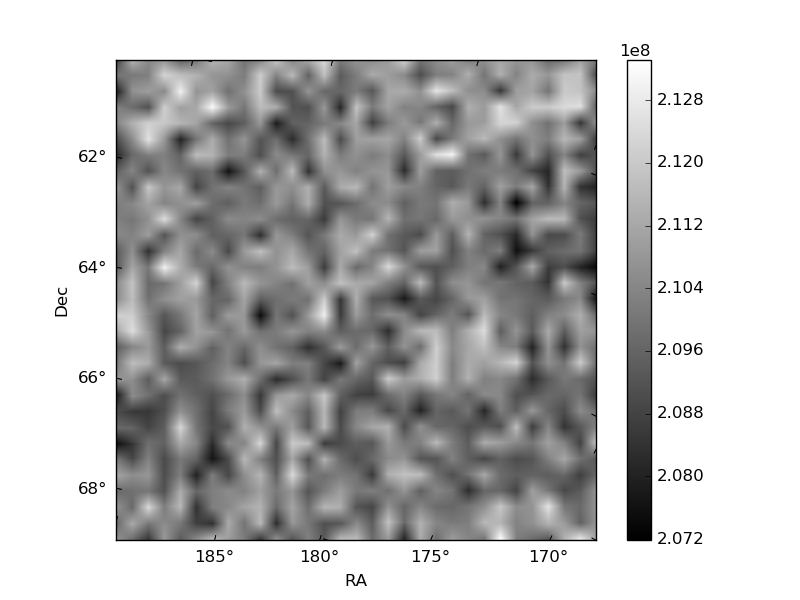
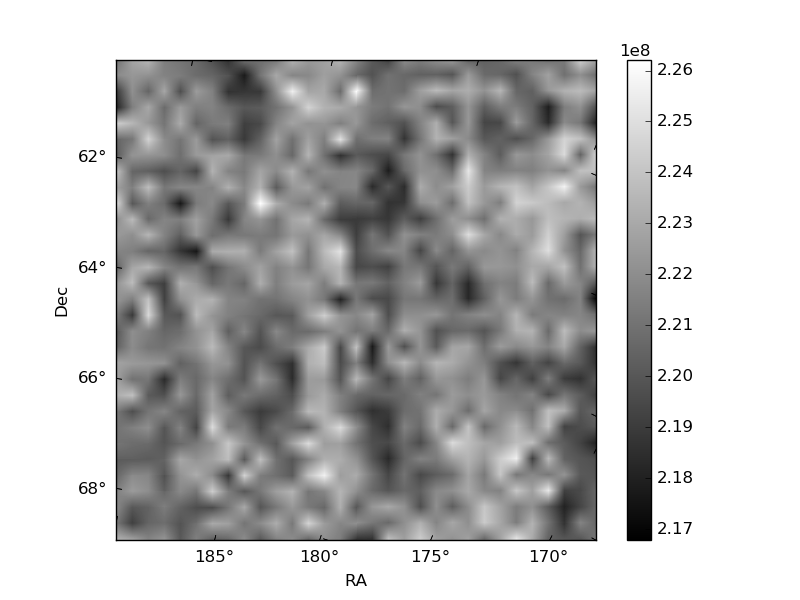
Histogram calculated using DETX and DETY for each event in the final _common_clean file
| Quadrant A | 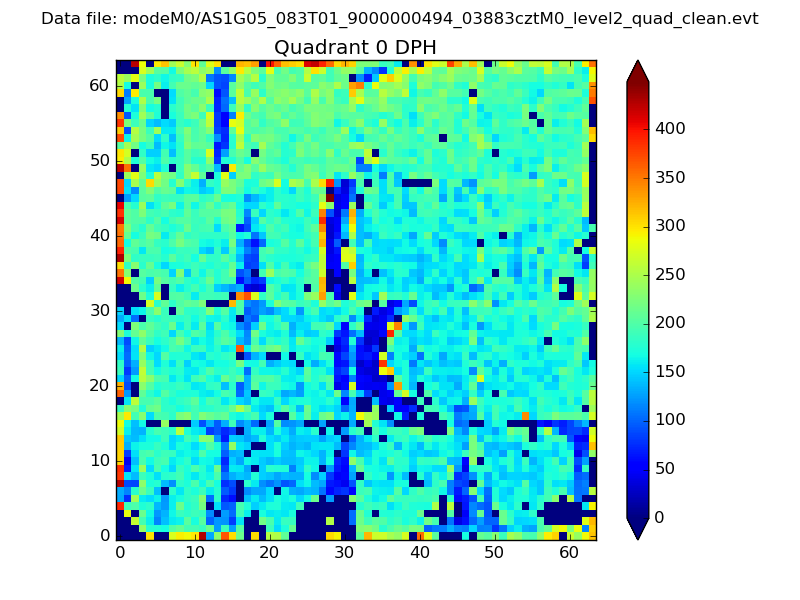 |
 |
Quadrant B |
|---|---|---|---|
| Quadrant D | 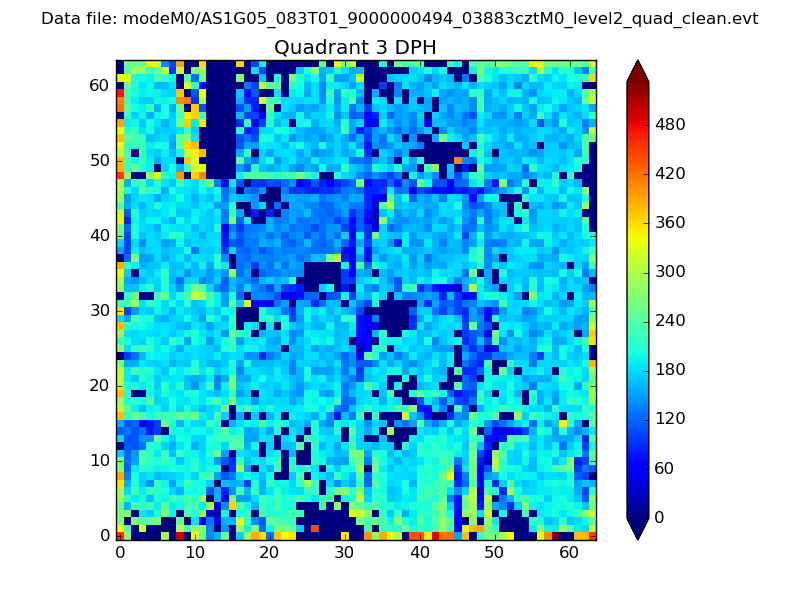 |
 |
Quadrant C |
| Plot type | Count rate plots | Images |
|---|---|---|
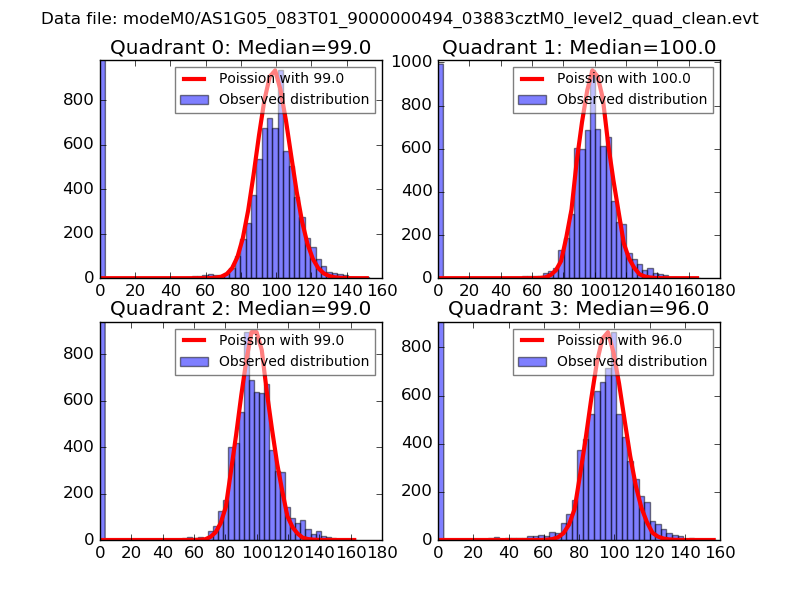
| Comparison with Poisson distribution Blue bars denote a histogram of data divided into 1 sec bins. Red curve is a Poisson curve with rate = median count rate of data. |
 |
 |
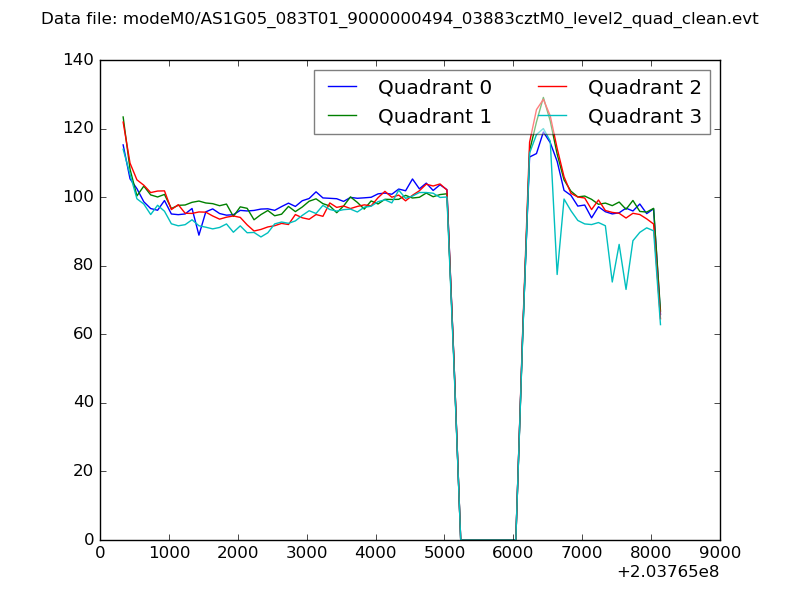
| Quadrant-wise count rates Data is divided into 100 sec bins |
 |
|
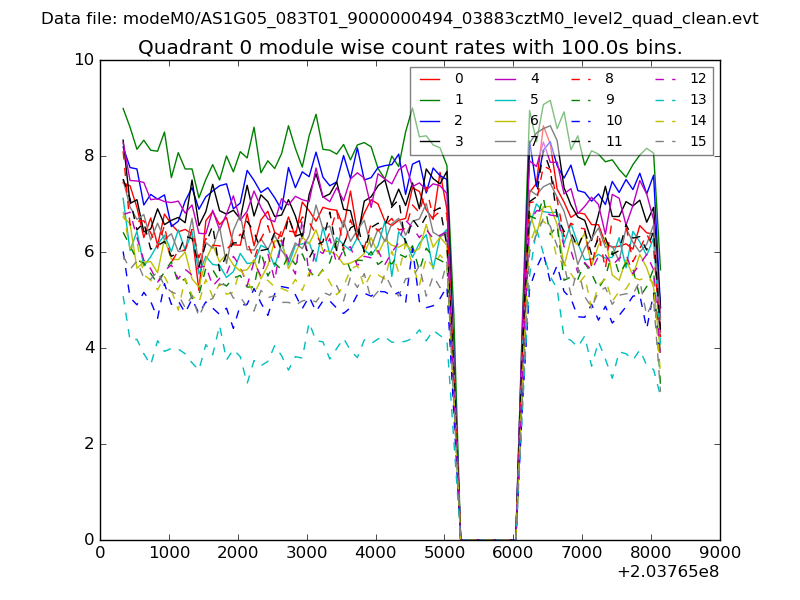
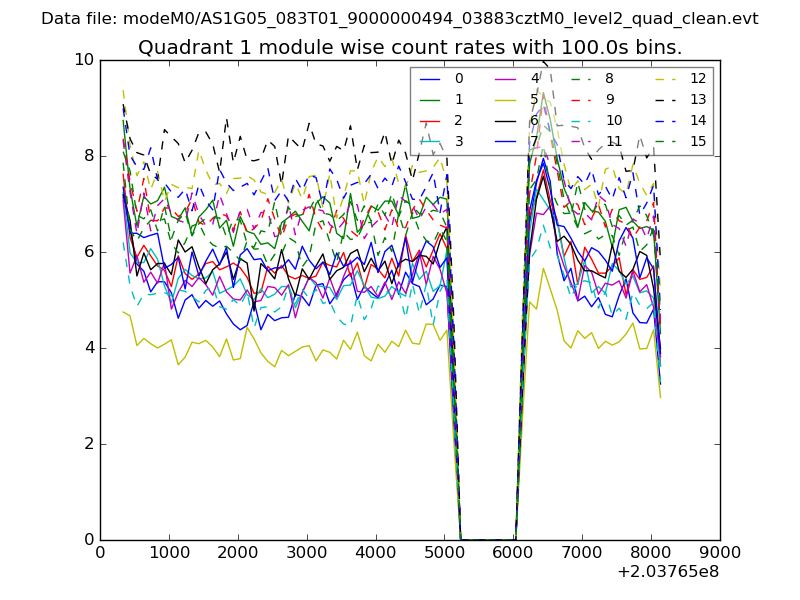
| Module-wise count rates for Quadrant A Data is divided into 100 sec bins |
 |
 |
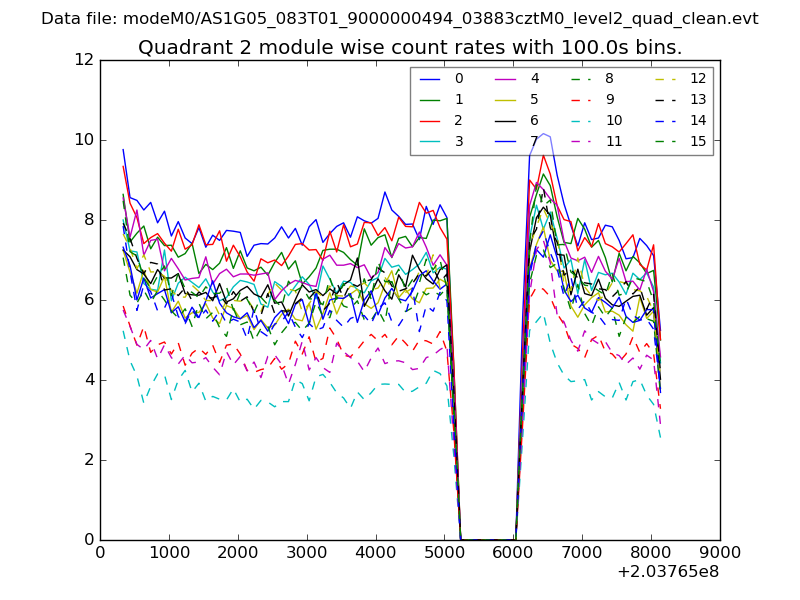
| Module-wise count rates for Quadrant B Data is divided into 100 sec bins |
 |
 |
| Module-wise count rates for Quadrant C Data is divided into 100 sec bins |
 |
 |
| Module-wise count rates for Quadrant D Data is divided into 100 sec bins |
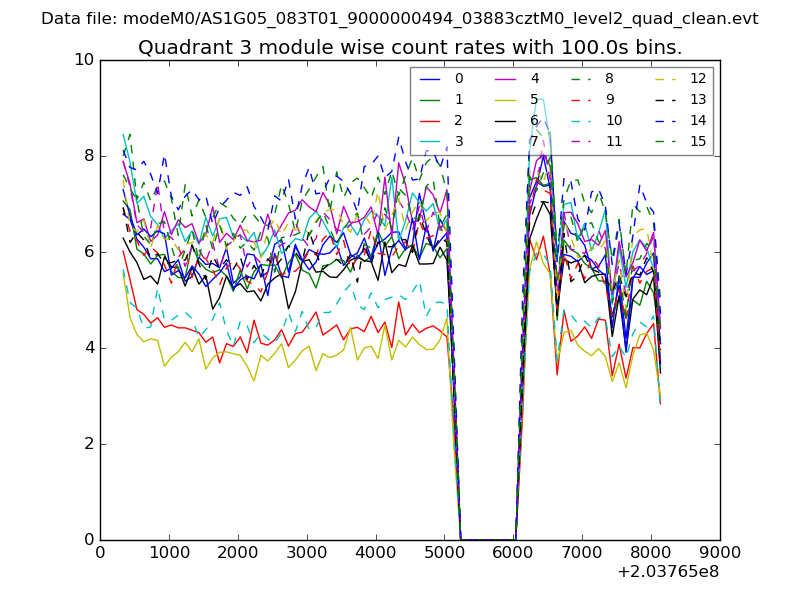 |
 |
| Parameter | Plot |
|---|---|
| CZT HV Monitor | 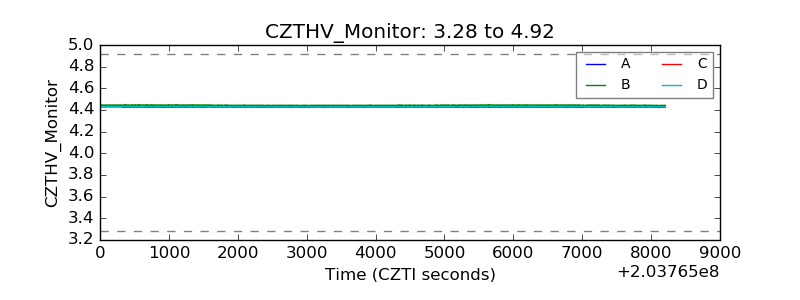 |
| D_VDD |  |
| Temperature 1 | 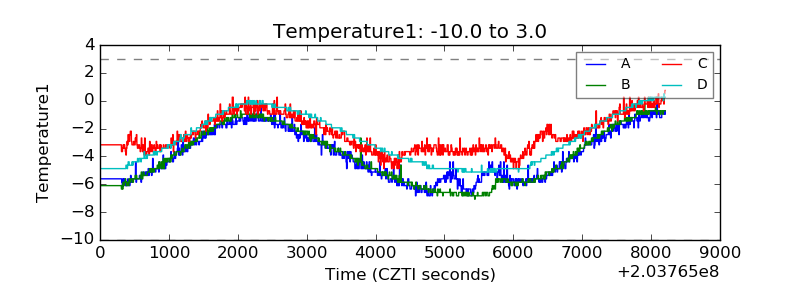 |
| Veto HV Monitor | 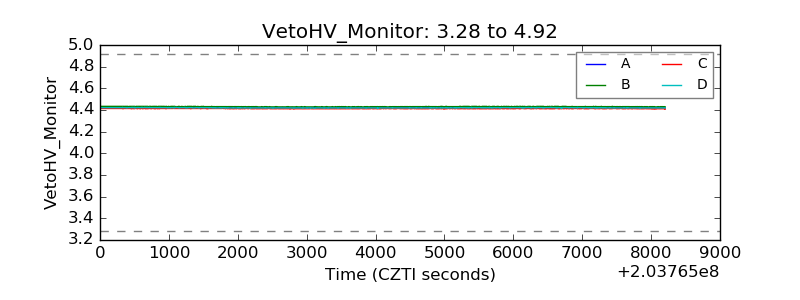 |
| Veto LLD | 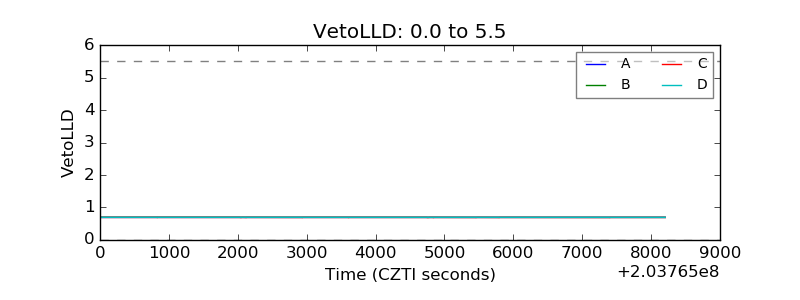 |
| Alpha Counter | 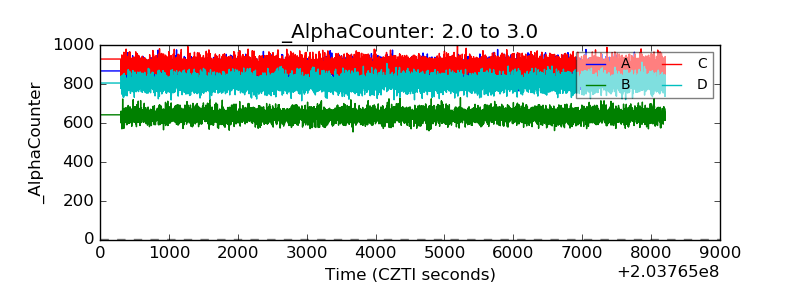 |
| _CPM_Rate | 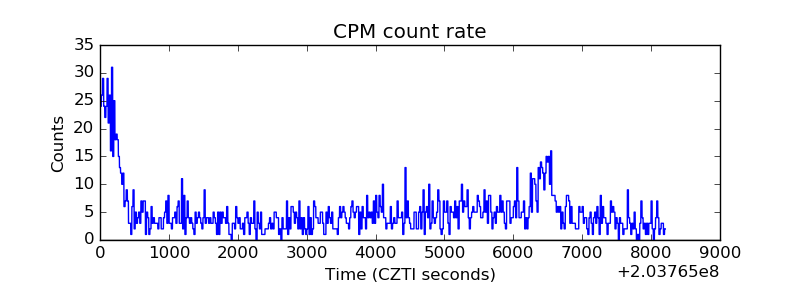 |
| CZT Counter |  |
| +2.5 Volts monitor |  |
| +5 Volts monitor |  |
| Veto Counter | 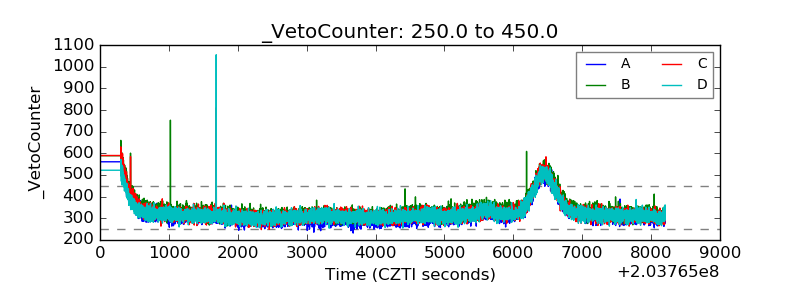 |