| Param | Original file | Final file |
|---|---|---|
| Filename | modeM0/AS1G05_083T01_9000000494_03884cztM0_level2.evt | modeM0/AS1G05_083T01_9000000494_03884cztM0_level2_quad_clean.evt |
| Size (bytes) | 150,768,000 | 33,914,880 |
| Size | 143.8 MB | 32.3 MB |
| Events in quadrant A | 1,042,475 | 220,922 |
| Events in quadrant B | 1,165,973 | 219,986 |
| Events in quadrant C | 922,270 | 215,264 |
| Events in quadrant D | 1,277,520 | 205,731 |
| Mode M0 | |||
|---|---|---|---|
| Quadrant | BADHDUFLAG | Total packets | Discarded packets |
| A | 0 | 4833 | 15 |
| B | 0 | 4949 | 14 |
| C | 0 | 4588 | 9 |
| D | 0 | 5605 | 14 |
| Mode SS | |||
|---|---|---|---|
| Quadrant | BADHDUFLAG | Total packets | Discarded packets |
| A | 0 | 46 | 2 |
| B | 0 | 46 | 0 |
| C | 0 | 46 | 2 |
| D | 0 | 46 | 0 |
| Quadrant | Total seconds | Saturated seconds | Saturation percentage |
|---|---|---|---|
| A | 2284 | 8 | 0.350263% |
| B | 2284 | 4 | 0.175131% |
| C | 2286 | 0 | 0.000000% |
| D | 2285 | 85 | 3.719912% |
Noise dominated data is calculated using 1-second bins in cleaned event files. If a bin has >2000 counts, and if more than 50% of those come from <1% of pixels, then it is considered to be noise-dominated and hence unusable.
| Quadrant | # 1 sec bins | Bins with >0 counts | Bins with >2000 counts | High rate bins dominated by noise | Noise dominated (total time) | Noise dominated (detector-on time) | Marked lightcurve |
|---|---|---|---|---|---|---|---|
| A | 2291 | 2290 | 6 | 6 | 0.26% | 0.26% | 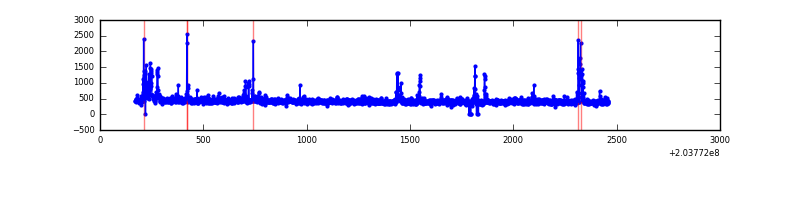 |
| B | 2291 | 2291 | 3 | 3 | 0.13% | 0.13% | 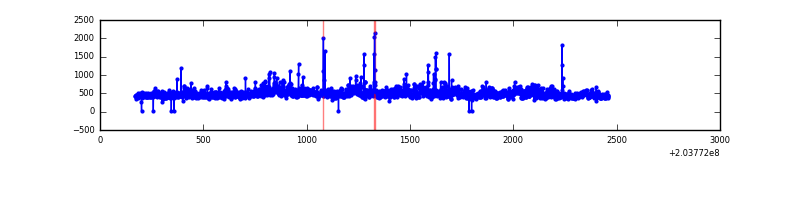 |
| C | 2291 | 2291 | 0 | 0 | 0.00% | 0.00% |  |
| D | 2291 | 2291 | 95 | 95 | 4.15% | 4.15% | 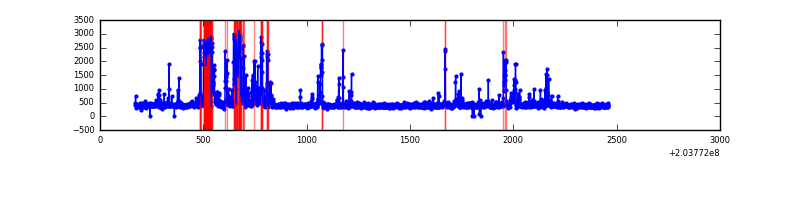 |
Top three noisy pixels from each quadrant. If the there are fewer than three noisy pixels in the level2.evt file, extra rows are filled as -1
| Pixel properties | Quadrant properties | ||||||
|---|---|---|---|---|---|---|---|
| Quadrant | DetID | PixID | Counts | Sigma | Mean | Median | Sigma |
| A | 0 | 118 | 53026 | 1026.86 | 240 | 233 | 51.4 |
| A | 15 | 174 | 35151 | 679.18 | 240 | 233 | 51.4 |
| A | 8 | 15 | 8170 | 154.38 | 240 | 233 | 51.4 |
| B | 15 | 204 | 157278 | 3271.35 | 240 | 234 | 48.0 |
| B | 15 | 54 | 24614 | 507.86 | 240 | 234 | 48.0 |
| B | 15 | 85 | 22312 | 459.9 | 240 | 234 | 48.0 |
| C | 2 | 53 | 6089 | 107.11 | 231 | 231 | 54.7 |
| C | 8 | 128 | 4027 | 69.41 | 231 | 231 | 54.7 |
| C | 14 | 67 | 3606 | 61.71 | 231 | 231 | 54.7 |
| D | 12 | 79 | 312104 | 5532.11 | 230 | 222 | 56.4 |
| D | 12 | 217 | 20138 | 353.27 | 230 | 222 | 56.4 |
| D | 13 | 25 | 19097 | 334.8 | 230 | 222 | 56.4 |
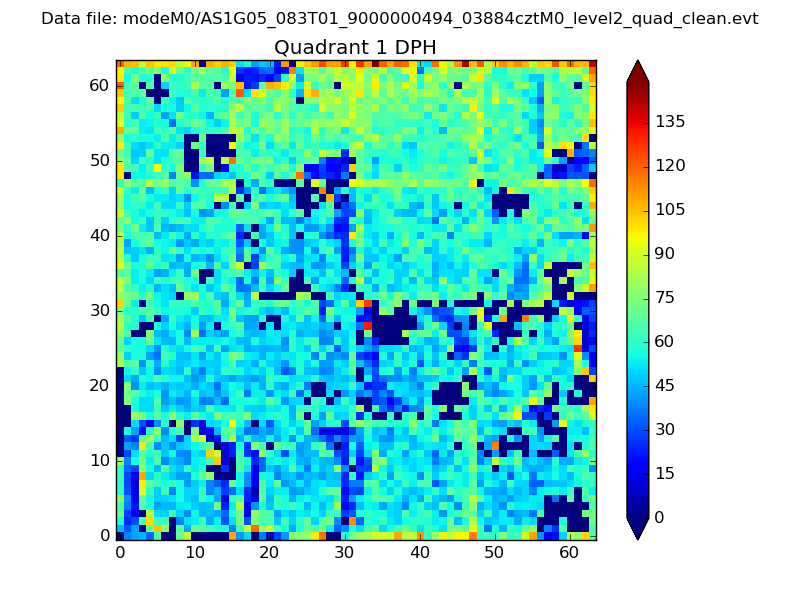
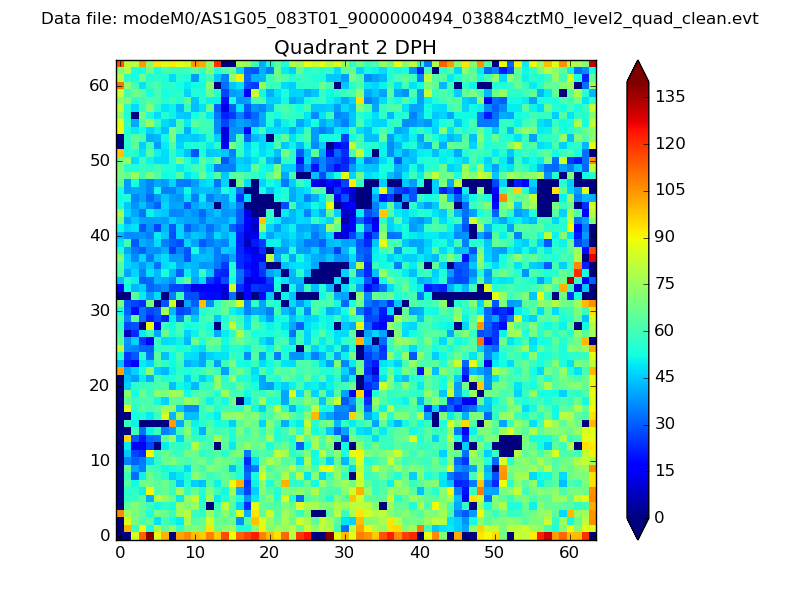
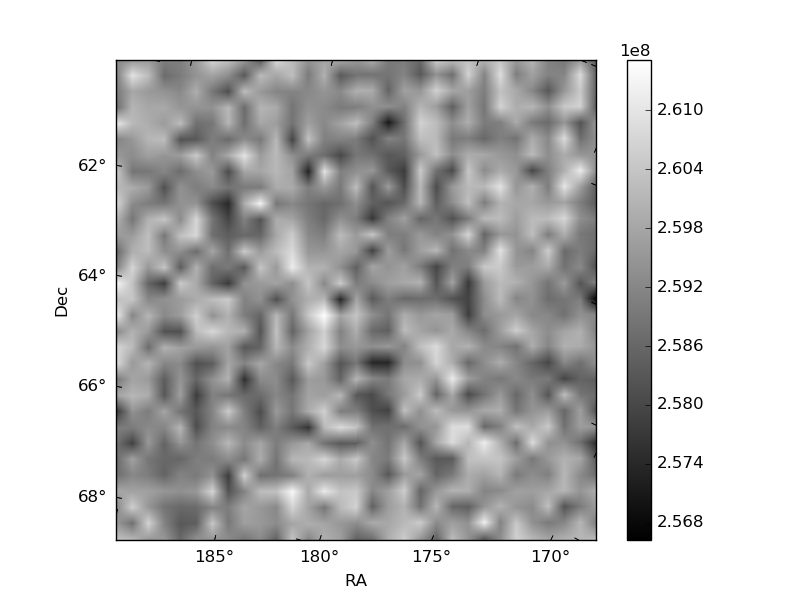
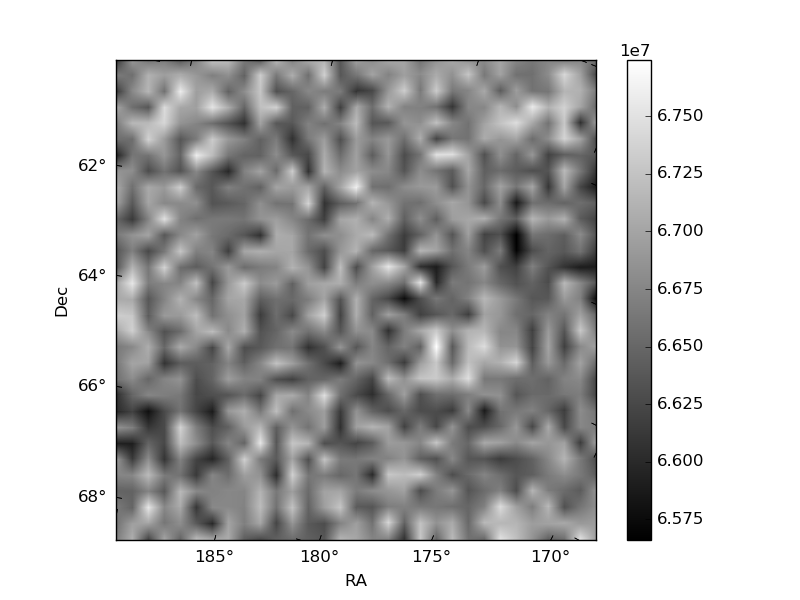
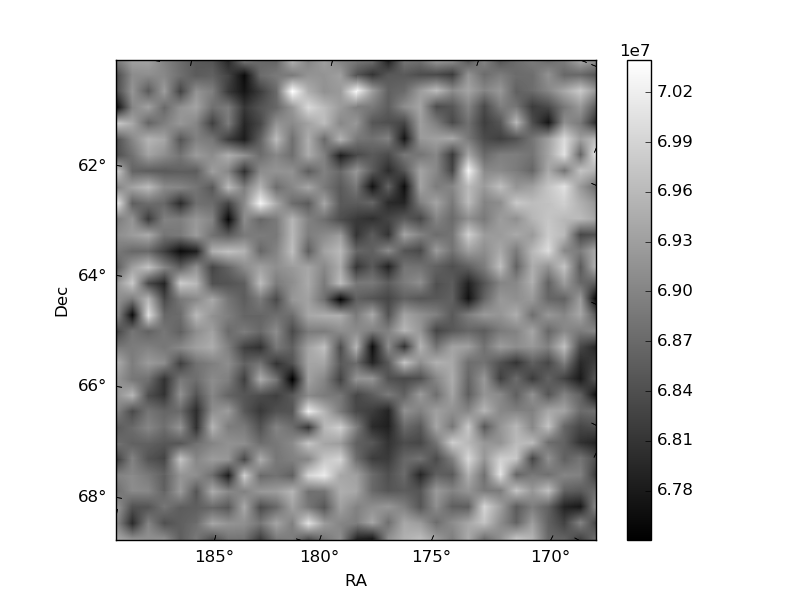
Histogram calculated using DETX and DETY for each event in the final _common_clean file
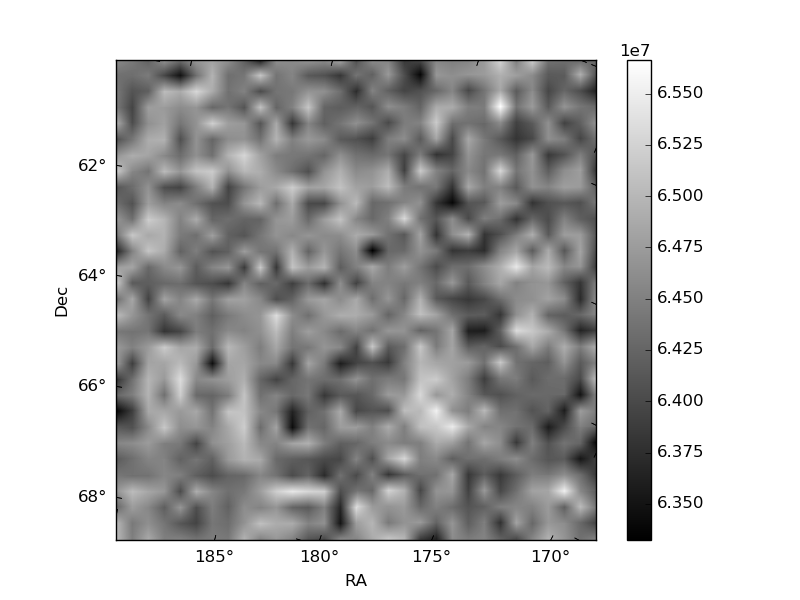
| Quadrant A | 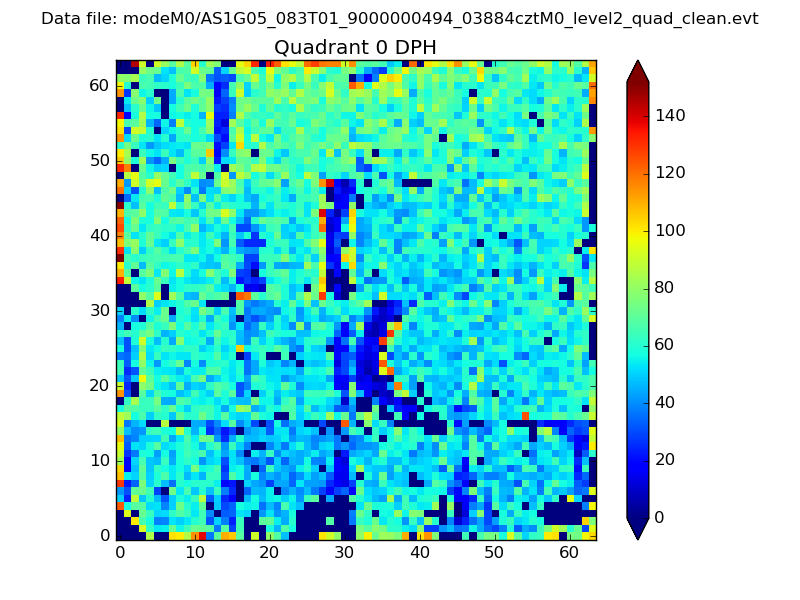 |
 |
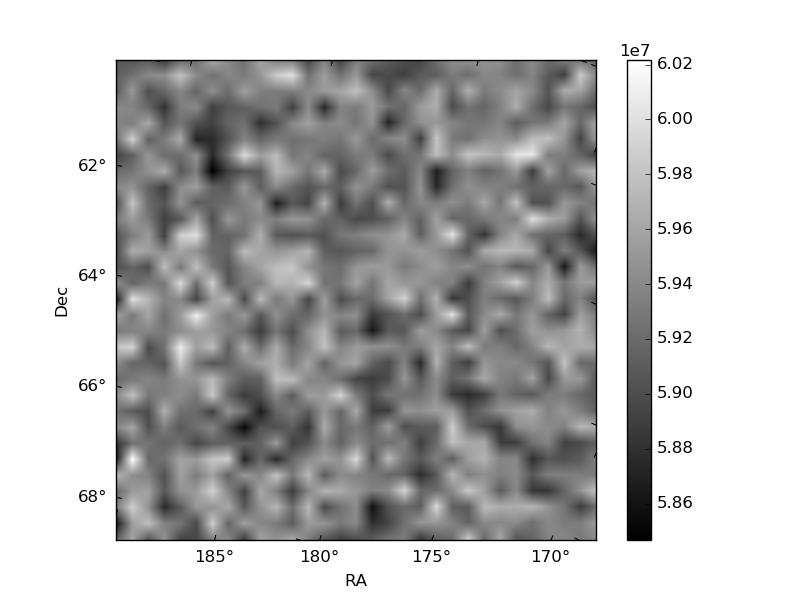
Quadrant B |
|---|---|---|---|
| Quadrant D | 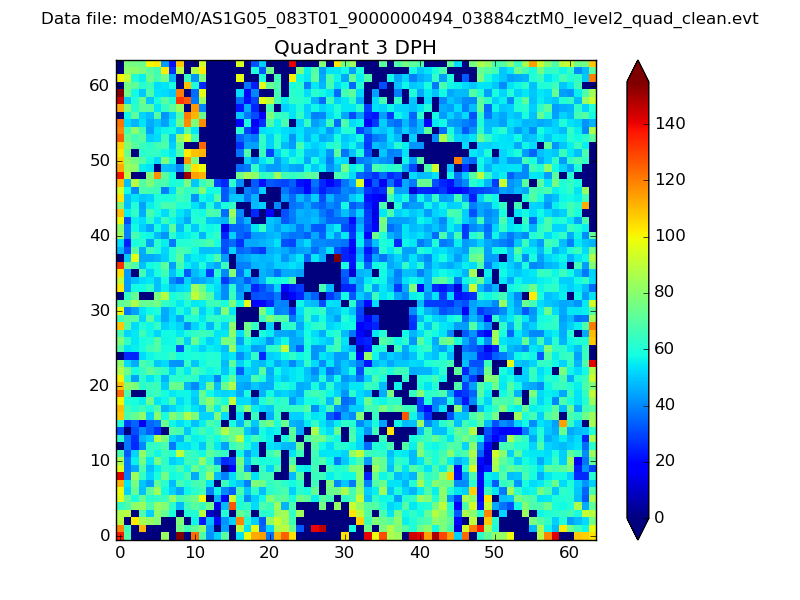 |
 |
Quadrant C |
| Plot type | Count rate plots | Images |
|---|---|---|
| Comparison with Poisson distribution Blue bars denote a histogram of data divided into 1 sec bins. Red curve is a Poisson curve with rate = median count rate of data. |
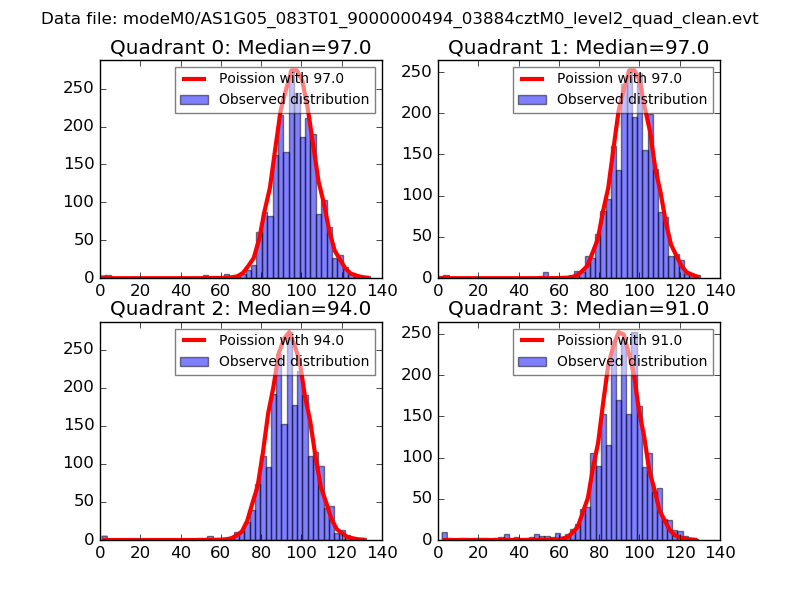 |
 |
| Quadrant-wise count rates Data is divided into 100 sec bins |
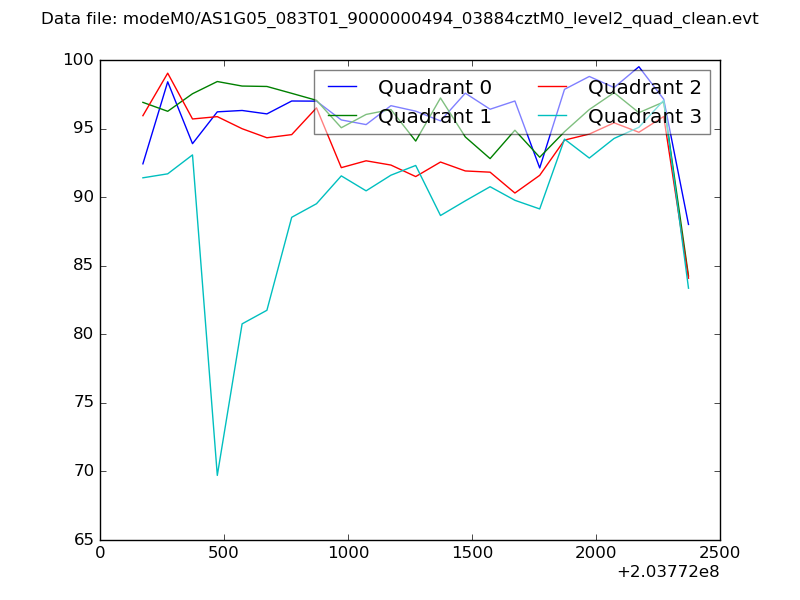 |
|
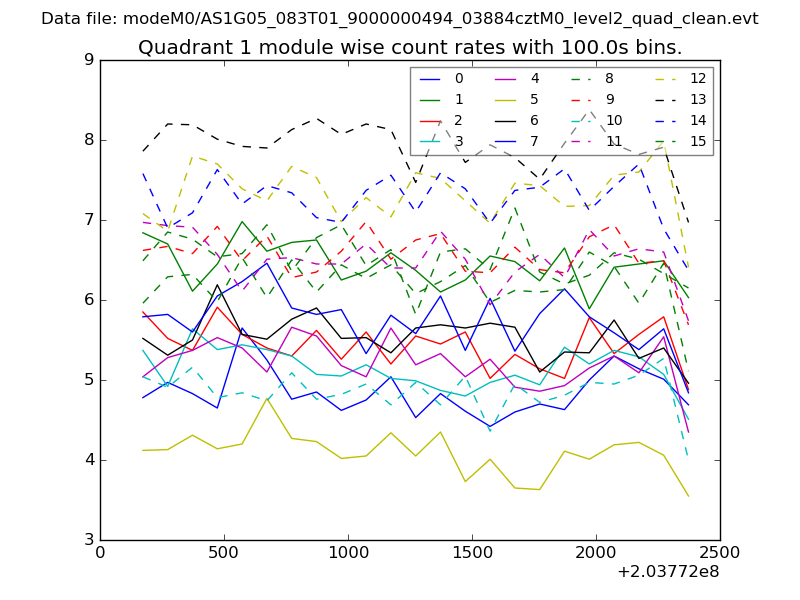
| Module-wise count rates for Quadrant A Data is divided into 100 sec bins |
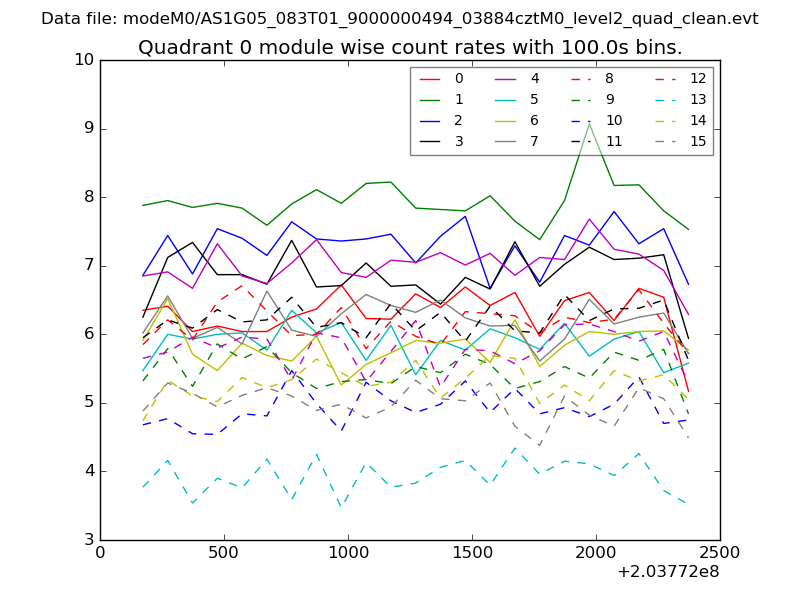 |
 |
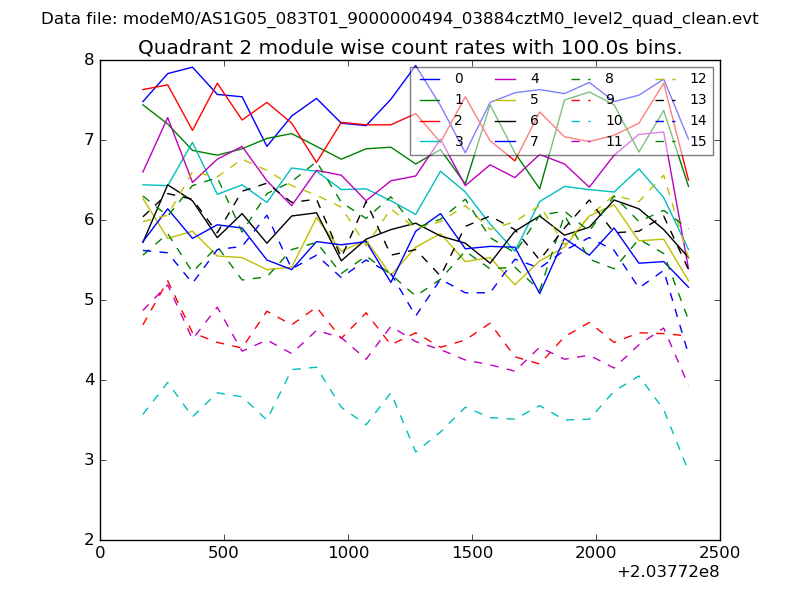
| Module-wise count rates for Quadrant B Data is divided into 100 sec bins |
 |
 |
| Module-wise count rates for Quadrant C Data is divided into 100 sec bins |
 |
 |
| Module-wise count rates for Quadrant D Data is divided into 100 sec bins |
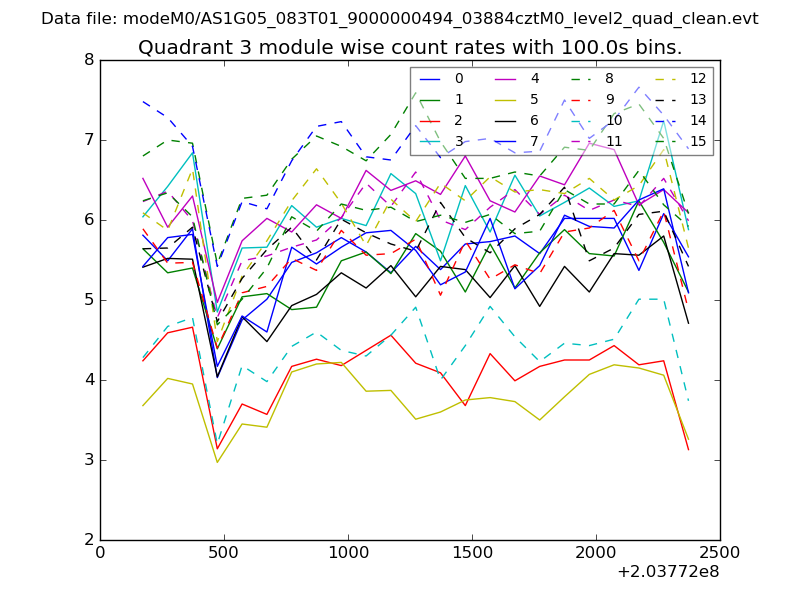 |
 |
| Parameter | Plot |
|---|---|
| CZT HV Monitor | 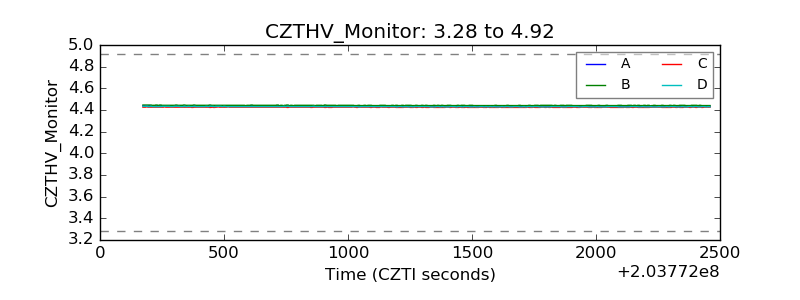 |
| D_VDD | 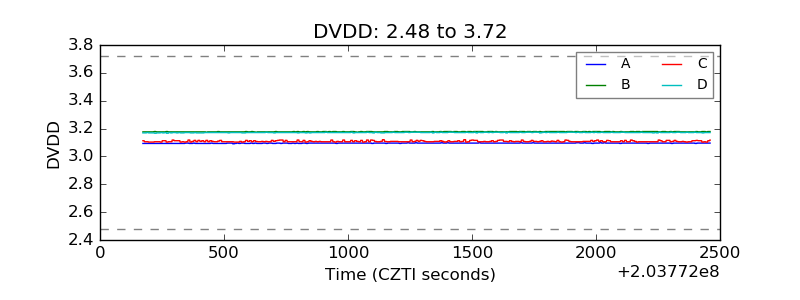 |
| Temperature 1 | 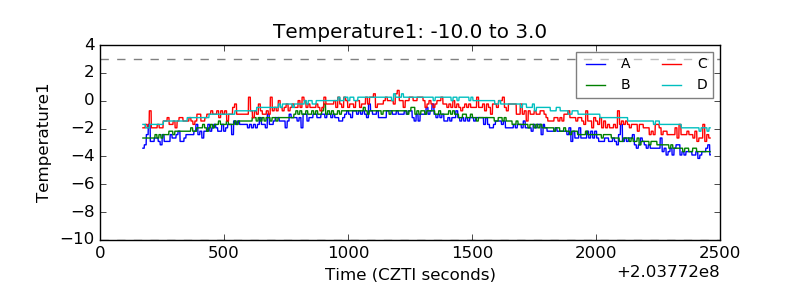 |
| Veto HV Monitor |  |
| Veto LLD | 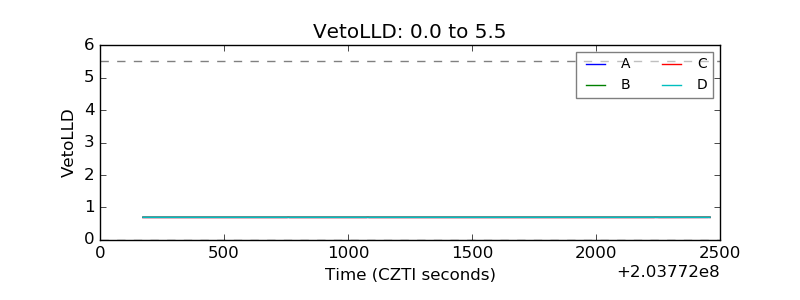 |
| Alpha Counter | 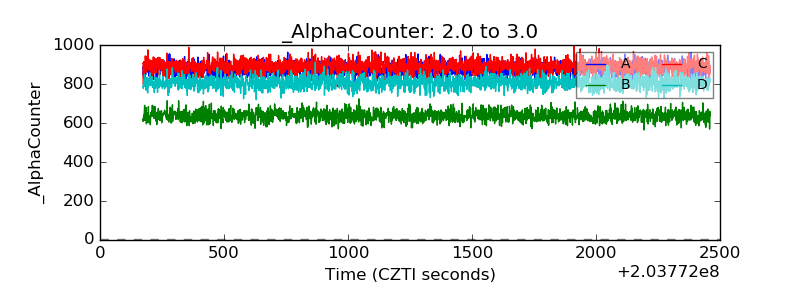 |
| _CPM_Rate | 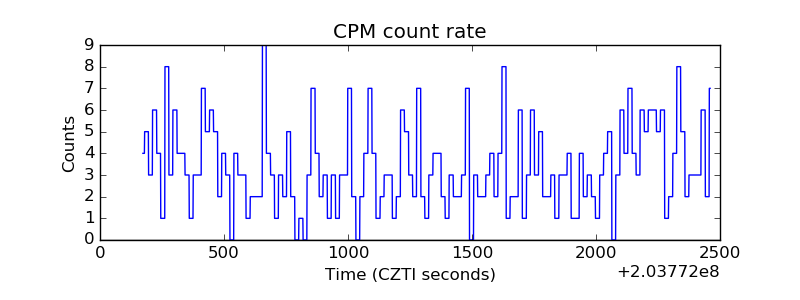 |
| CZT Counter | 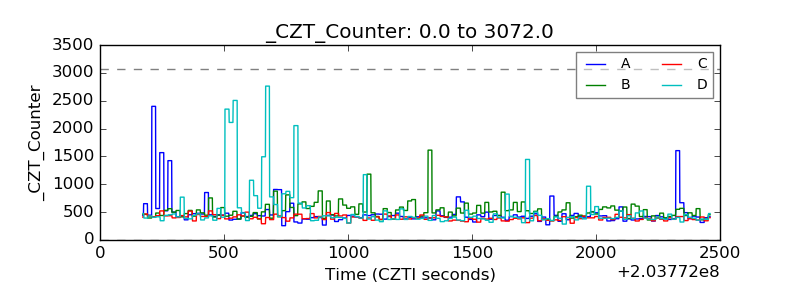 |
| +2.5 Volts monitor |  |
| +5 Volts monitor | 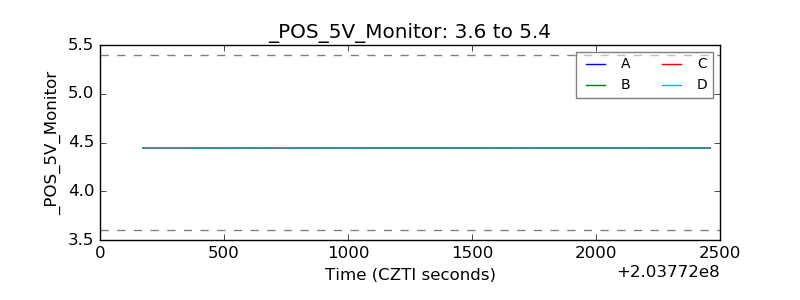 |
| Veto Counter | 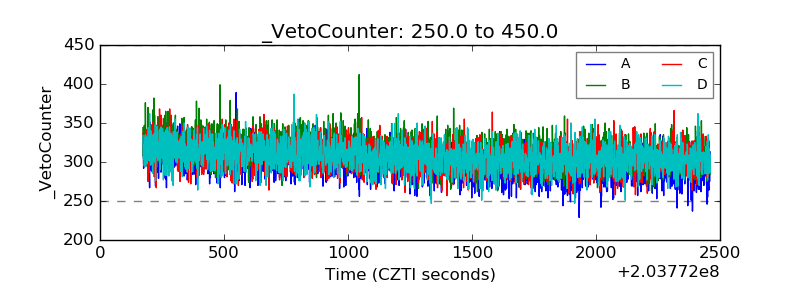 |