| Param | Original file | Final file |
|---|---|---|
| Filename | modeM0/AS1G05_239T02_9000000496cztM0_level2.fits | modeM0/AS1G05_239T02_9000000496cztM0_level2_quad_clean.evt |
| Size (bytes) | 487,005,120 | 461,908,800 |
| Size | 464.4 MB | 440.5 MB |
| Events in quadrant A | 2,939,416 | 2,688,878 |
| Events in quadrant B | 2,884,766 | 2,772,960 |
| Events in quadrant C | 2,746,780 | 2,440,135 |
| Events in quadrant D | 2,475,120 | 2,386,676 |
| Mode M0 | |||
|---|---|---|---|
| Quadrant | BADHDUFLAG | Total packets | Discarded packets |
| A | 0 | 133858 | 0 |
| B | 0 | 120668 | 0 |
| C | 0 | 183809 | 0 |
| D | 0 | 125442 | 0 |
| Mode M9 | |||
|---|---|---|---|
| Quadrant | BADHDUFLAG | Total packets | Discarded packets |
| A | 0 | 100 | 0 |
| B | 0 | 100 | 0 |
| C | 0 | 100 | 0 |
| D | 0 | 100 | 0 |
| Mode SS | |||
|---|---|---|---|
| Quadrant | BADHDUFLAG | Total packets | Discarded packets |
| A | 0 | 1096 | 0 |
| B | 0 | 1096 | 0 |
| C | 0 | 1096 | 0 |
| D | 0 | 1096 | 0 |
| Quadrant | Total seconds | Saturated seconds | Saturation percentage |
|---|---|---|---|
| A | 53929 | 2151 | 3.988578% |
| B | 53929 | 687 | 1.273897% |
| C | 53929 | 5107 | 9.469859% |
| D | 53929 | 1317 | 2.442100% |
Noise dominated data is calculated using 1-second bins in cleaned event files. If a bin has >2000 counts, and if more than 50% of those come from <1% of pixels, then it is considered to be noise-dominated and hence unusable.
| Quadrant | # 1 sec bins | Bins with >0 counts | Bins with >2000 counts | High rate bins dominated by noise | Noise dominated (total time) | Noise dominated (detector-on time) | Marked lightcurve |
|---|---|---|---|---|---|---|---|
| A | 63728 | 53913 | 0 | 0 | 0.00% | 0.00% | 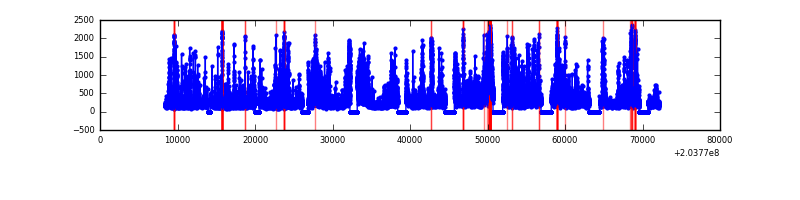 |
| B | 63728 | 53917 | 0 | 0 | 0.00% | 0.00% |  |
| C | 63728 | 53873 | 0 | 0 | 0.00% | 0.00% |  |
| D | 63728 | 53907 | 0 | 0 | 0.00% | 0.00% | 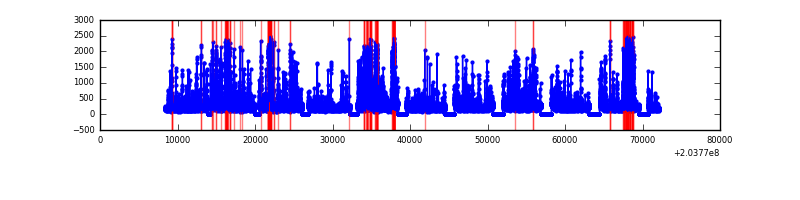 |
Top three noisy pixels from each quadrant. If the there are fewer than three noisy pixels in the level2.evt file, extra rows are filled as -1
| Pixel properties | Quadrant properties | ||||||
|---|---|---|---|---|---|---|---|
| Quadrant | DetID | PixID | Counts | Sigma | Mean | Median | Sigma |
| A | 0 | 29 | 2742 | 10.21 | 764 | 711 | 199.0 |
| A | 7 | 110 | 2458 | 8.78 | 764 | 711 | 199.0 |
| A | 0 | 30 | 2218 | 7.57 | 764 | 711 | 199.0 |
| B | 2 | 9 | 2422 | 11.07 | 762 | 724 | 153.4 |
| B | 12 | 226 | 2119 | 9.1 | 762 | 724 | 153.4 |
| B | 5 | 128 | 2077 | 8.82 | 762 | 724 | 153.4 |
| C | 1 | 80 | 1966 | 6.64 | 725 | 672 | 194.9 |
| C | 9 | 188 | 1924 | 6.42 | 725 | 672 | 194.9 |
| C | 1 | 81 | 1918 | 6.39 | 725 | 672 | 194.9 |
| D | 6 | 231 | 1911 | 6.62 | 709 | 644 | 191.4 |
| D | 7 | 5 | 1868 | 6.39 | 709 | 644 | 191.4 |
| D | 3 | 14 | 1857 | 6.34 | 709 | 644 | 191.4 |
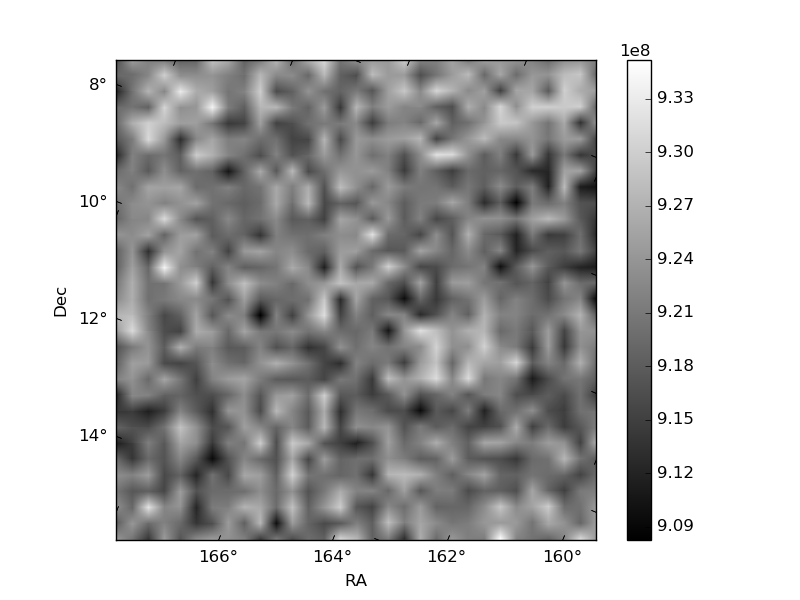
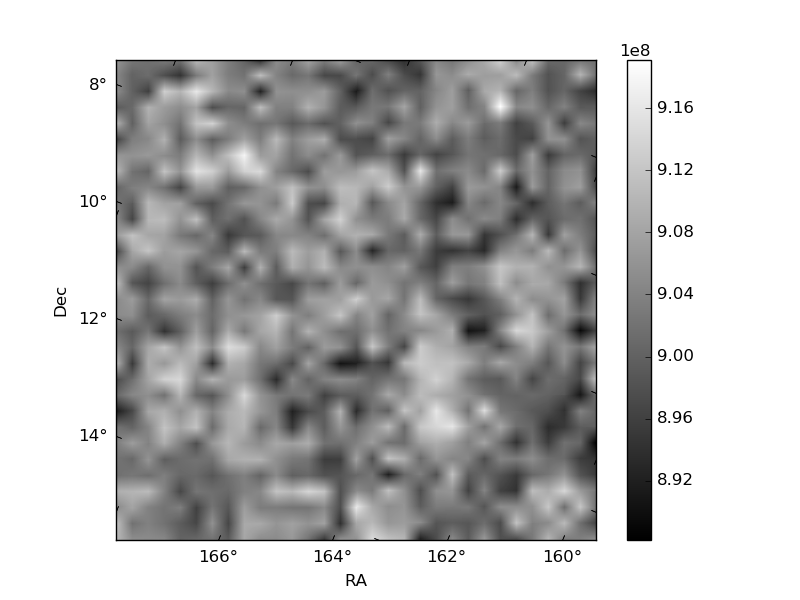
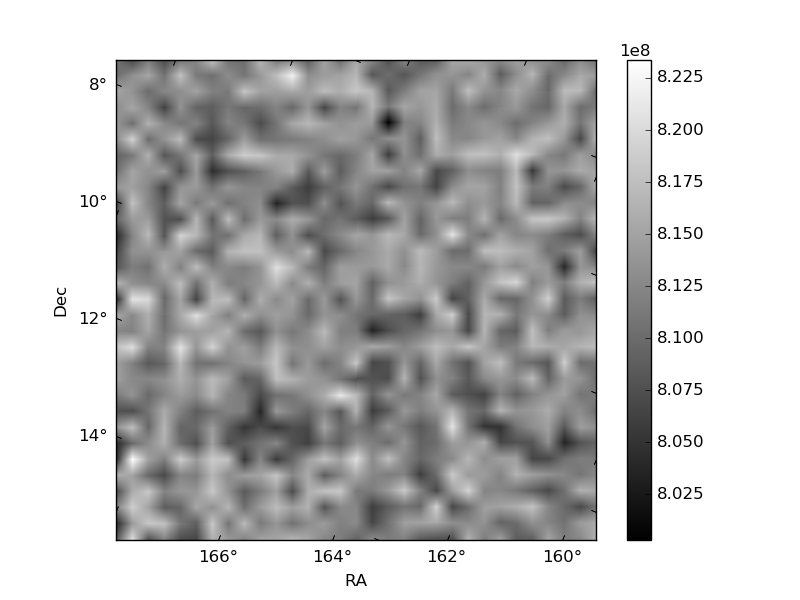
Histogram calculated using DETX and DETY for each event in the final _common_clean file
| Quadrant A | 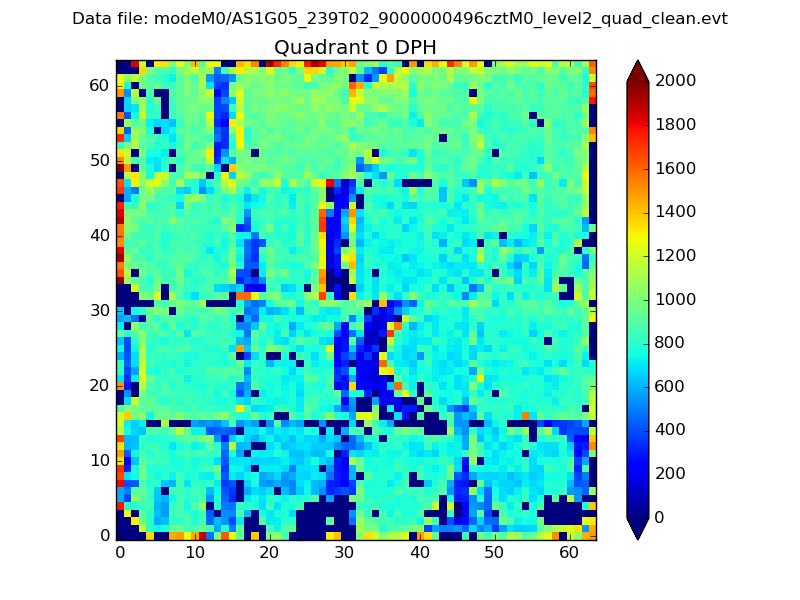 |
 |
Quadrant B |
|---|---|---|---|
| Quadrant D | 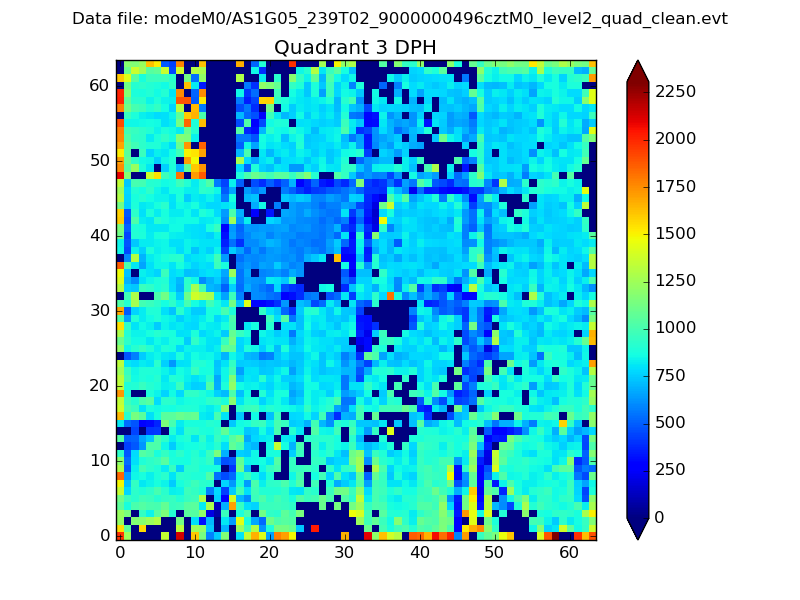 |
 |
Quadrant C |
| Plot type | Count rate plots | Images |
|---|---|---|
| Comparison with Poisson distribution Blue bars denote a histogram of data divided into 1 sec bins. Red curve is a Poisson curve with rate = median count rate of data. |
 |
 |
| Quadrant-wise count rates Data is divided into 100 sec bins |
 |
|
| Module-wise count rates for Quadrant A Data is divided into 100 sec bins |
 |
 |
| Module-wise count rates for Quadrant B Data is divided into 100 sec bins |
 |
 |
| Module-wise count rates for Quadrant C Data is divided into 100 sec bins |
 |
 |
| Module-wise count rates for Quadrant D Data is divided into 100 sec bins |
 |
 |
| Parameter | Plot |
|---|---|
| CZT HV Monitor | 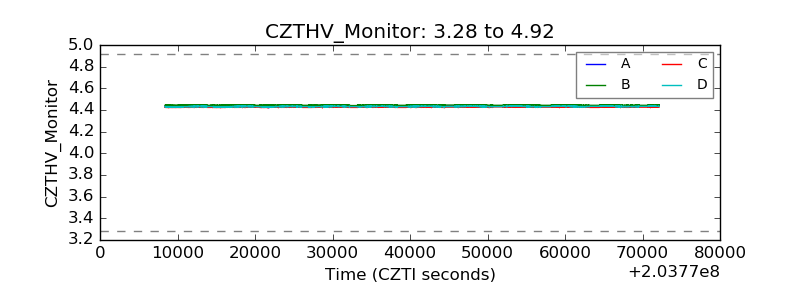 |
| D_VDD |  |
| Temperature 1 | 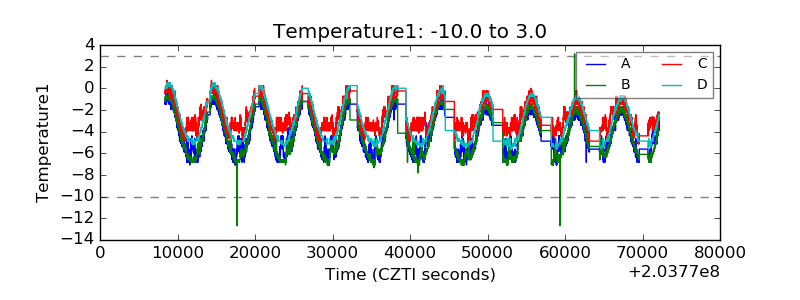 |
| Veto HV Monitor |  |
| Veto LLD |  |
| Alpha Counter |  |
| _CPM_Rate |  |
| CZT Counter |  |
| +2.5 Volts monitor |  |
| +5 Volts monitor |  |
| _ROLL_ROT | 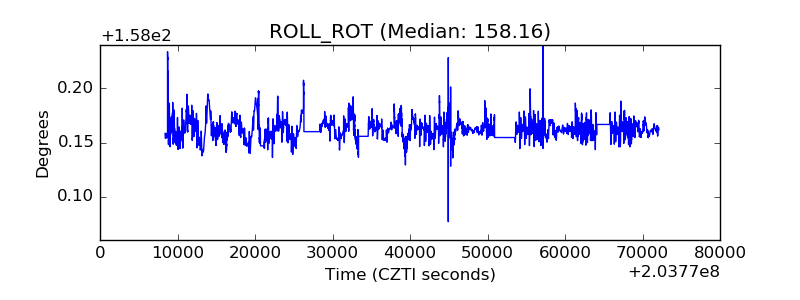 |
| _Roll_DEC | 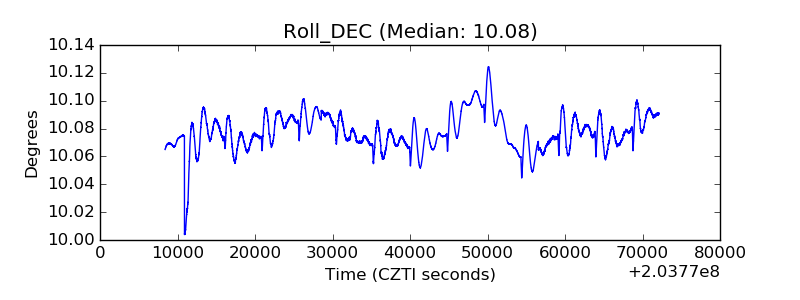 |
| _Roll_RA |  |
| Veto Counter | 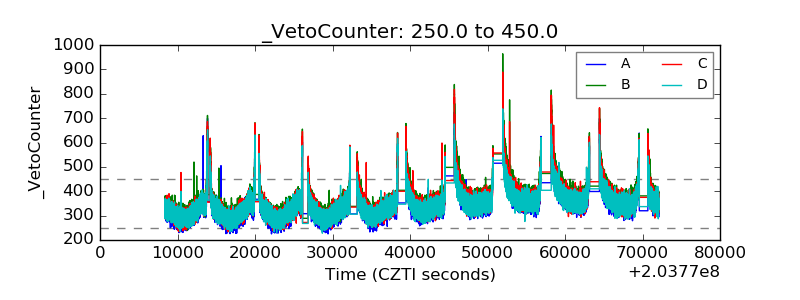 |