| Param | Original file | Final file |
|---|---|---|
| Filename | modeM0/AS1G05_239T02_9000000496_03887cztM0_level2.evt | modeM0/AS1G05_239T02_9000000496_03887cztM0_level2_quad_clean.evt |
| Size (bytes) | 1,492,263,360 | 190,480,320 |
| Size | 1.4 GB | 181.7 MB |
| Events in quadrant A | 9,659,478 | 1,148,056 |
| Events in quadrant B | 9,384,328 | 1,152,709 |
| Events in quadrant C | 15,136,723 | 1,115,046 |
| Events in quadrant D | 9,776,800 | 1,089,148 |
| Mode M0 | |||
|---|---|---|---|
| Quadrant | BADHDUFLAG | Total packets | Discarded packets |
| A | 0 | 41686 | 4 |
| B | 0 | 40182 | 3 |
| C | 0 | 57681 | 3 |
| D | 0 | 42632 | 3 |
| Mode M9 | |||
|---|---|---|---|
| Quadrant | BADHDUFLAG | Total packets | Discarded packets |
| A | 0 | 17 | 0 |
| B | 0 | 17 | 0 |
| C | 0 | 17 | 0 |
| D | 0 | 17 | 0 |
| Mode SS | |||
|---|---|---|---|
| Quadrant | BADHDUFLAG | Total packets | Discarded packets |
| A | 0 | 372 | 0 |
| B | 0 | 372 | 0 |
| C | 0 | 372 | 0 |
| D | 0 | 372 | 0 |
| Quadrant | Total seconds | Saturated seconds | Saturation percentage |
|---|---|---|---|
| A | 18332 | 394 | 2.149247% |
| B | 18332 | 165 | 0.900065% |
| C | 18332 | 620 | 3.382064% |
| D | 18332 | 553 | 3.016583% |
Noise dominated data is calculated using 1-second bins in cleaned event files. If a bin has >2000 counts, and if more than 50% of those come from <1% of pixels, then it is considered to be noise-dominated and hence unusable.
| Quadrant | # 1 sec bins | Bins with >0 counts | Bins with >2000 counts | High rate bins dominated by noise | Noise dominated (total time) | Noise dominated (detector-on time) | Marked lightcurve |
|---|---|---|---|---|---|---|---|
| A | 19942 | 18332 | 241 | 241 | 1.21% | 1.31% | 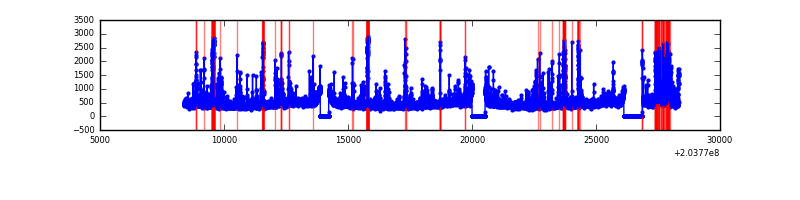 |
| B | 19942 | 18332 | 19 | 19 | 0.10% | 0.10% | 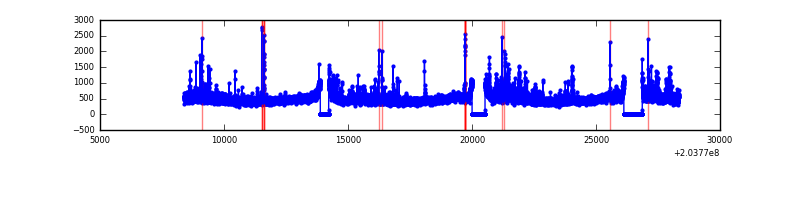 |
| C | 19942 | 18332 | 556 | 556 | 2.79% | 3.03% | 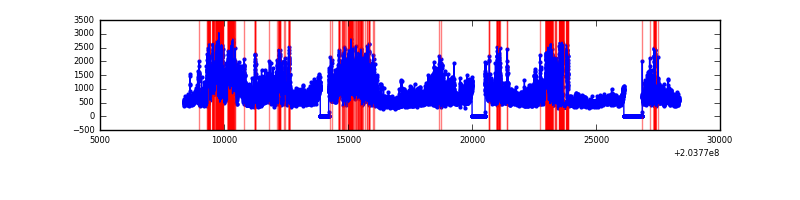 |
| D | 19942 | 18332 | 480 | 480 | 2.41% | 2.62% | 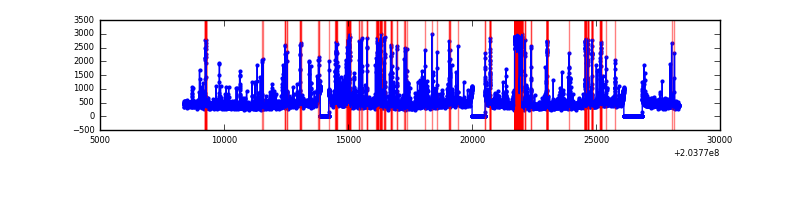 |
Top three noisy pixels from each quadrant. If the there are fewer than three noisy pixels in the level2.evt file, extra rows are filled as -1
| Pixel properties | Quadrant properties | ||||||
|---|---|---|---|---|---|---|---|
| Quadrant | DetID | PixID | Counts | Sigma | Mean | Median | Sigma |
| A | 0 | 118 | 455264 | 1068.34 | 2057 | 2008 | 424.3 |
| A | 15 | 174 | 408203 | 957.42 | 2057 | 2008 | 424.3 |
| A | 0 | 199 | 342561 | 802.7 | 2057 | 2008 | 424.3 |
| B | 15 | 204 | 933268 | 2285.43 | 2092 | 2040 | 407.5 |
| B | 4 | 48 | 84084 | 201.35 | 2092 | 2040 | 407.5 |
| B | 4 | 81 | 52248 | 123.22 | 2092 | 2040 | 407.5 |
| C | 2 | 53 | 7312536 | 15696.57 | 1987 | 1995 | 465.7 |
| C | 14 | 67 | 30295 | 60.76 | 1987 | 1995 | 465.7 |
| C | 13 | 61 | 16840 | 31.87 | 1987 | 1995 | 465.7 |
| D | 13 | 25 | 838082 | 1731.4 | 1978 | 1920 | 482.9 |
| D | 14 | 34 | 486752 | 1003.92 | 1978 | 1920 | 482.9 |
| D | 13 | 223 | 182210 | 373.32 | 1978 | 1920 | 482.9 |
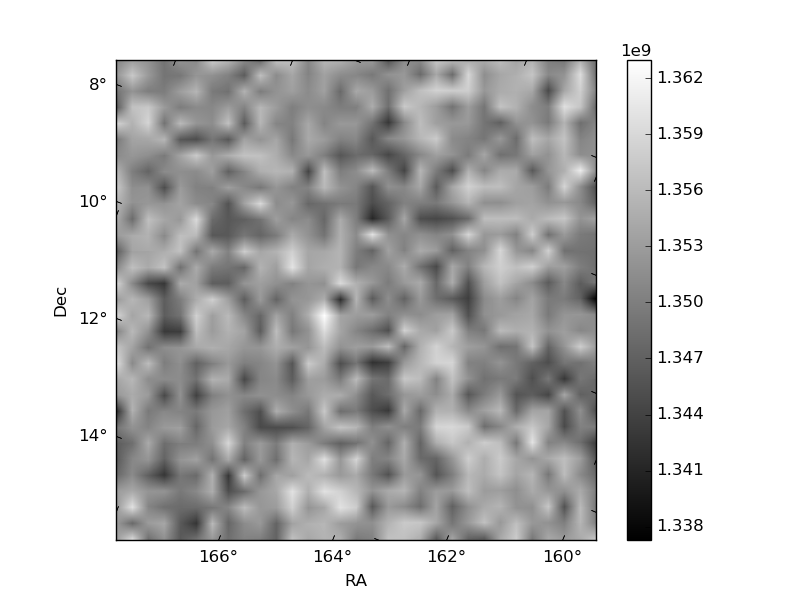
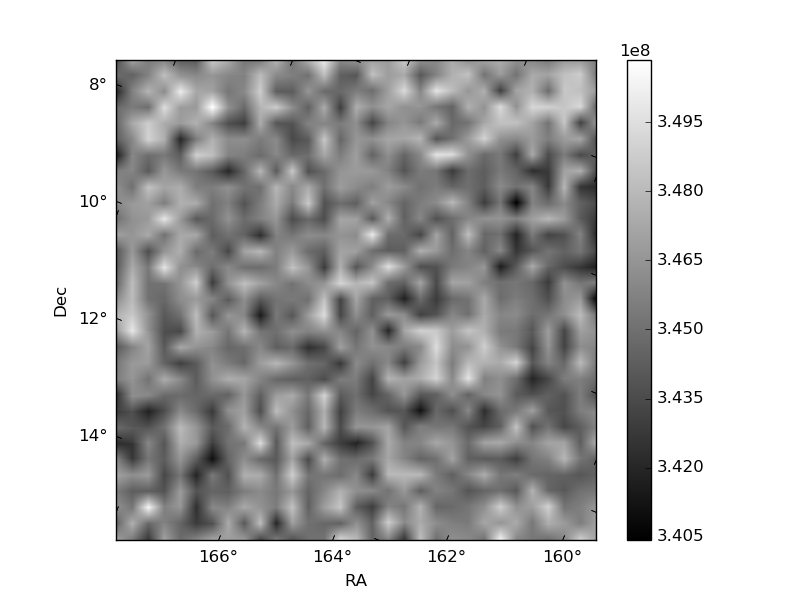
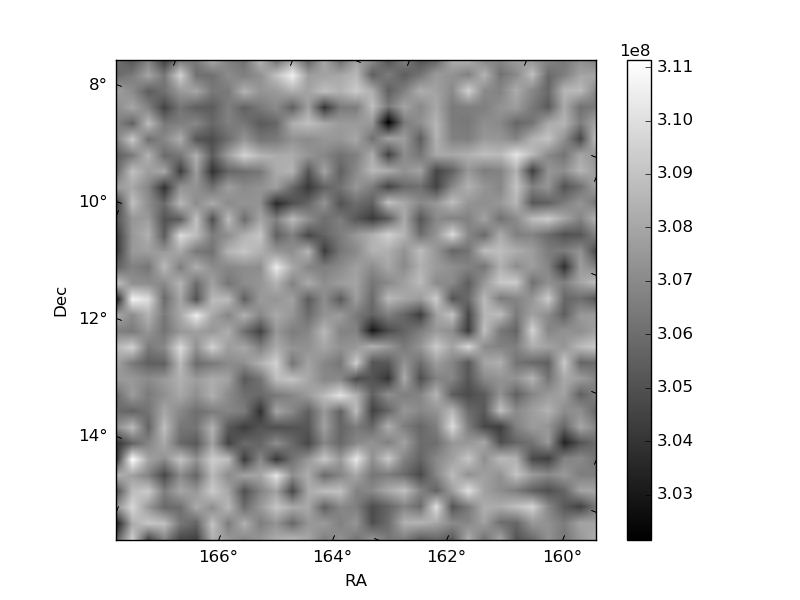
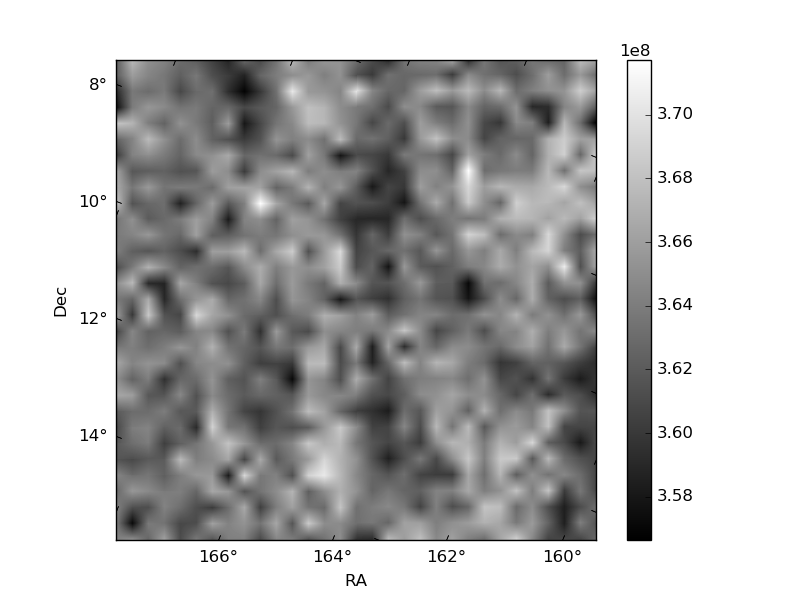
Histogram calculated using DETX and DETY for each event in the final _common_clean file
| Quadrant A | 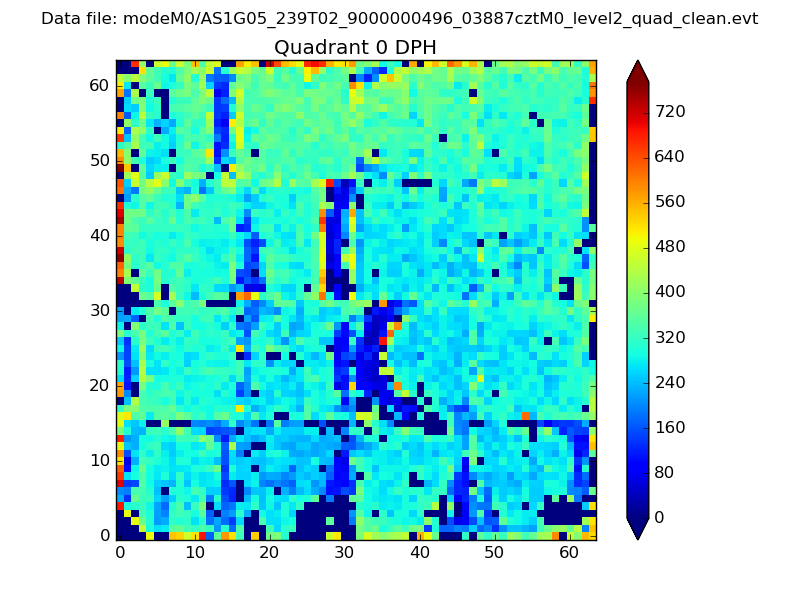 |
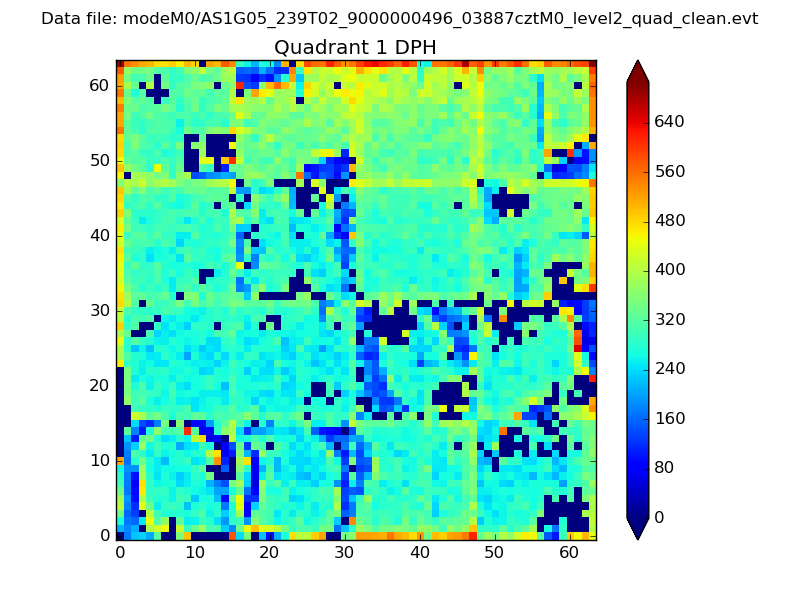 |
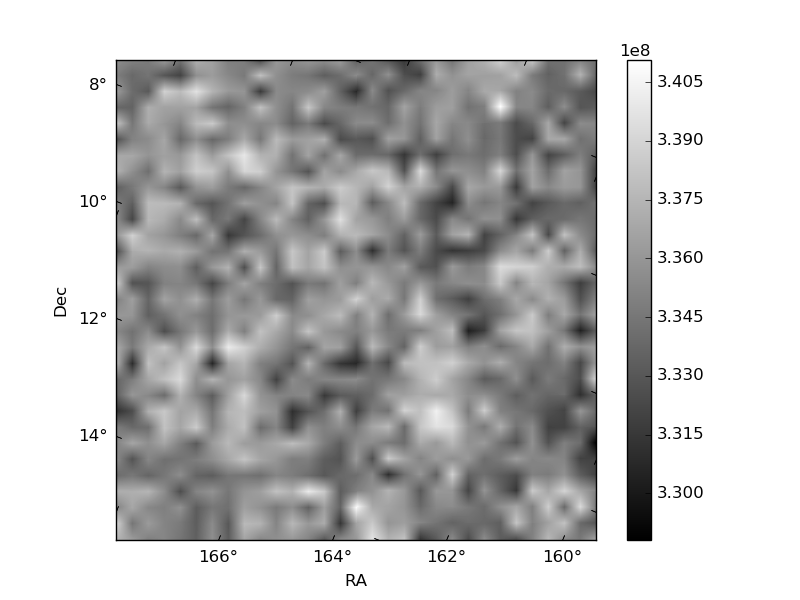
Quadrant B |
|---|---|---|---|
| Quadrant D | 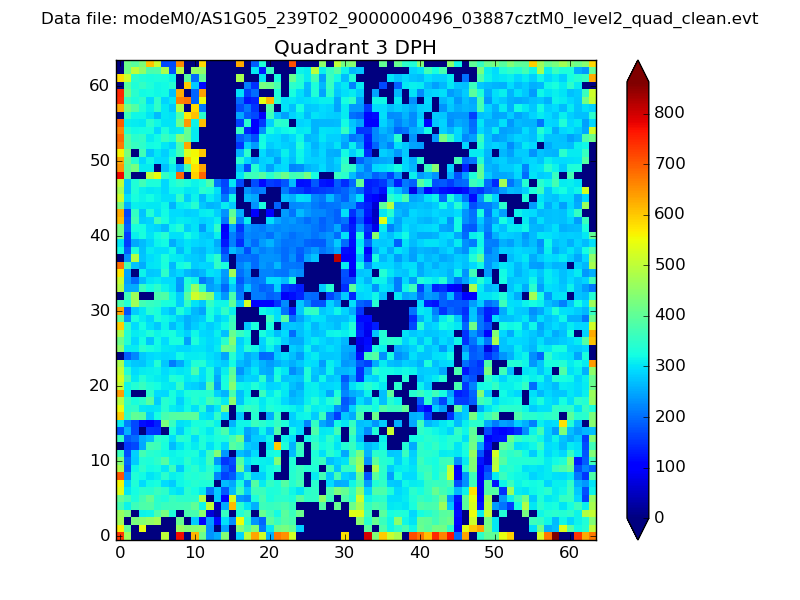 |
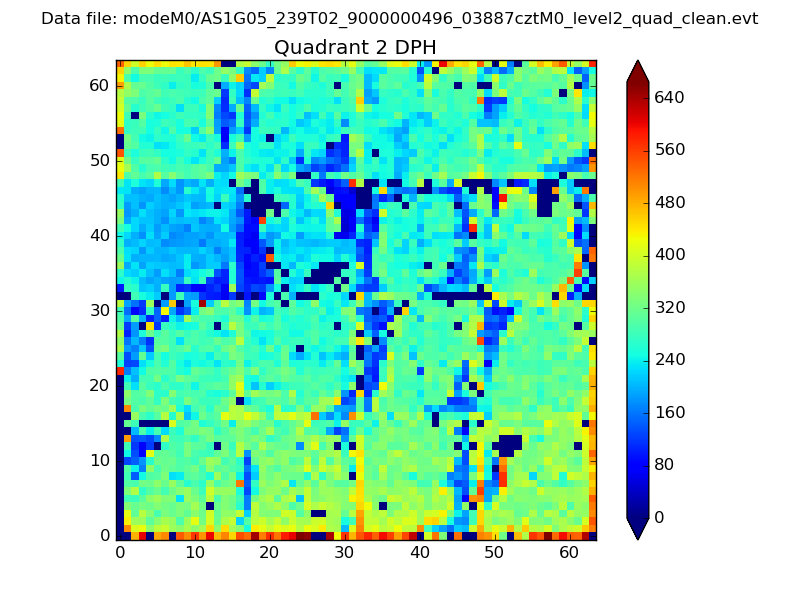 |
Quadrant C |
| Plot type | Count rate plots | Images |
|---|---|---|
| Comparison with Poisson distribution Blue bars denote a histogram of data divided into 1 sec bins. Red curve is a Poisson curve with rate = median count rate of data. |
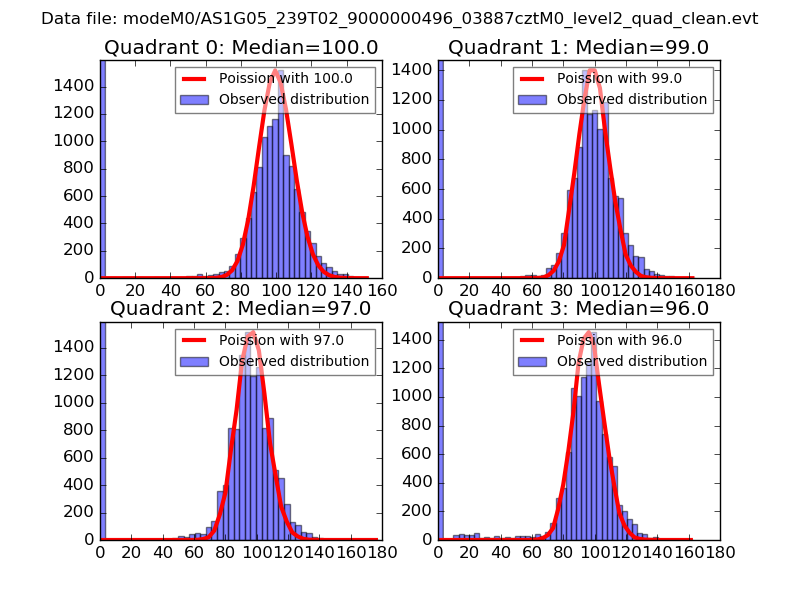 |
 |
| Quadrant-wise count rates Data is divided into 100 sec bins |
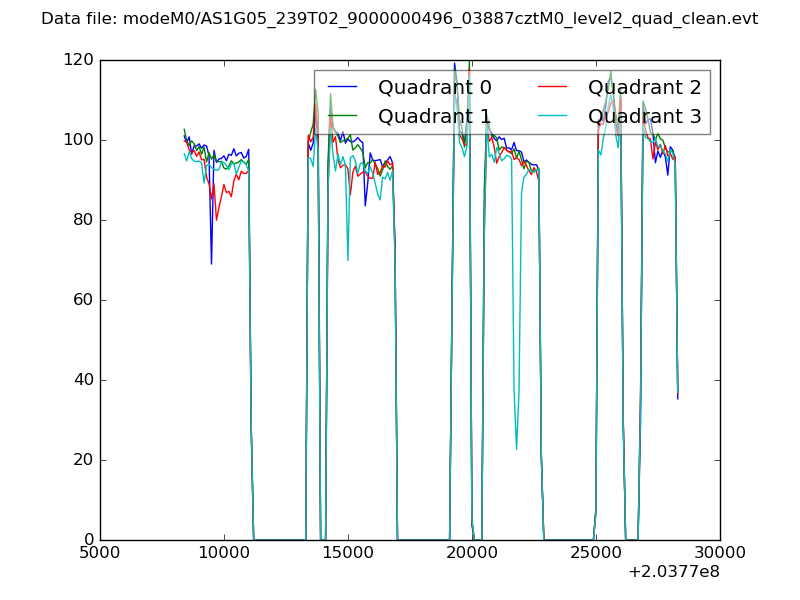 |
|
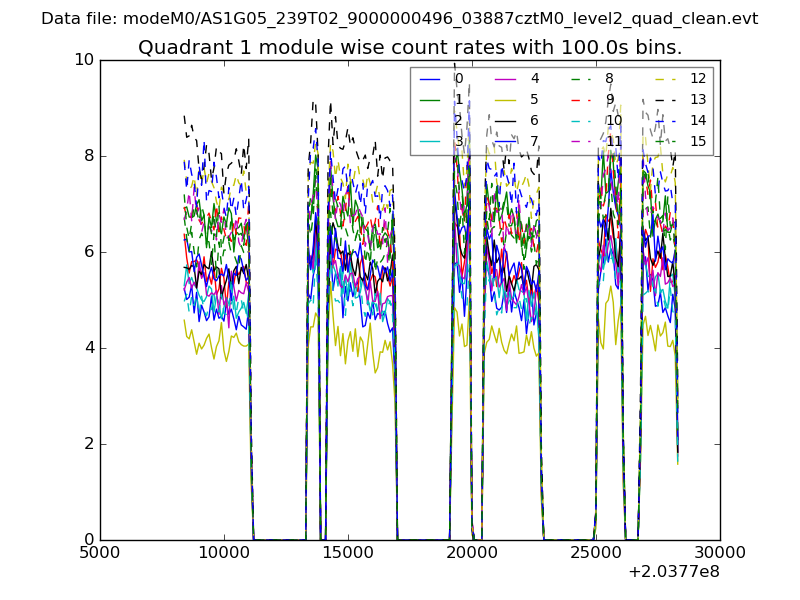
| Module-wise count rates for Quadrant A Data is divided into 100 sec bins |
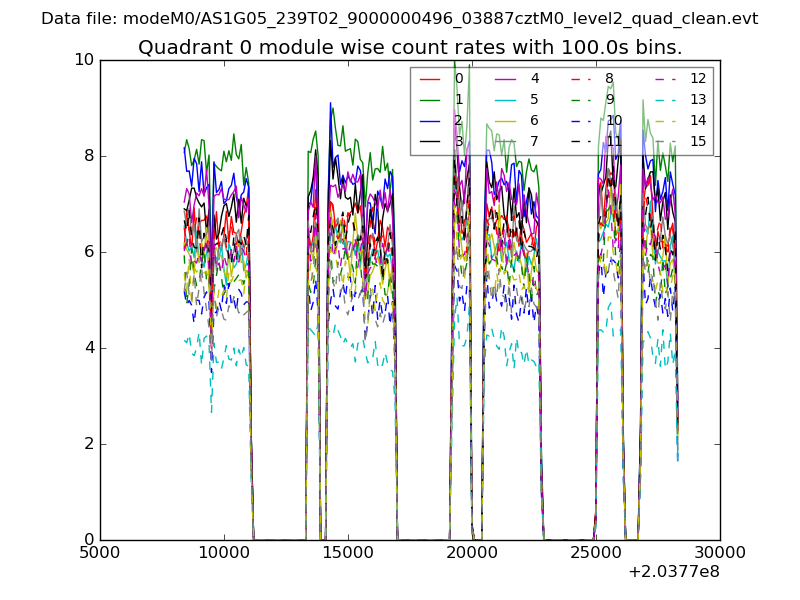 |
 |
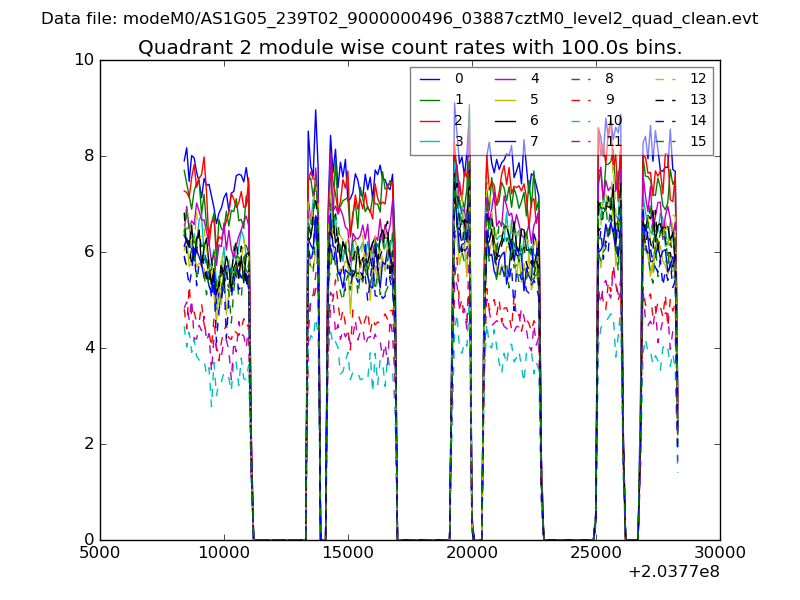
| Module-wise count rates for Quadrant B Data is divided into 100 sec bins |
 |
 |
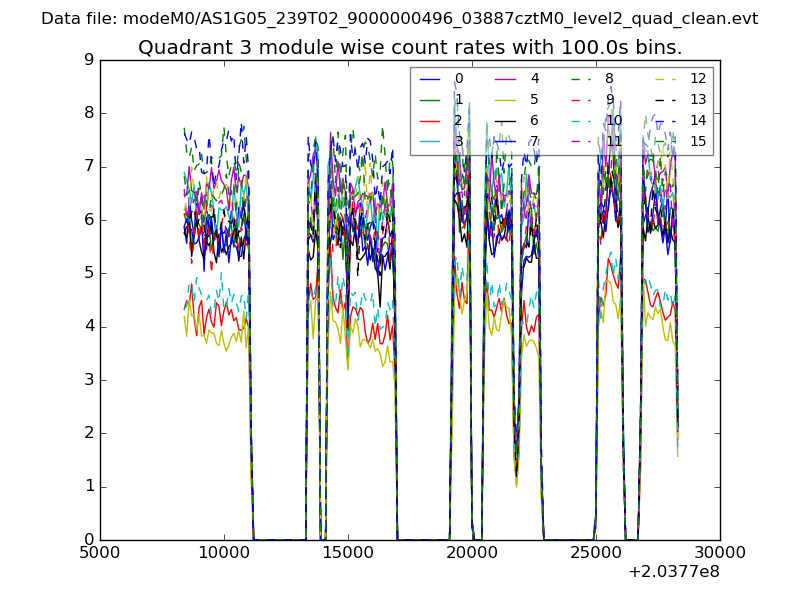
| Module-wise count rates for Quadrant C Data is divided into 100 sec bins |
 |
 |
| Module-wise count rates for Quadrant D Data is divided into 100 sec bins |
 |
 |
| Parameter | Plot |
|---|---|
| CZT HV Monitor | 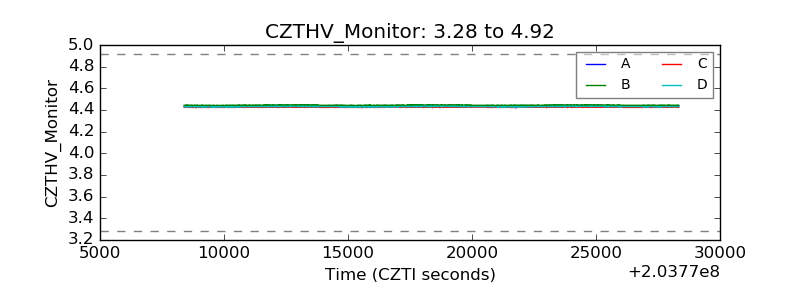 |
| D_VDD | 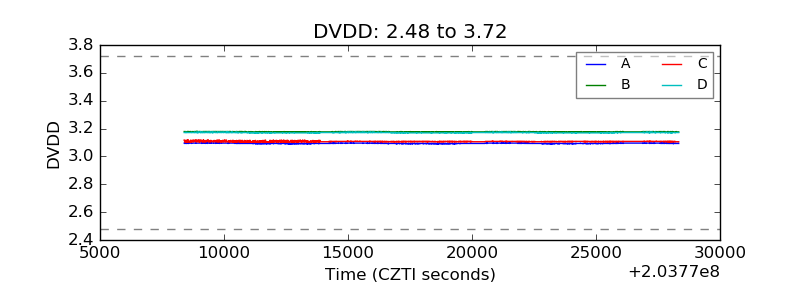 |
| Temperature 1 | 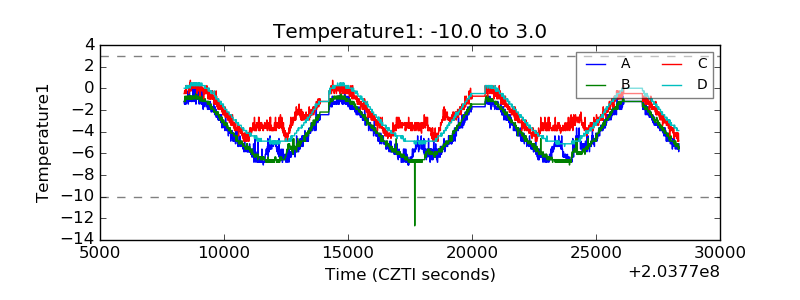 |
| Veto HV Monitor | 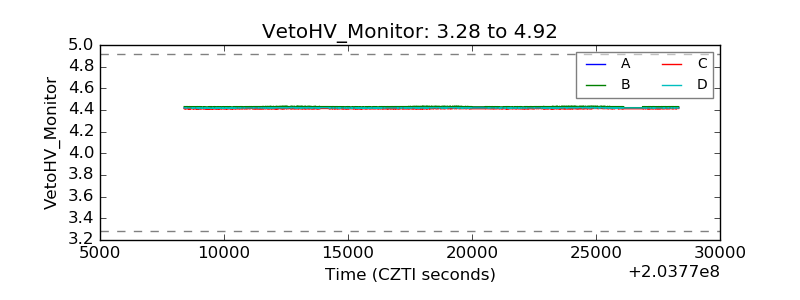 |
| Veto LLD | 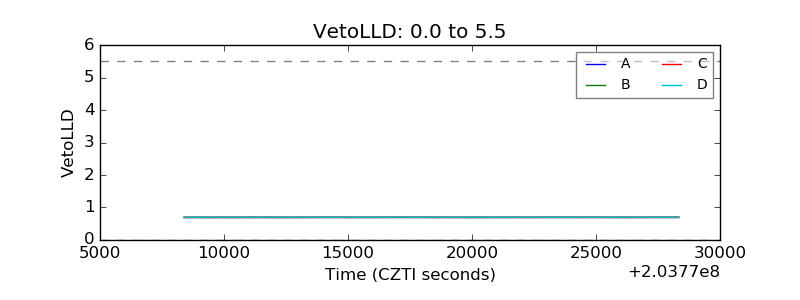 |
| Alpha Counter | 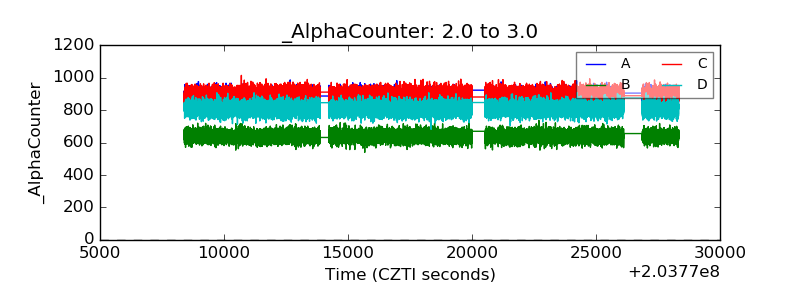 |
| _CPM_Rate | 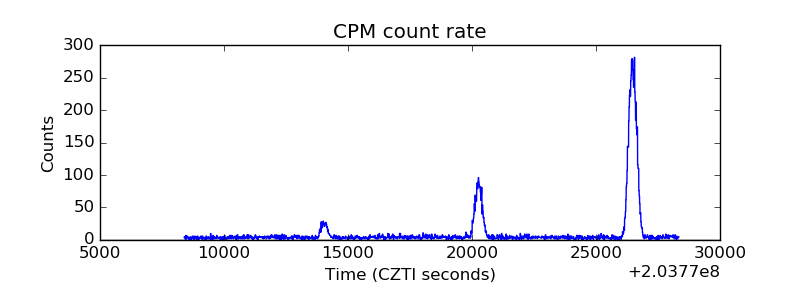 |
| CZT Counter | 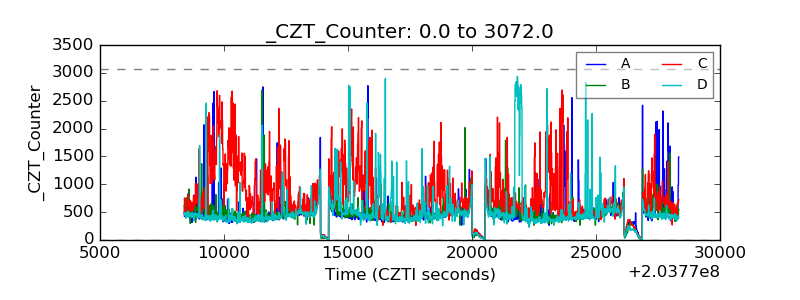 |
| +2.5 Volts monitor |  |
| +5 Volts monitor |  |
| Veto Counter | 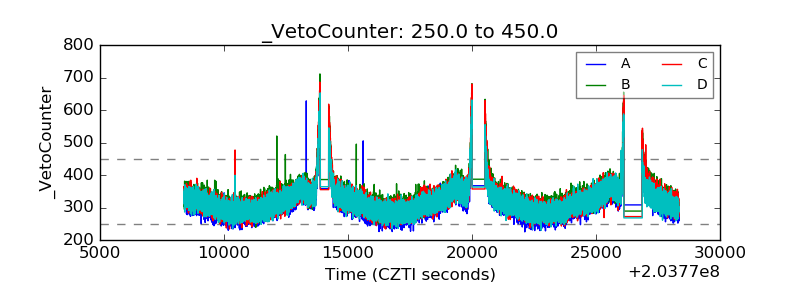 |