| Param | Original file | Final file |
|---|---|---|
| Filename | modeM0/AS1G05_239T02_9000000496_03888cztM0_level2.evt | modeM0/AS1G05_239T02_9000000496_03888cztM0_level2_quad_clean.evt |
| Size (bytes) | 620,182,080 | 74,548,800 |
| Size | 591.5 MB | 71.1 MB |
| Events in quadrant A | 5,479,284 | 432,908 |
| Events in quadrant B | 3,451,546 | 463,890 |
| Events in quadrant C | 5,952,147 | 441,853 |
| Events in quadrant D | 3,440,004 | 445,105 |
| Mode M0 | |||
|---|---|---|---|
| Quadrant | BADHDUFLAG | Total packets | Discarded packets |
| A | 0 | 20871 | 3 |
| B | 0 | 14954 | 2 |
| C | 0 | 22492 | 2 |
| D | 0 | 15297 | 2 |
| Mode M9 | |||
|---|---|---|---|
| Quadrant | BADHDUFLAG | Total packets | Discarded packets |
| A | 0 | 15 | 0 |
| B | 0 | 15 | 0 |
| C | 0 | 15 | 0 |
| D | 0 | 15 | 0 |
| Mode SS | |||
|---|---|---|---|
| Quadrant | BADHDUFLAG | Total packets | Discarded packets |
| A | 0 | 138 | 0 |
| B | 0 | 138 | 0 |
| C | 0 | 138 | 0 |
| D | 0 | 138 | 0 |
| Quadrant | Total seconds | Saturated seconds | Saturation percentage |
|---|---|---|---|
| A | 6788 | 703 | 10.356511% |
| B | 6788 | 29 | 0.427225% |
| C | 6788 | 299 | 4.404832% |
| D | 6788 | 88 | 1.296405% |
Noise dominated data is calculated using 1-second bins in cleaned event files. If a bin has >2000 counts, and if more than 50% of those come from <1% of pixels, then it is considered to be noise-dominated and hence unusable.
| Quadrant | # 1 sec bins | Bins with >0 counts | Bins with >2000 counts | High rate bins dominated by noise | Noise dominated (total time) | Noise dominated (detector-on time) | Marked lightcurve |
|---|---|---|---|---|---|---|---|
| A | 7733 | 6788 | 532 | 532 | 6.88% | 7.84% | 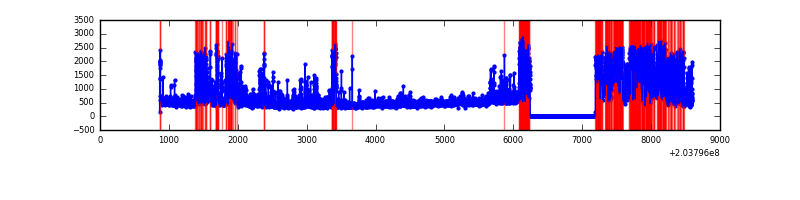 |
| B | 7733 | 6788 | 1 | 1 | 0.01% | 0.01% |  |
| C | 7733 | 6788 | 322 | 322 | 4.16% | 4.74% | 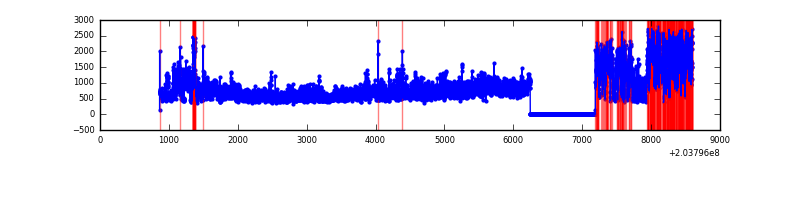 |
| D | 7733 | 6789 | 99 | 99 | 1.28% | 1.46% |  |
Top three noisy pixels from each quadrant. If the there are fewer than three noisy pixels in the level2.evt file, extra rows are filled as -1
| Pixel properties | Quadrant properties | ||||||
|---|---|---|---|---|---|---|---|
| Quadrant | DetID | PixID | Counts | Sigma | Mean | Median | Sigma |
| A | 0 | 199 | 1769384 | 11526.11 | 732 | 715 | 153.4 |
| A | 8 | 15 | 420760 | 2737.36 | 732 | 715 | 153.4 |
| A | 0 | 118 | 212055 | 1377.27 | 732 | 715 | 153.4 |
| B | 15 | 204 | 359371 | 2369.83 | 771 | 753 | 151.3 |
| B | 4 | 48 | 25123 | 161.04 | 771 | 753 | 151.3 |
| B | 0 | 183 | 22919 | 146.48 | 771 | 753 | 151.3 |
| C | 2 | 53 | 3079456 | 18001.65 | 729 | 733 | 171.0 |
| C | 14 | 67 | 20035 | 112.86 | 729 | 733 | 171.0 |
| C | 13 | 61 | 6180 | 31.85 | 729 | 733 | 171.0 |
| D | 9 | 82 | 414012 | 2291.97 | 733 | 712 | 180.3 |
| D | 13 | 248 | 91896 | 505.66 | 733 | 712 | 180.3 |
| D | 13 | 223 | 20708 | 110.89 | 733 | 712 | 180.3 |
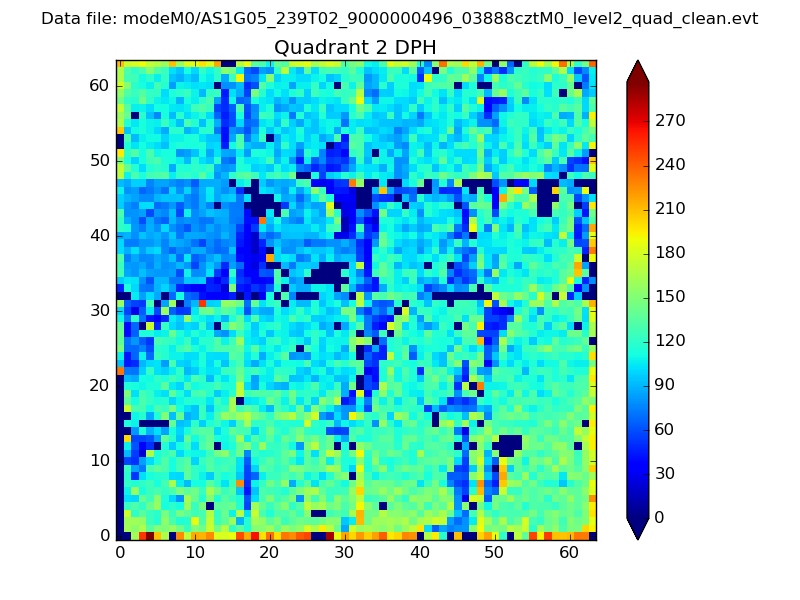
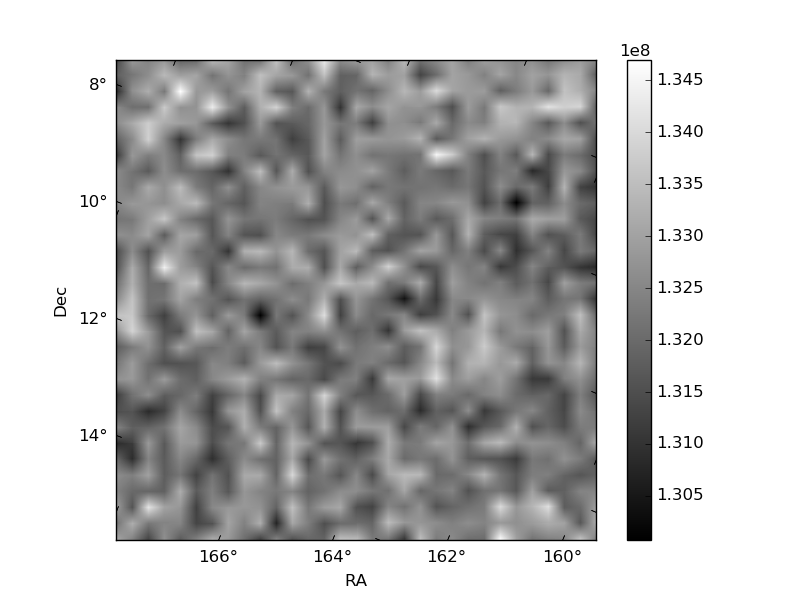
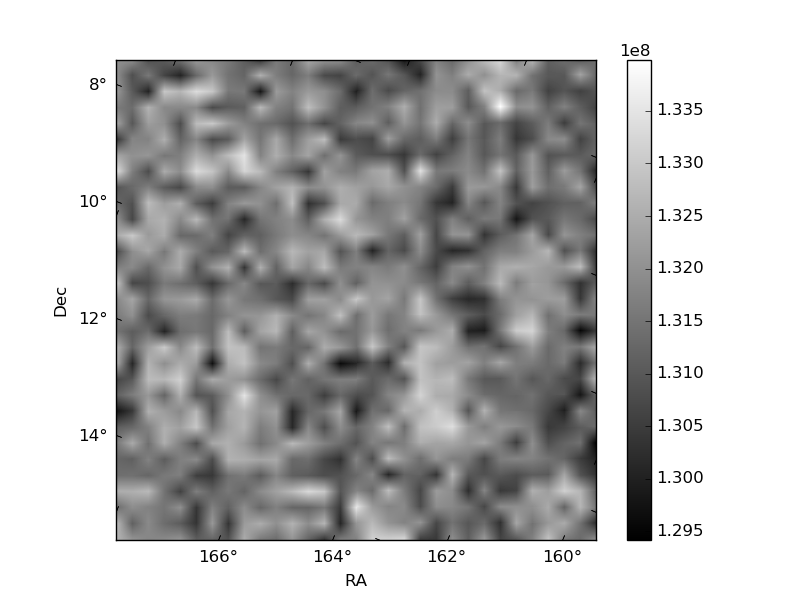
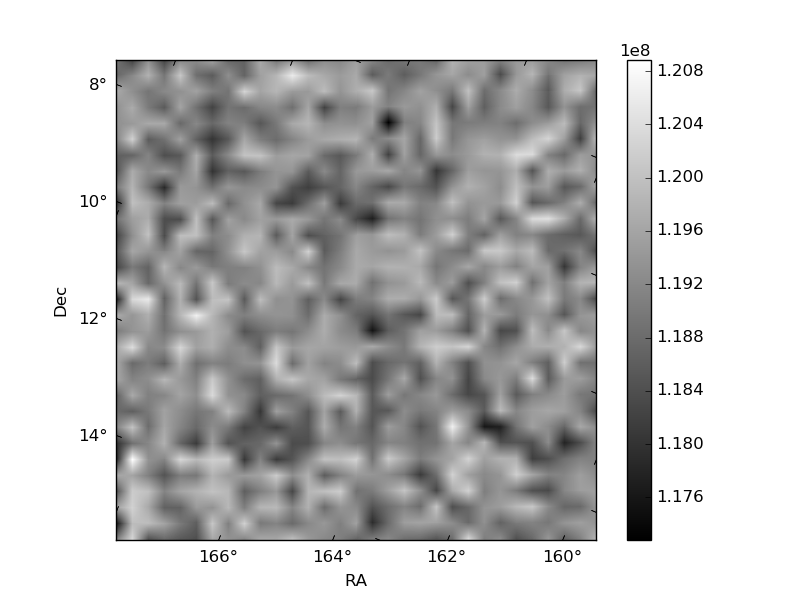
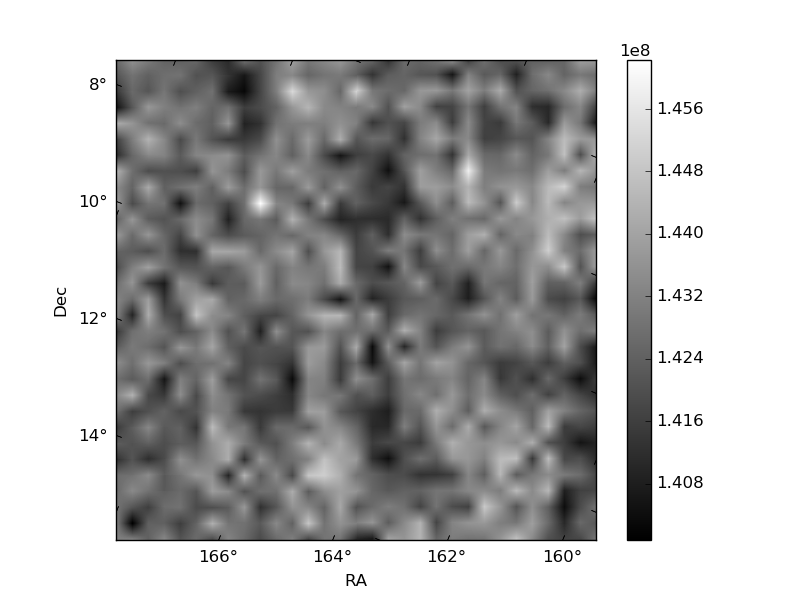
Histogram calculated using DETX and DETY for each event in the final _common_clean file
| Quadrant A | 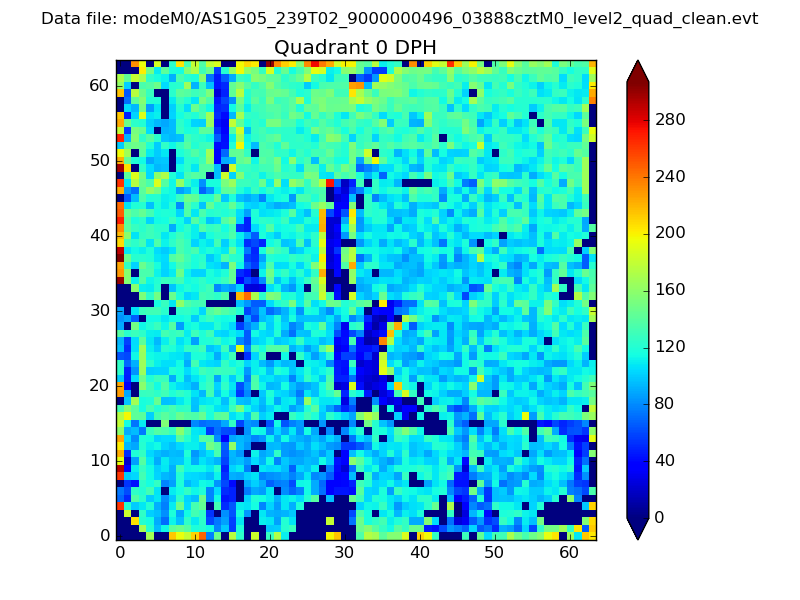 |
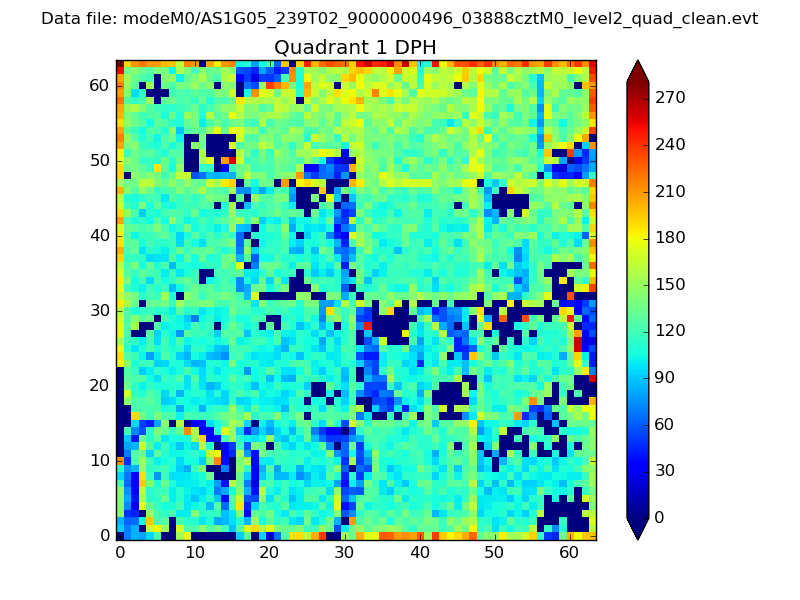 |
Quadrant B |
|---|---|---|---|
| Quadrant D | 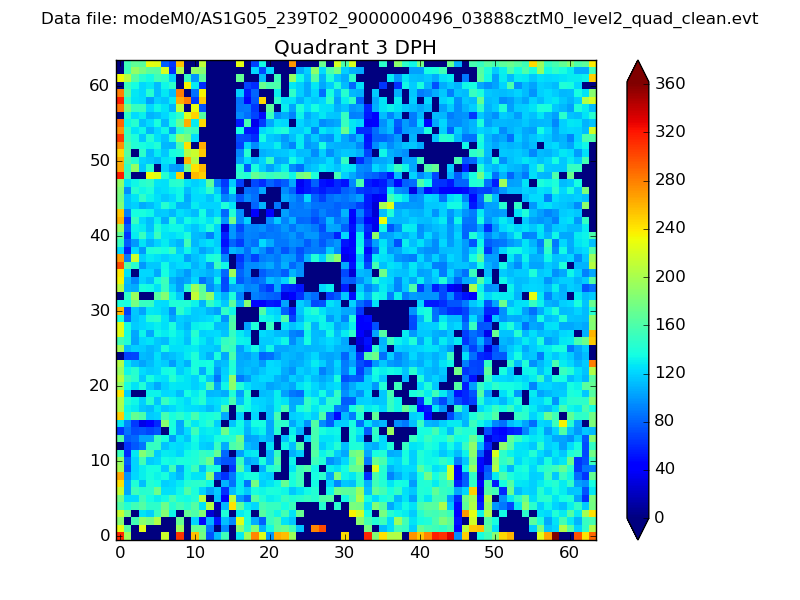 |
 |
Quadrant C |
| Plot type | Count rate plots | Images |
|---|---|---|
| Comparison with Poisson distribution Blue bars denote a histogram of data divided into 1 sec bins. Red curve is a Poisson curve with rate = median count rate of data. |
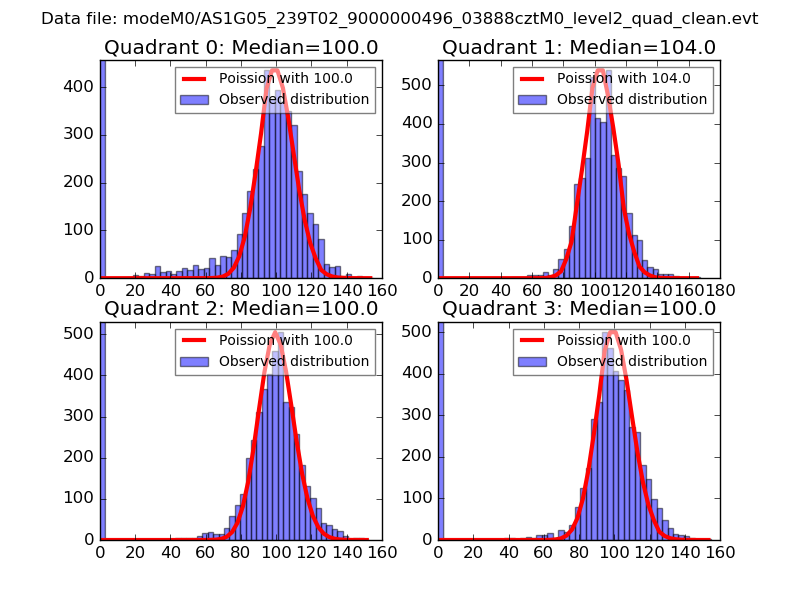 |
 |
| Quadrant-wise count rates Data is divided into 100 sec bins |
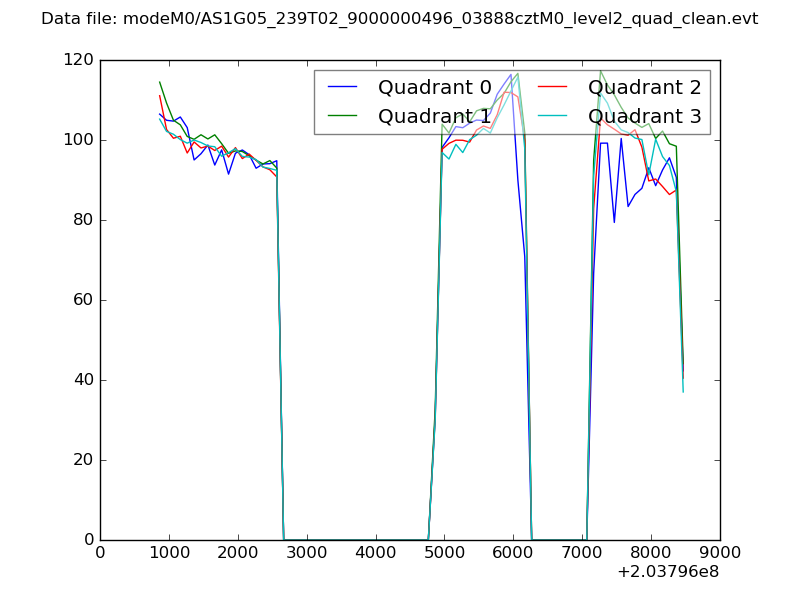 |
|
| Module-wise count rates for Quadrant A Data is divided into 100 sec bins |
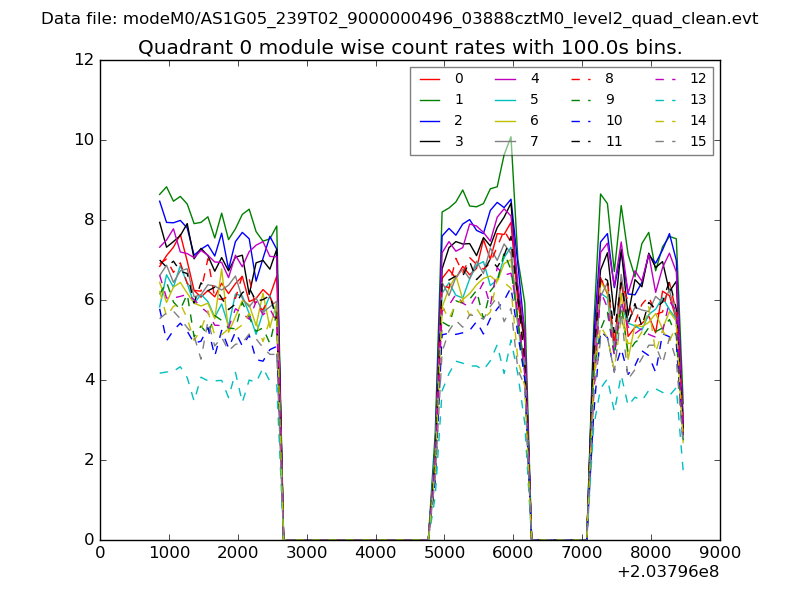 |
 |
| Module-wise count rates for Quadrant B Data is divided into 100 sec bins |
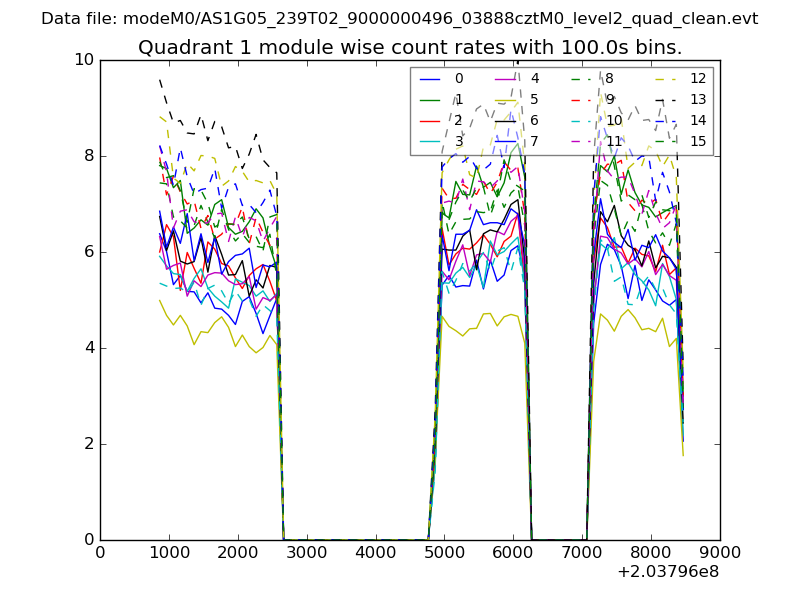 |
 |
| Module-wise count rates for Quadrant C Data is divided into 100 sec bins |
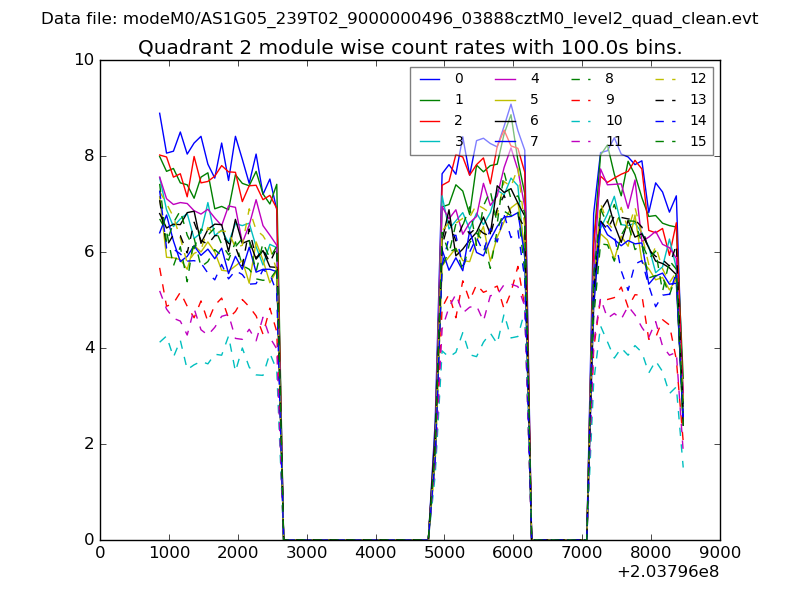 |
 |
| Module-wise count rates for Quadrant D Data is divided into 100 sec bins |
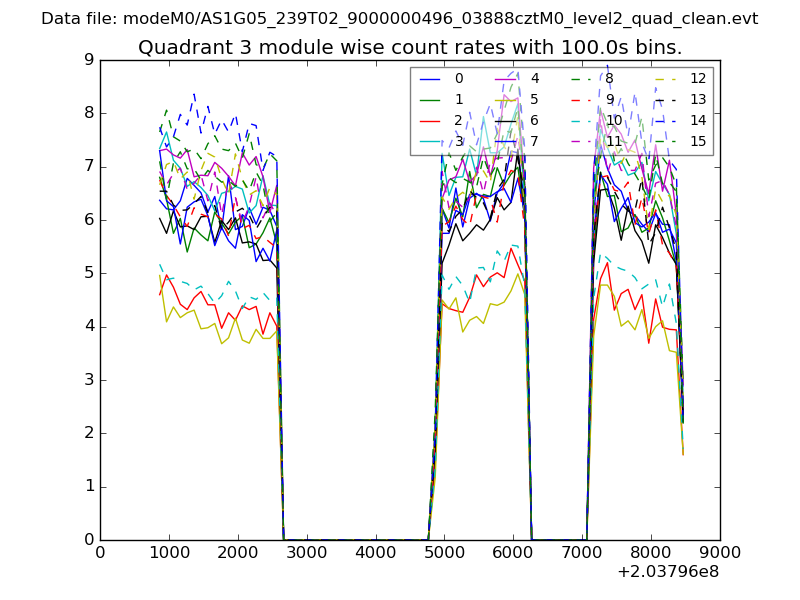 |
 |
| Parameter | Plot |
|---|---|
| CZT HV Monitor | 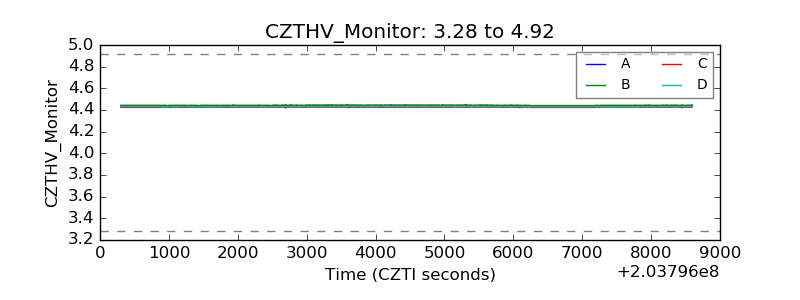 |
| D_VDD | 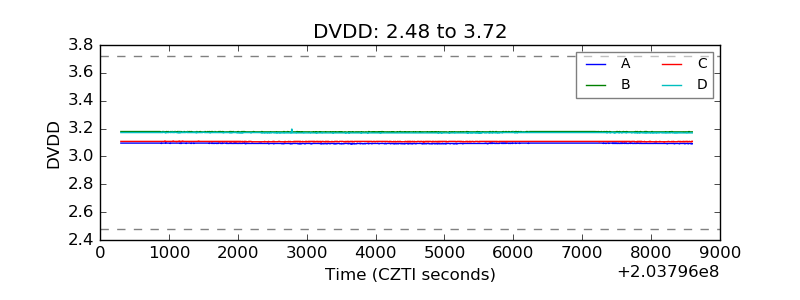 |
| Temperature 1 | 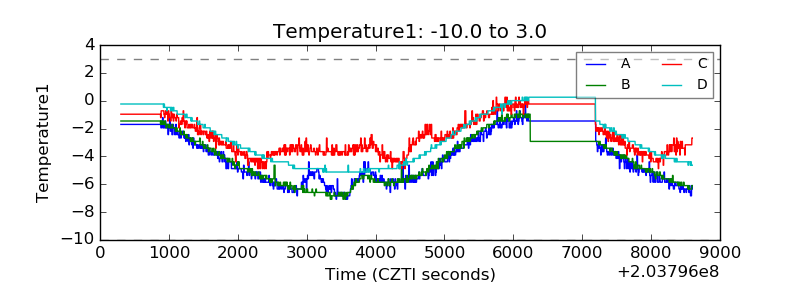 |
| Veto HV Monitor |  |
| Veto LLD | 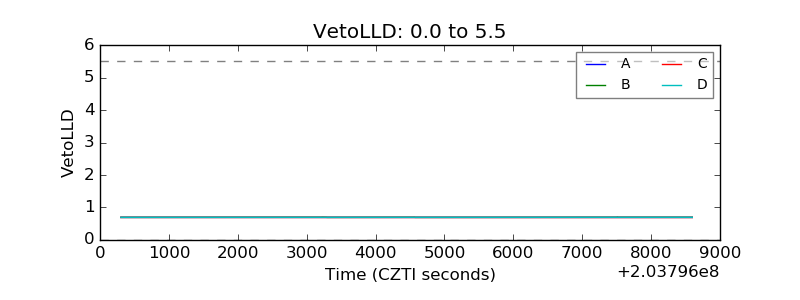 |
| Alpha Counter | 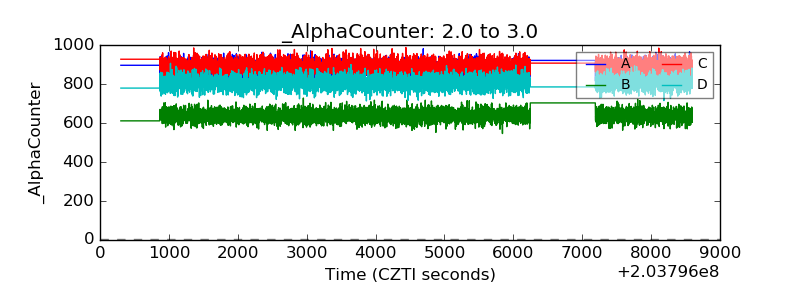 |
| _CPM_Rate | 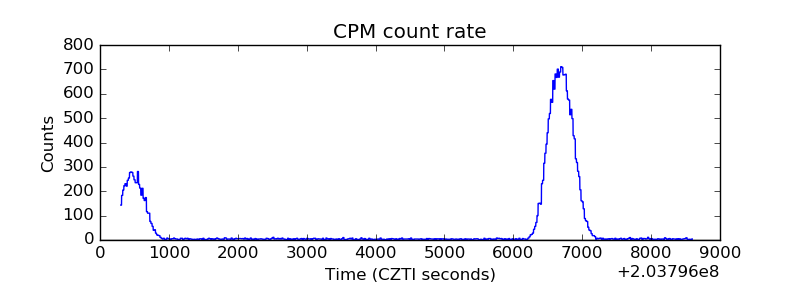 |
| CZT Counter | 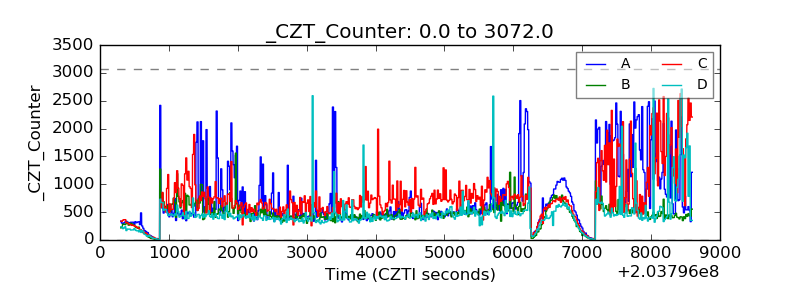 |
| +2.5 Volts monitor |  |
| +5 Volts monitor |  |
| Veto Counter | 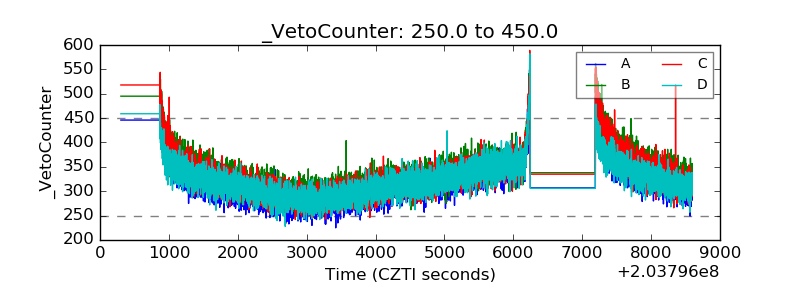 |