| Param | Original file | Final file |
|---|---|---|
| Filename | modeM0/AS1G05_239T02_9000000496_03889cztM0_level2.evt | modeM0/AS1G05_239T02_9000000496_03889cztM0_level2_quad_clean.evt |
| Size (bytes) | 701,225,280 | 65,658,240 |
| Size | 668.7 MB | 62.6 MB |
| Events in quadrant A | 4,533,593 | 383,537 |
| Events in quadrant B | 3,306,157 | 404,278 |
| Events in quadrant C | 8,711,562 | 370,971 |
| Events in quadrant D | 4,251,648 | 380,205 |
| Mode M0 | |||
|---|---|---|---|
| Quadrant | BADHDUFLAG | Total packets | Discarded packets |
| A | 0 | 17879 | 2 |
| B | 0 | 14145 | 1 |
| C | 0 | 30383 | 1 |
| D | 0 | 17266 | 1 |
| Mode M9 | |||
|---|---|---|---|
| Quadrant | BADHDUFLAG | Total packets | Discarded packets |
| A | 0 | 11 | 0 |
| B | 0 | 11 | 0 |
| C | 0 | 11 | 0 |
| D | 0 | 11 | 0 |
| Mode SS | |||
|---|---|---|---|
| Quadrant | BADHDUFLAG | Total packets | Discarded packets |
| A | 0 | 130 | 0 |
| B | 0 | 130 | 0 |
| C | 0 | 130 | 0 |
| D | 0 | 130 | 0 |
| Quadrant | Total seconds | Saturated seconds | Saturation percentage |
|---|---|---|---|
| A | 6430 | 464 | 7.216174% |
| B | 6430 | 81 | 1.259720% |
| C | 6430 | 1017 | 15.816485% |
| D | 6430 | 250 | 3.888025% |
Noise dominated data is calculated using 1-second bins in cleaned event files. If a bin has >2000 counts, and if more than 50% of those come from <1% of pixels, then it is considered to be noise-dominated and hence unusable.
| Quadrant | # 1 sec bins | Bins with >0 counts | Bins with >2000 counts | High rate bins dominated by noise | Noise dominated (total time) | Noise dominated (detector-on time) | Marked lightcurve |
|---|---|---|---|---|---|---|---|
| A | 7500 | 6430 | 351 | 351 | 4.68% | 5.46% | 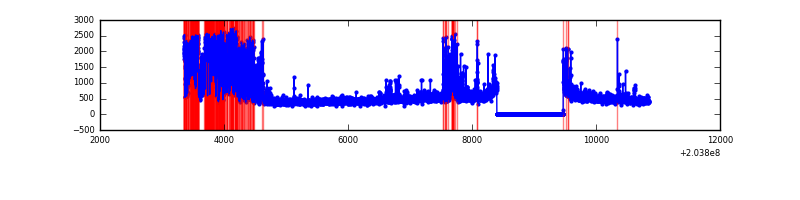 |
| B | 7500 | 6430 | 30 | 30 | 0.40% | 0.47% | 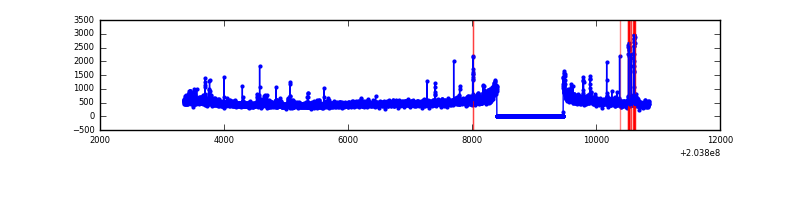 |
| C | 7500 | 6430 | 1086 | 1086 | 14.48% | 16.89% | 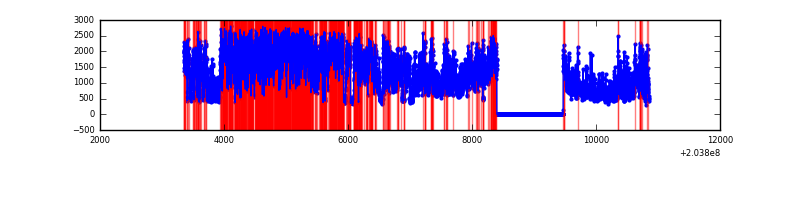 |
| D | 7500 | 6430 | 292 | 292 | 3.89% | 4.54% | 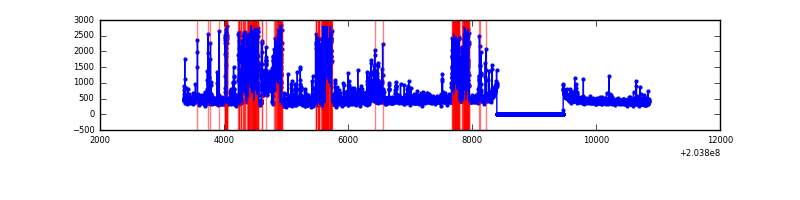 |
Top three noisy pixels from each quadrant. If the there are fewer than three noisy pixels in the level2.evt file, extra rows are filled as -1
| Pixel properties | Quadrant properties | ||||||
|---|---|---|---|---|---|---|---|
| Quadrant | DetID | PixID | Counts | Sigma | Mean | Median | Sigma |
| A | 0 | 199 | 1130353 | 7648.36 | 714 | 700 | 147.7 |
| A | 0 | 118 | 261184 | 1763.62 | 714 | 700 | 147.7 |
| A | 8 | 15 | 219857 | 1483.81 | 714 | 700 | 147.7 |
| B | 15 | 204 | 261778 | 1809.17 | 742 | 723 | 144.3 |
| B | 10 | 16 | 100639 | 692.44 | 742 | 723 | 144.3 |
| B | 0 | 183 | 14934 | 98.49 | 742 | 723 | 144.3 |
| C | 2 | 53 | 6000048 | 37653.12 | 680 | 685 | 159.3 |
| C | 14 | 67 | 28482 | 174.46 | 680 | 685 | 159.3 |
| C | 10 | 65 | 8438 | 48.66 | 680 | 685 | 159.3 |
| D | 9 | 82 | 1138614 | 6693.06 | 696 | 677 | 170.0 |
| D | 12 | 110 | 291807 | 1712.35 | 696 | 677 | 170.0 |
| D | 13 | 248 | 34674 | 199.96 | 696 | 677 | 170.0 |
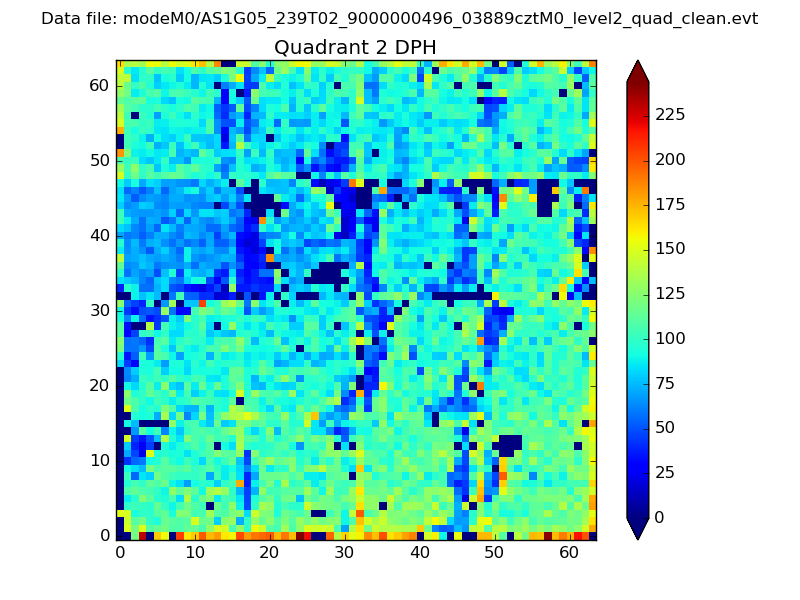
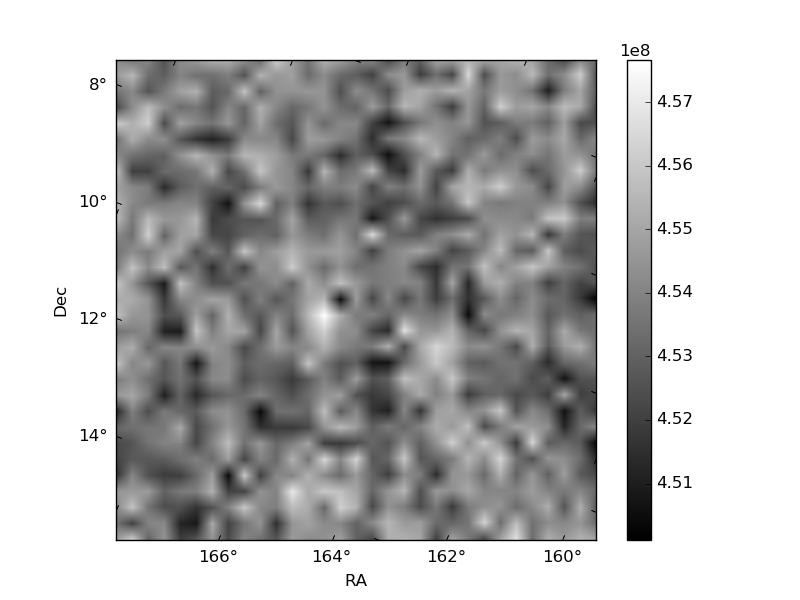
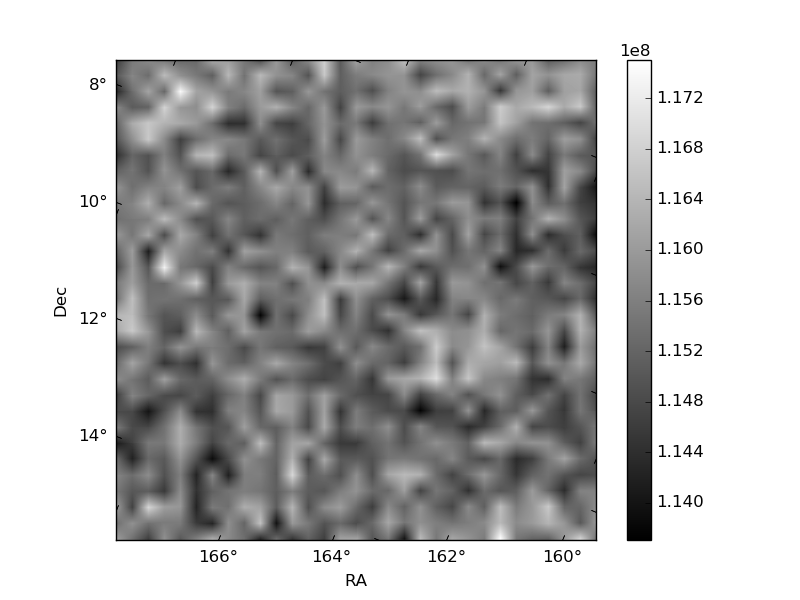
Histogram calculated using DETX and DETY for each event in the final _common_clean file
| Quadrant A | 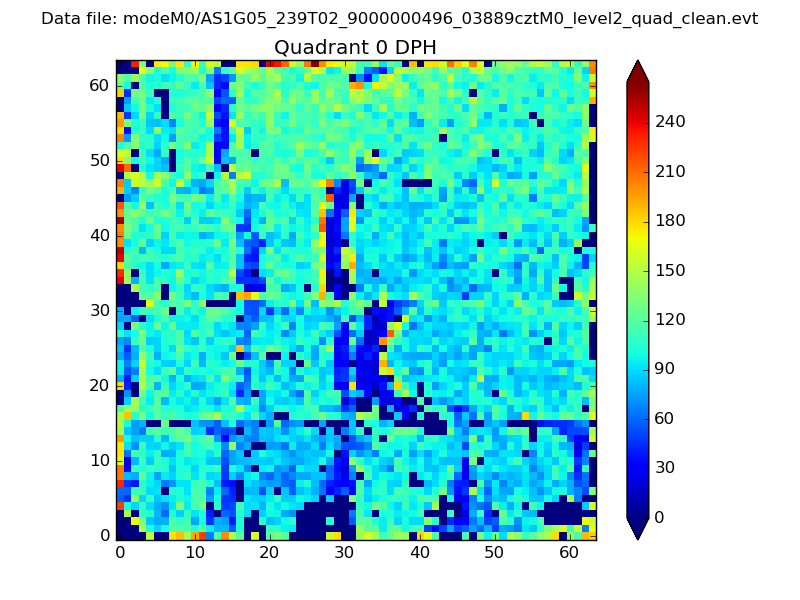 |
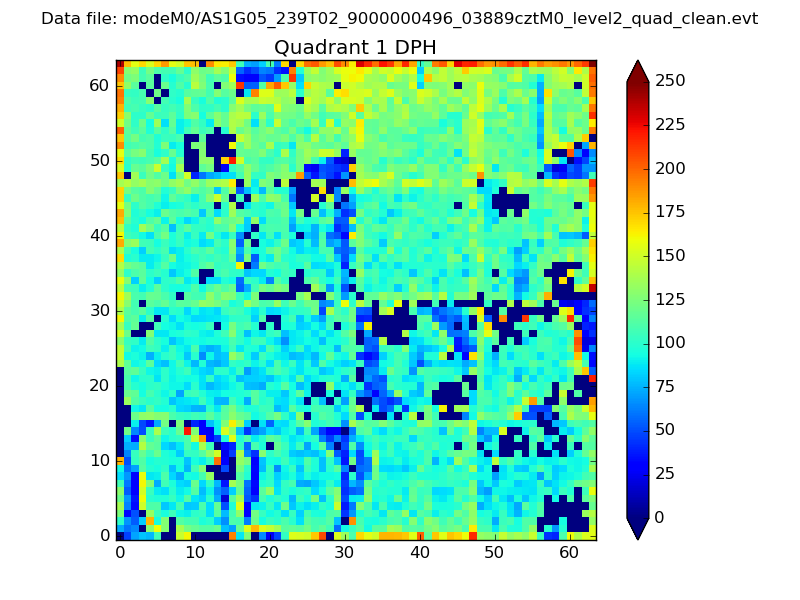 |
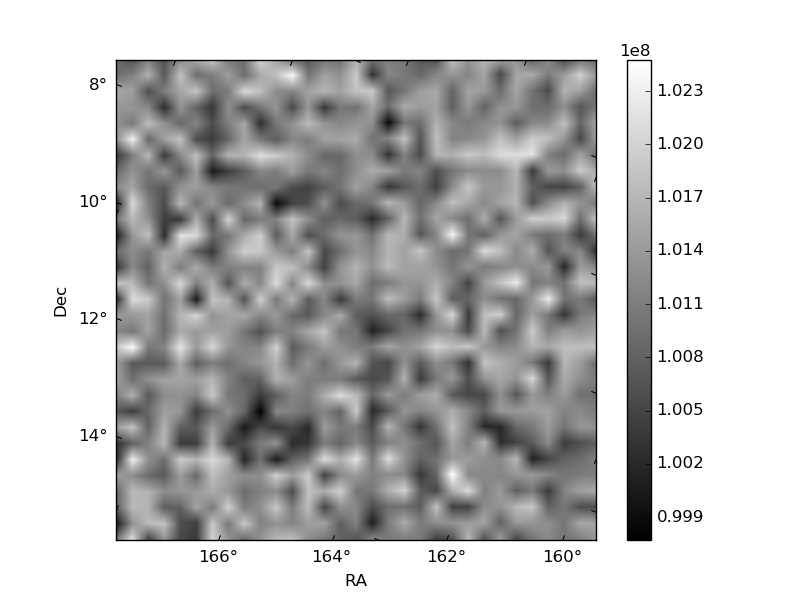
Quadrant B |
|---|---|---|---|
| Quadrant D | 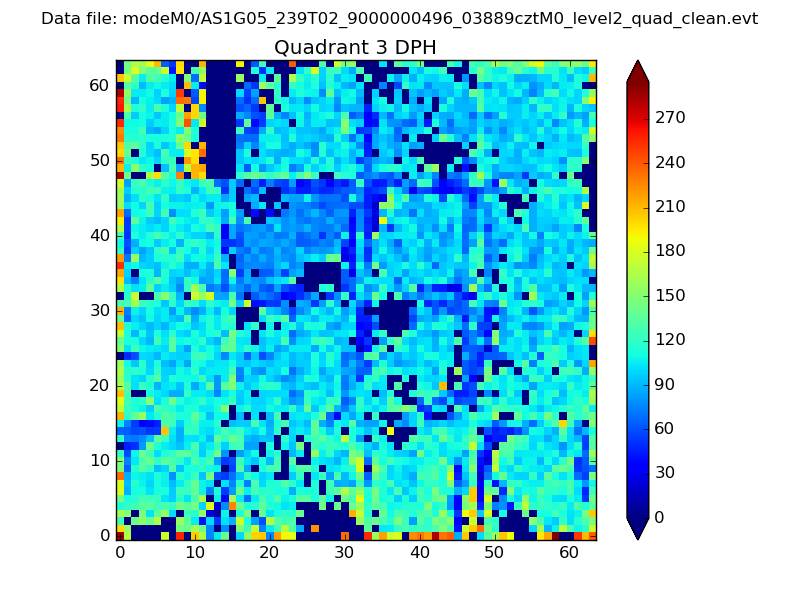 |
 |
Quadrant C |
| Plot type | Count rate plots | Images |
|---|---|---|
| Comparison with Poisson distribution Blue bars denote a histogram of data divided into 1 sec bins. Red curve is a Poisson curve with rate = median count rate of data. |
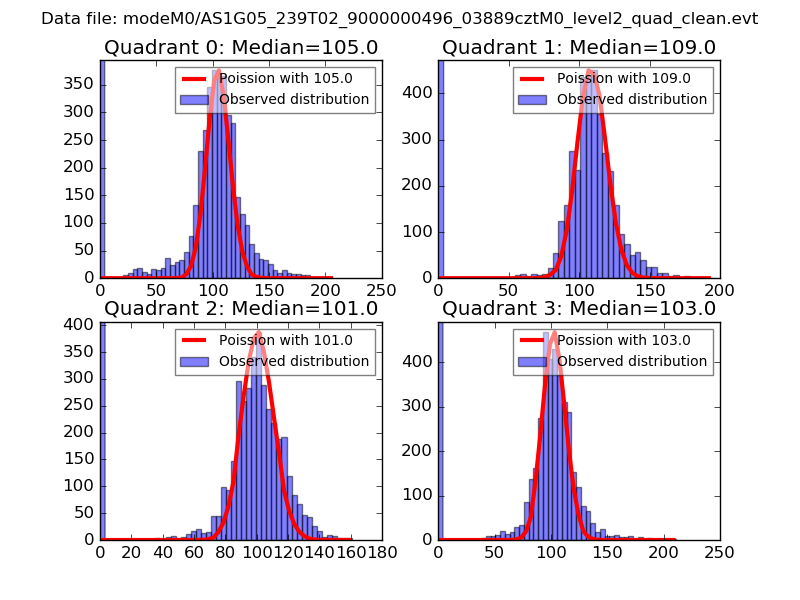 |
 |
| Quadrant-wise count rates Data is divided into 100 sec bins |
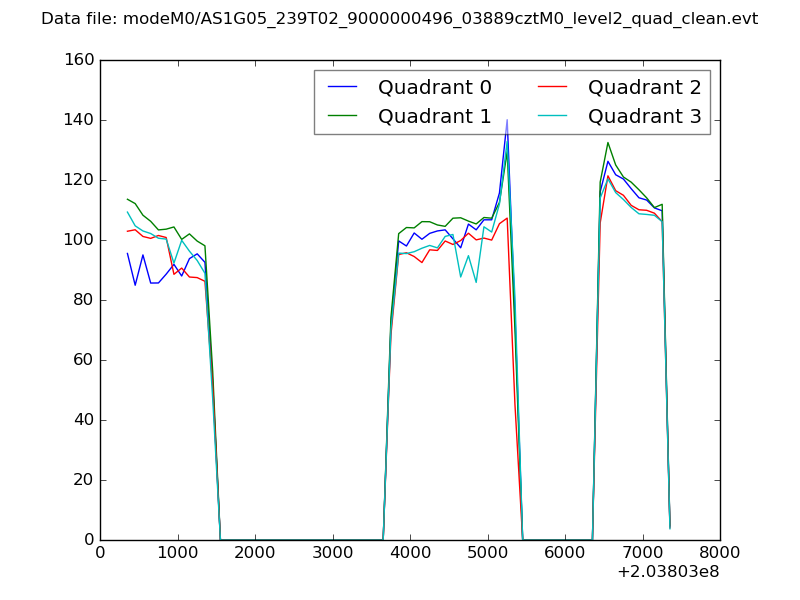 |
|
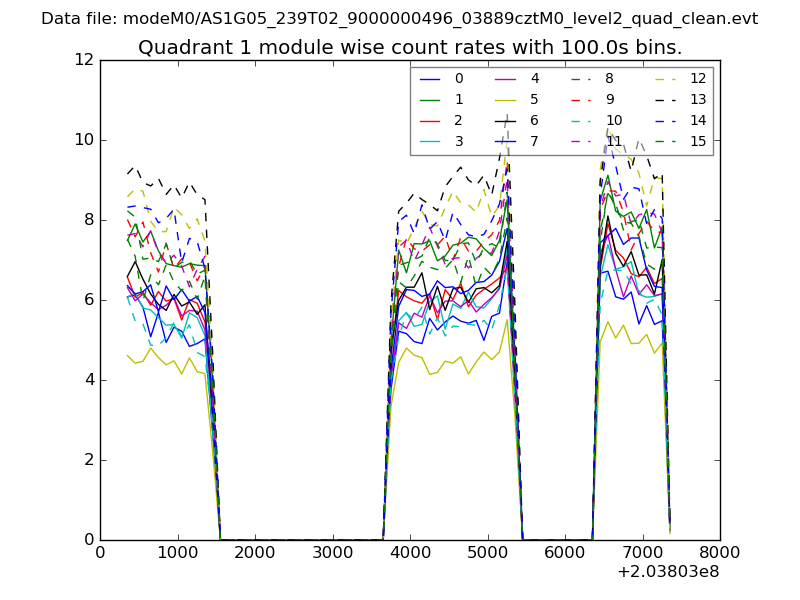
| Module-wise count rates for Quadrant A Data is divided into 100 sec bins |
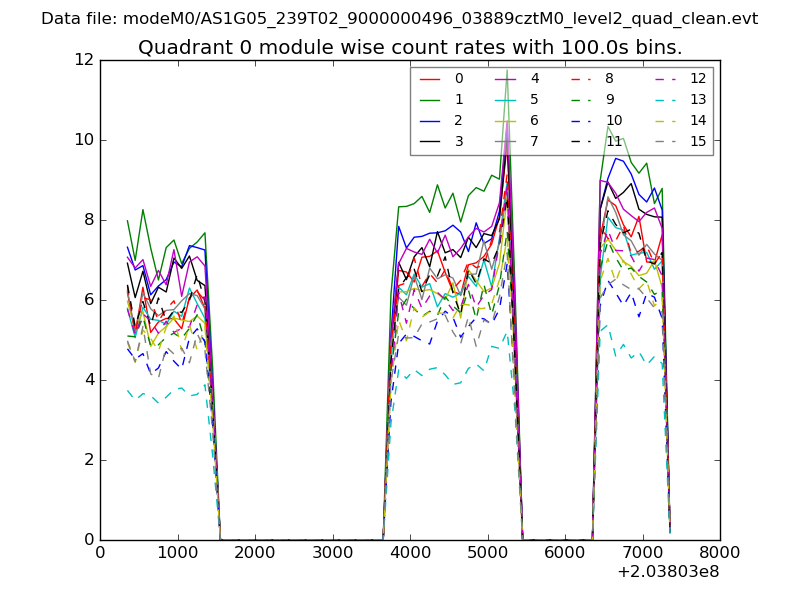 |
 |
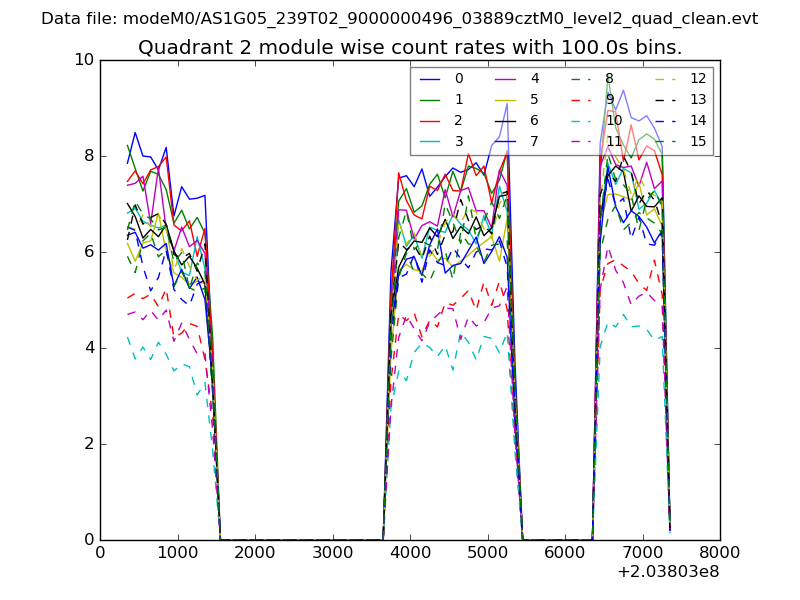
| Module-wise count rates for Quadrant B Data is divided into 100 sec bins |
 |
 |
| Module-wise count rates for Quadrant C Data is divided into 100 sec bins |
 |
 |
| Module-wise count rates for Quadrant D Data is divided into 100 sec bins |
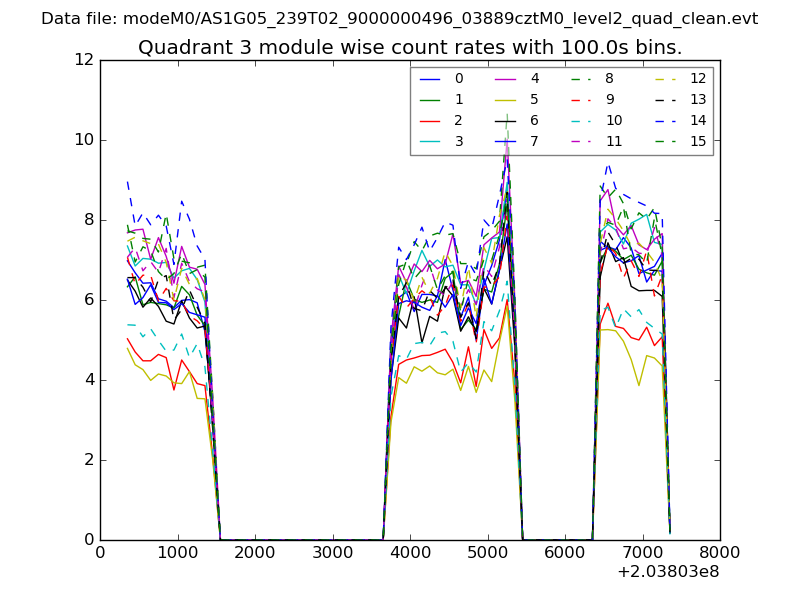 |
 |
| Parameter | Plot |
|---|---|
| CZT HV Monitor | 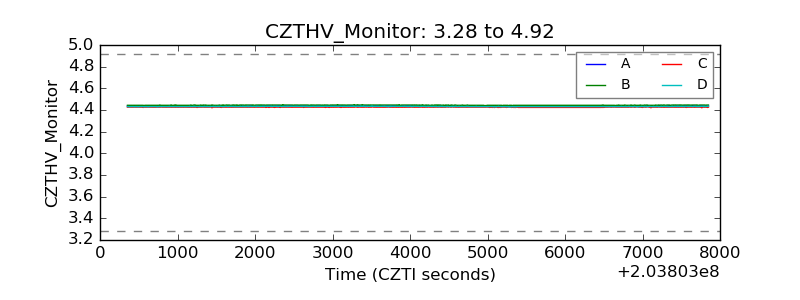 |
| D_VDD | 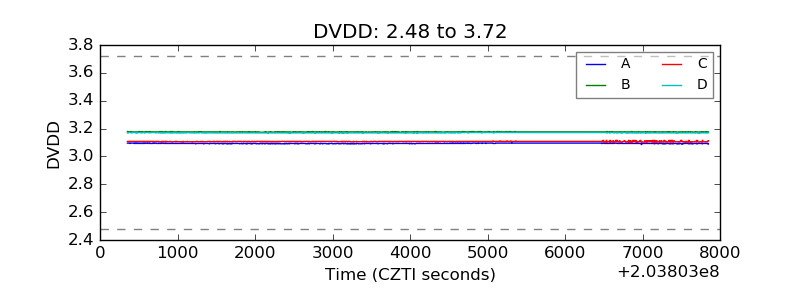 |
| Temperature 1 | 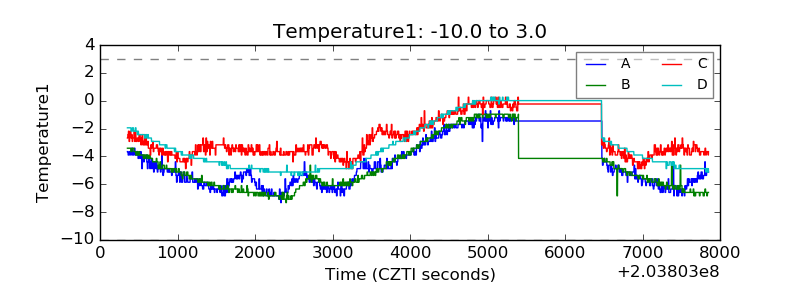 |
| Veto HV Monitor | 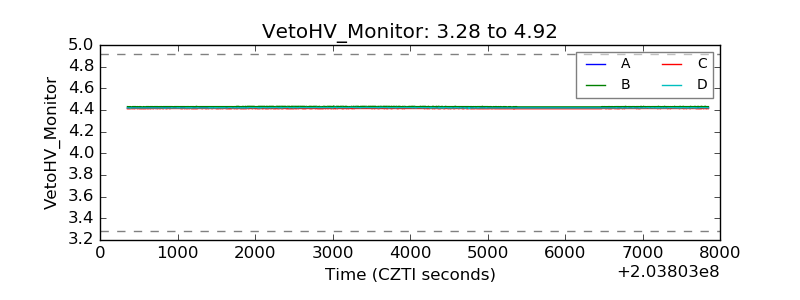 |
| Veto LLD | 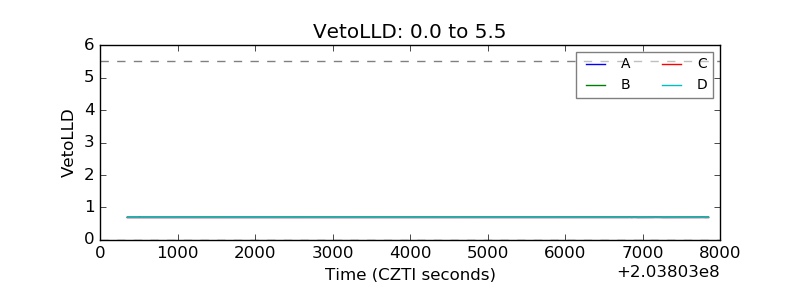 |
| Alpha Counter | 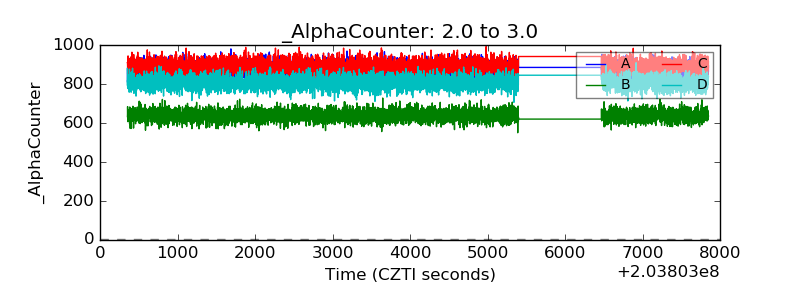 |
| _CPM_Rate | 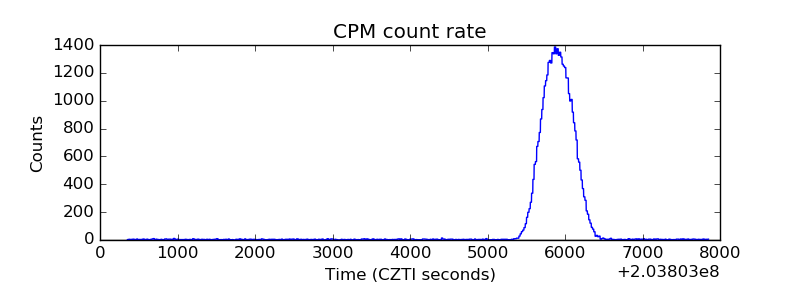 |
| CZT Counter |  |
| +2.5 Volts monitor |  |
| +5 Volts monitor |  |
| Veto Counter | 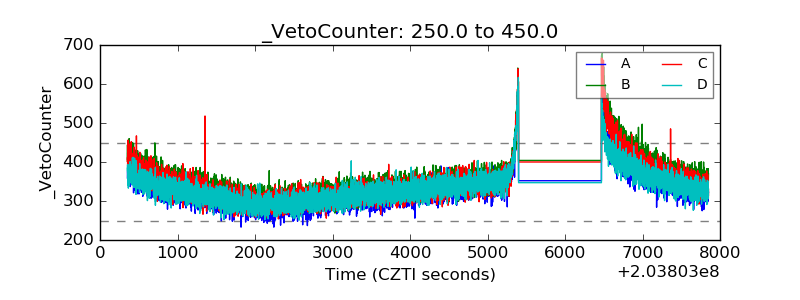 |