| Param | Original file | Final file |
|---|---|---|
| Filename | modeM0/AS1G05_239T02_9000000496_03891cztM0_level2.evt | modeM0/AS1G05_239T02_9000000496_03891cztM0_level2_quad_clean.evt |
| Size (bytes) | 542,543,040 | 62,691,840 |
| Size | 517.4 MB | 59.8 MB |
| Events in quadrant A | 3,840,138 | 365,680 |
| Events in quadrant B | 3,364,512 | 380,925 |
| Events in quadrant C | 5,899,165 | 352,714 |
| Events in quadrant D | 2,898,916 | 357,401 |
| Mode M0 | |||
|---|---|---|---|
| Quadrant | BADHDUFLAG | Total packets | Discarded packets |
| A | 0 | 15425 | 3 |
| B | 0 | 14088 | 2 |
| C | 0 | 21905 | 2 |
| D | 0 | 13230 | 2 |
| Mode M9 | |||
|---|---|---|---|
| Quadrant | BADHDUFLAG | Total packets | Discarded packets |
| A | 0 | 12 | 0 |
| B | 0 | 12 | 0 |
| C | 0 | 12 | 0 |
| D | 0 | 12 | 0 |
| Mode SS | |||
|---|---|---|---|
| Quadrant | BADHDUFLAG | Total packets | Discarded packets |
| A | 0 | 128 | 0 |
| B | 0 | 128 | 0 |
| C | 0 | 128 | 0 |
| D | 0 | 128 | 0 |
| Quadrant | Total seconds | Saturated seconds | Saturation percentage |
|---|---|---|---|
| A | 6321 | 221 | 3.496282% |
| B | 6321 | 84 | 1.328904% |
| C | 6321 | 470 | 7.435532% |
| D | 6321 | 21 | 0.332226% |
Noise dominated data is calculated using 1-second bins in cleaned event files. If a bin has >2000 counts, and if more than 50% of those come from <1% of pixels, then it is considered to be noise-dominated and hence unusable.
| Quadrant | # 1 sec bins | Bins with >0 counts | Bins with >2000 counts | High rate bins dominated by noise | Noise dominated (total time) | Noise dominated (detector-on time) | Marked lightcurve |
|---|---|---|---|---|---|---|---|
| A | 7496 | 6321 | 132 | 132 | 1.76% | 2.09% | 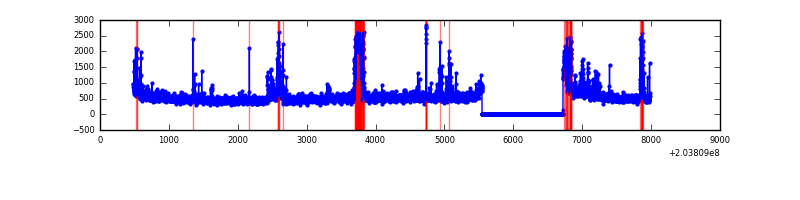 |
| B | 7496 | 6321 | 31 | 31 | 0.41% | 0.49% | 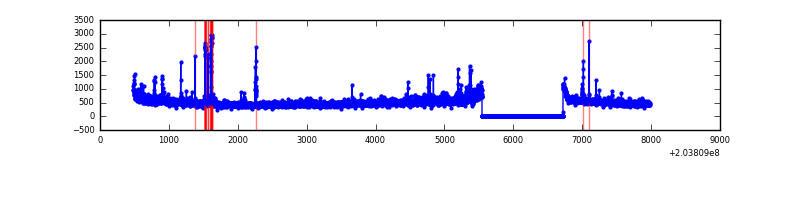 |
| C | 7495 | 6320 | 419 | 419 | 5.59% | 6.63% | 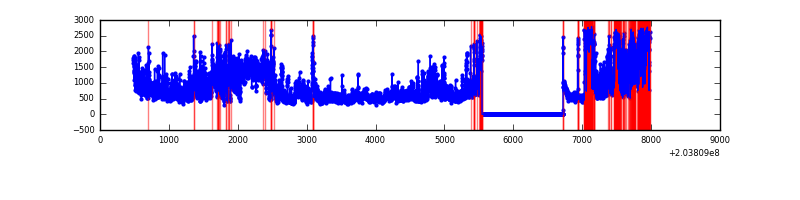 |
| D | 7496 | 6321 | 8 | 8 | 0.11% | 0.13% | 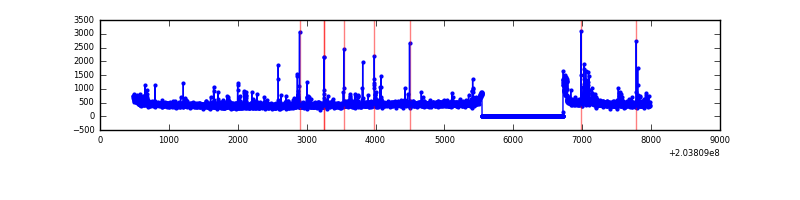 |
Top three noisy pixels from each quadrant. If the there are fewer than three noisy pixels in the level2.evt file, extra rows are filled as -1
| Pixel properties | Quadrant properties | ||||||
|---|---|---|---|---|---|---|---|
| Quadrant | DetID | PixID | Counts | Sigma | Mean | Median | Sigma |
| A | 0 | 118 | 386687 | 2546.91 | 739 | 725 | 151.5 |
| A | 8 | 15 | 316778 | 2085.59 | 739 | 725 | 151.5 |
| A | 0 | 199 | 178038 | 1170.06 | 739 | 725 | 151.5 |
| B | 15 | 204 | 266925 | 1807.88 | 761 | 744 | 147.2 |
| B | 10 | 16 | 93715 | 631.45 | 761 | 744 | 147.2 |
| B | 0 | 183 | 13772 | 88.48 | 761 | 744 | 147.2 |
| C | 2 | 53 | 3117838 | 19099.29 | 699 | 704 | 163.2 |
| C | 8 | 128 | 15220 | 88.94 | 699 | 704 | 163.2 |
| C | 14 | 67 | 12165 | 70.22 | 699 | 704 | 163.2 |
| D | 1 | 20 | 41658 | 234.05 | 716 | 695 | 175.0 |
| D | 13 | 239 | 38011 | 213.21 | 716 | 695 | 175.0 |
| D | 2 | 206 | 24975 | 138.73 | 716 | 695 | 175.0 |
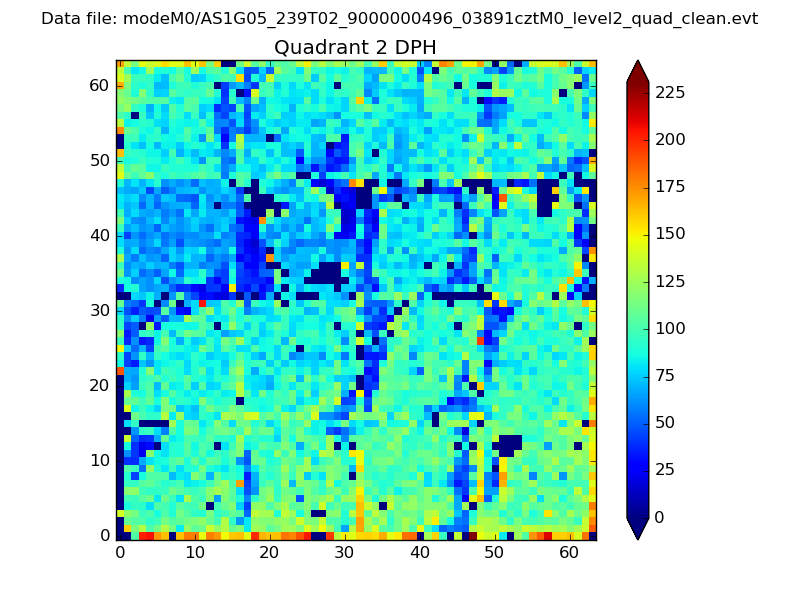
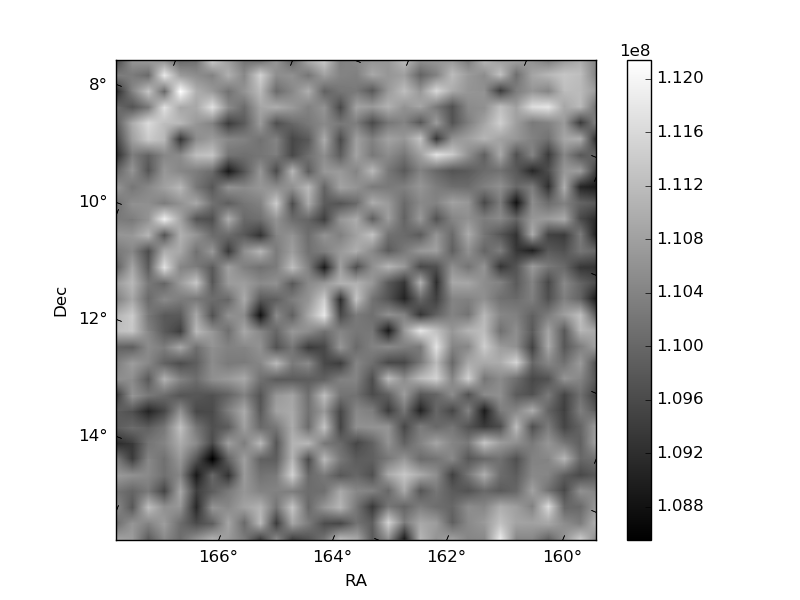
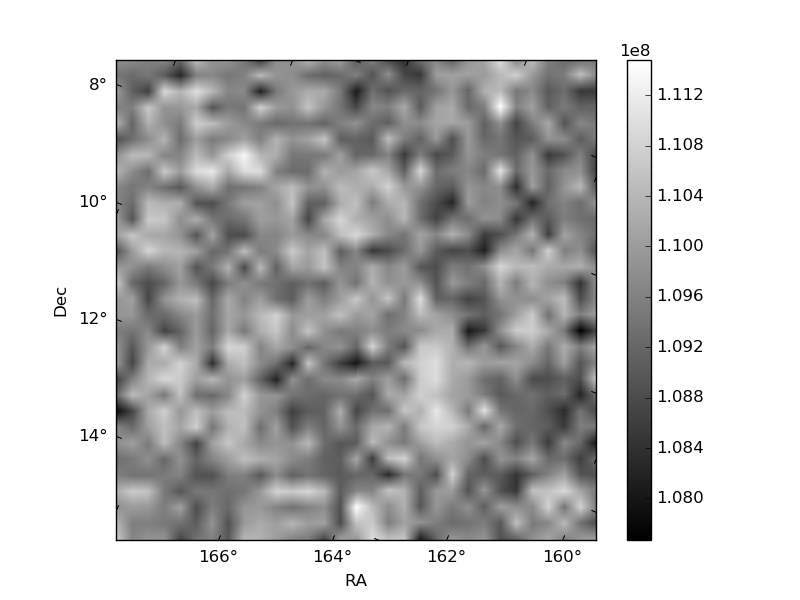
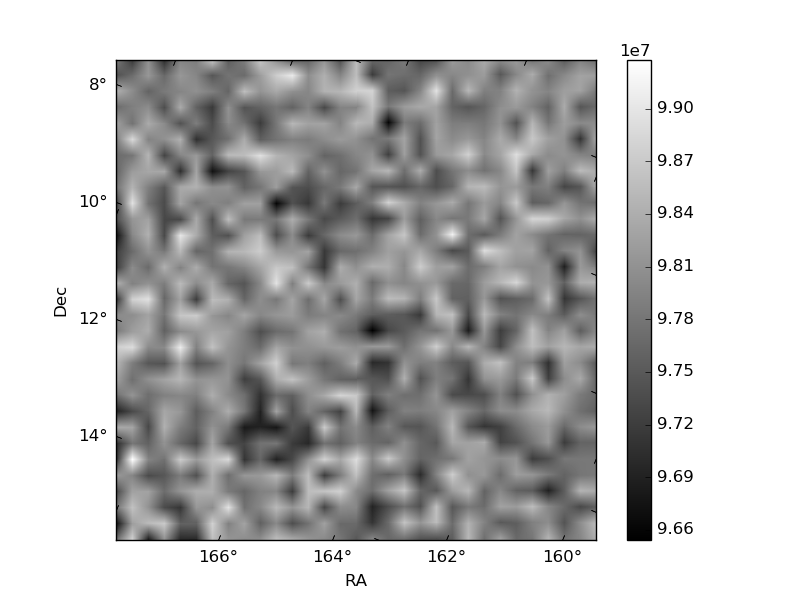
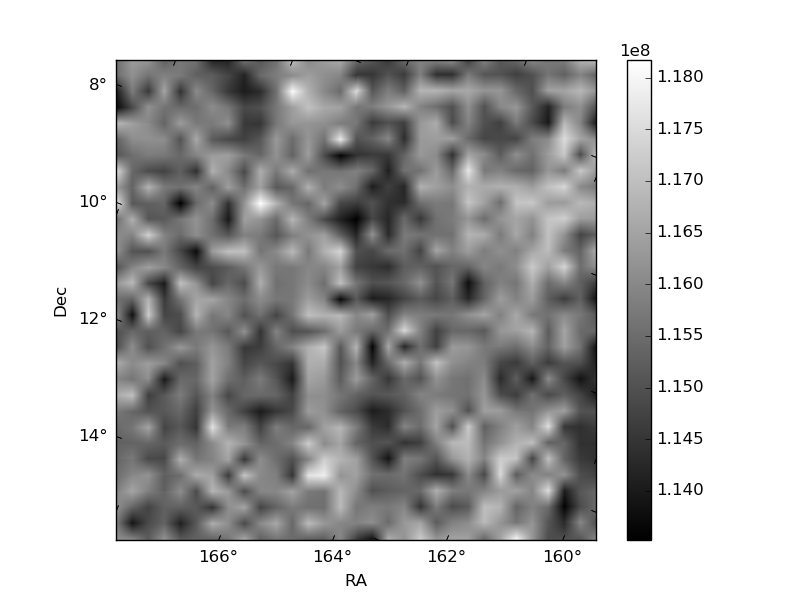
Histogram calculated using DETX and DETY for each event in the final _common_clean file
| Quadrant A | 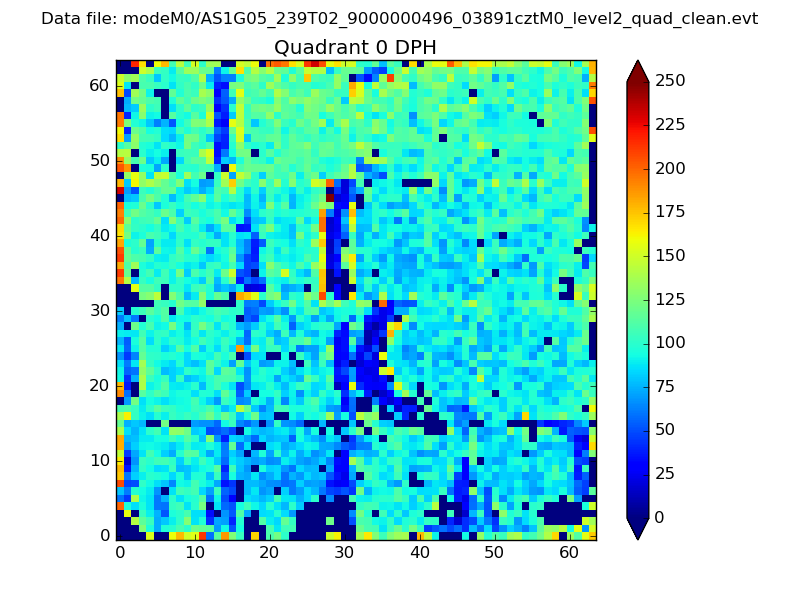 |
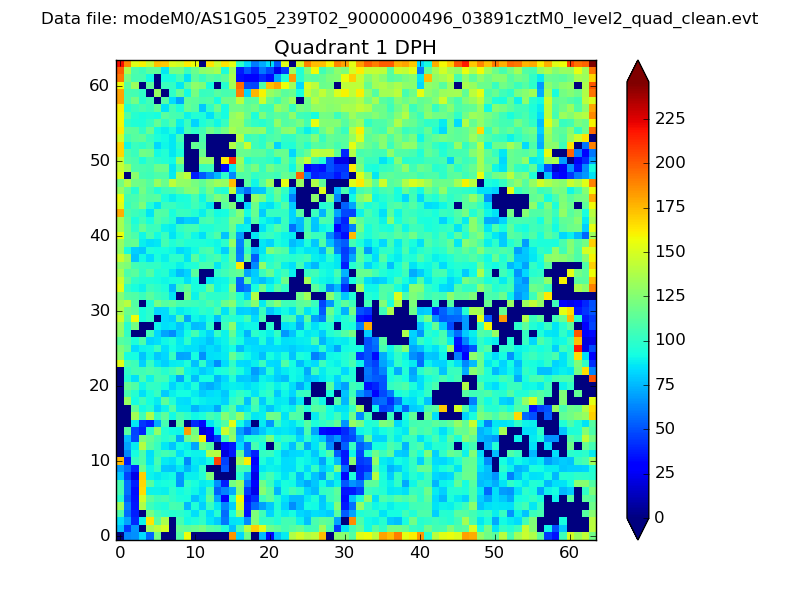 |
Quadrant B |
|---|---|---|---|
| Quadrant D | 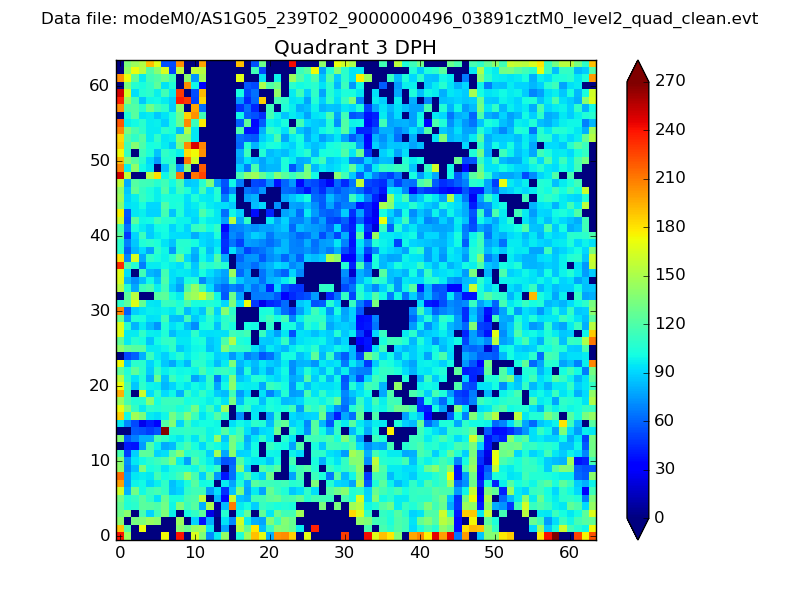 |
 |
Quadrant C |
| Plot type | Count rate plots | Images |
|---|---|---|
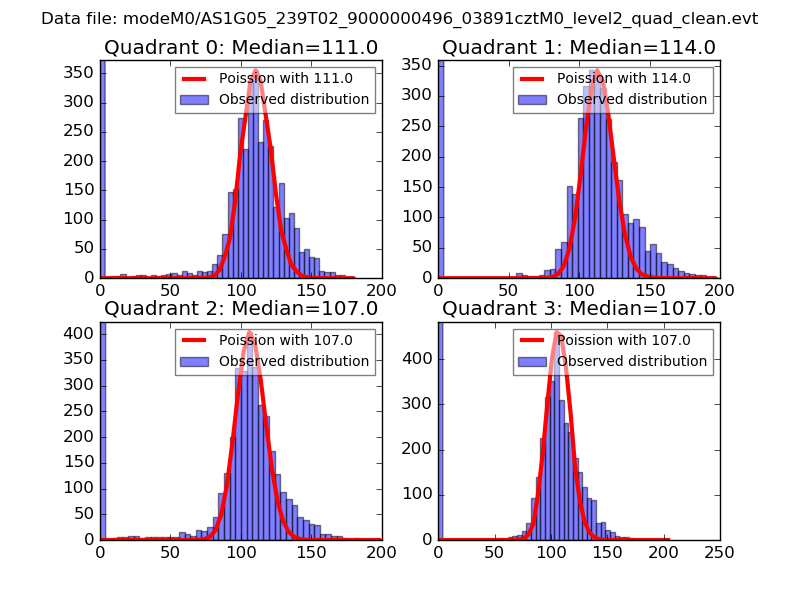
| Comparison with Poisson distribution Blue bars denote a histogram of data divided into 1 sec bins. Red curve is a Poisson curve with rate = median count rate of data. |
 |
 |
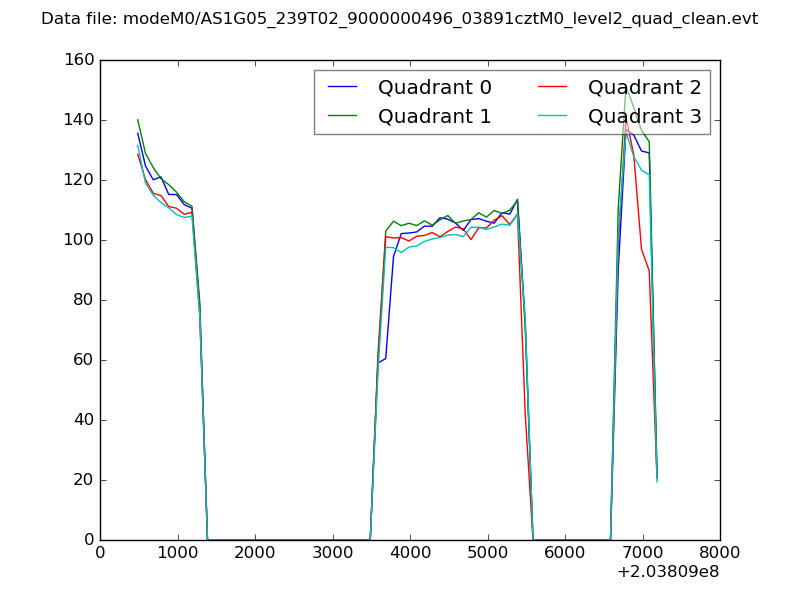
| Quadrant-wise count rates Data is divided into 100 sec bins |
 |
|
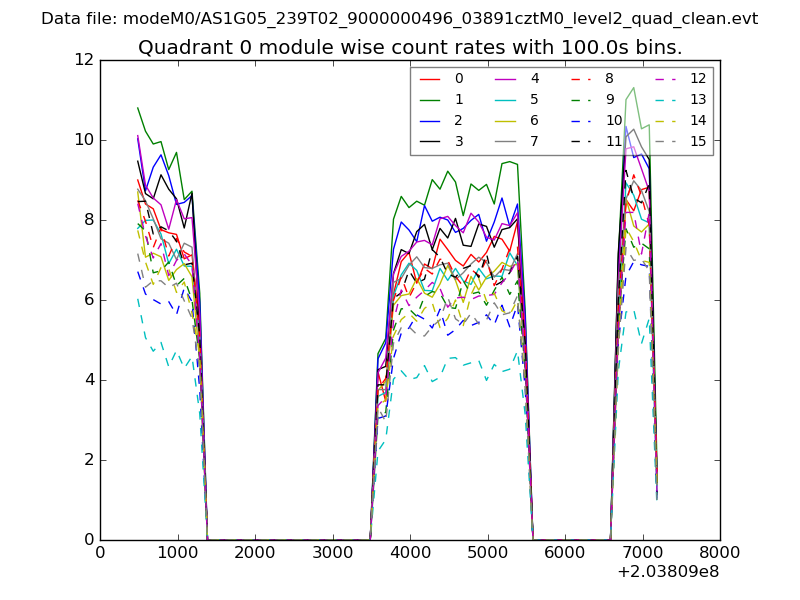
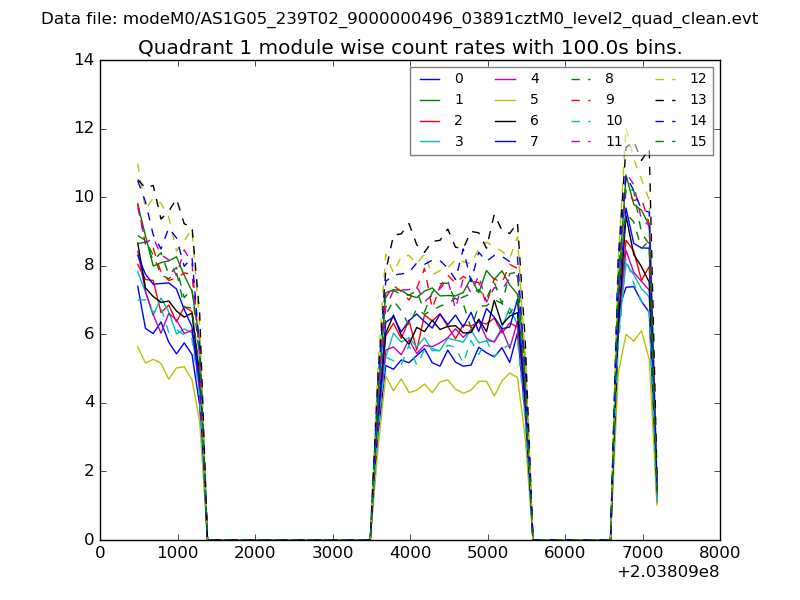
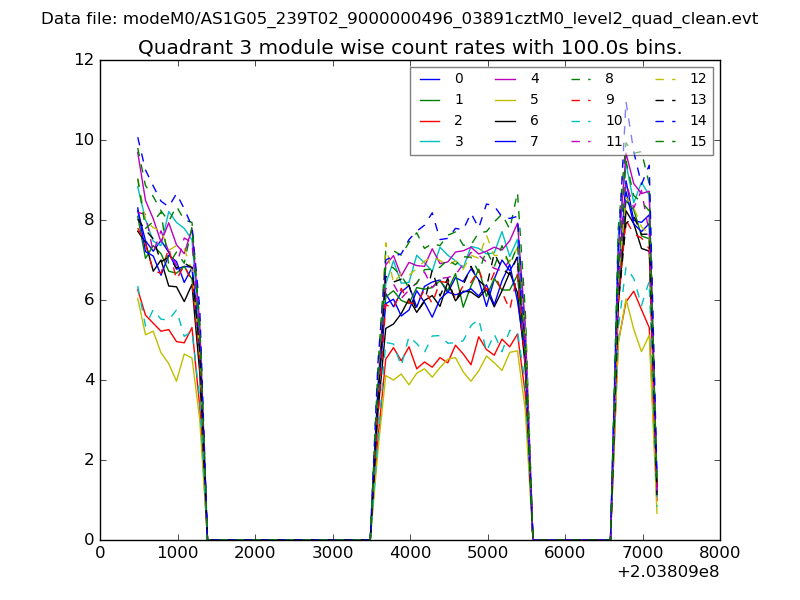
| Module-wise count rates for Quadrant A Data is divided into 100 sec bins |
 |
 |
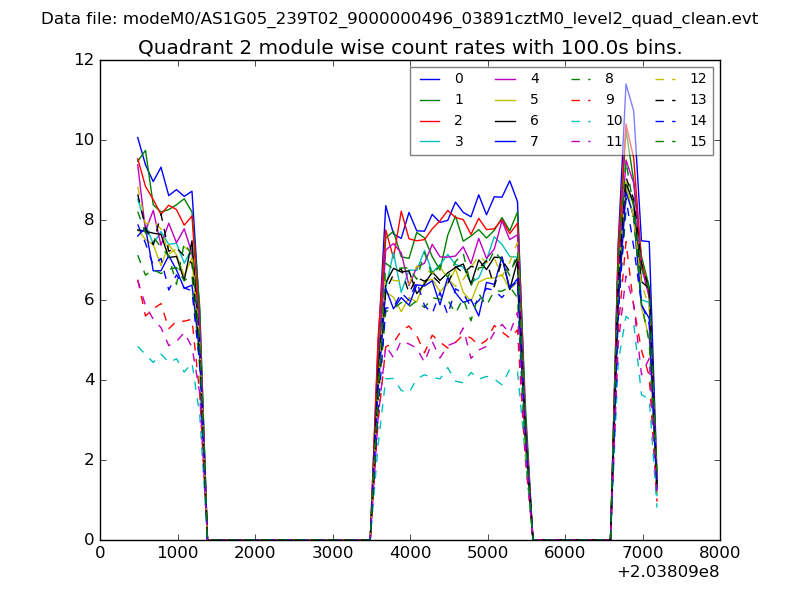
| Module-wise count rates for Quadrant B Data is divided into 100 sec bins |
 |
 |
| Module-wise count rates for Quadrant C Data is divided into 100 sec bins |
 |
 |
| Module-wise count rates for Quadrant D Data is divided into 100 sec bins |
 |
 |
| Parameter | Plot |
|---|---|
| CZT HV Monitor |  |
| D_VDD | 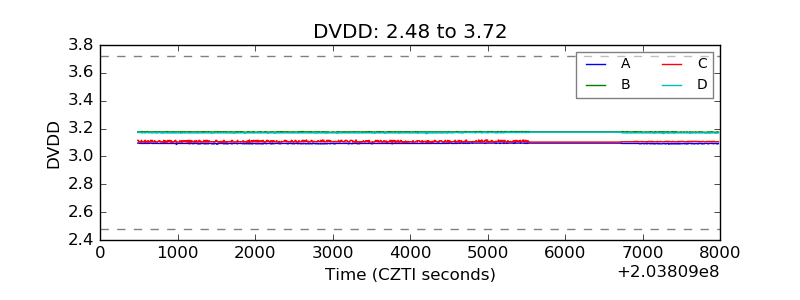 |
| Temperature 1 | 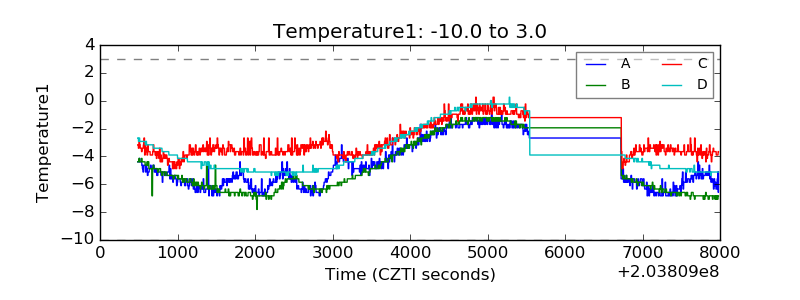 |
| Veto HV Monitor | 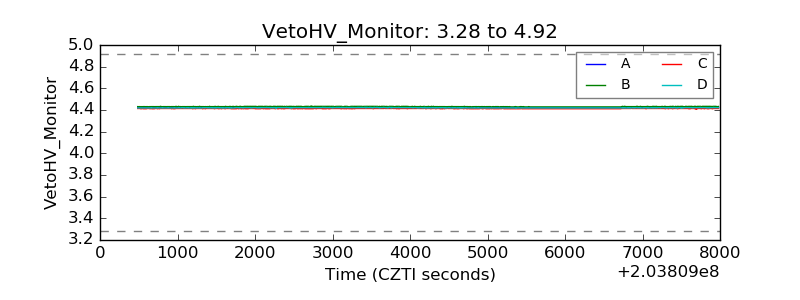 |
| Veto LLD | 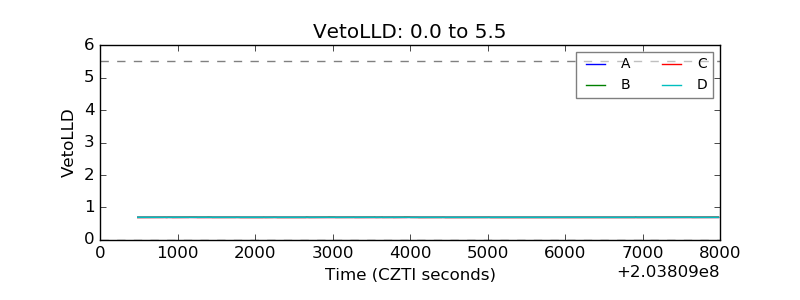 |
| Alpha Counter | 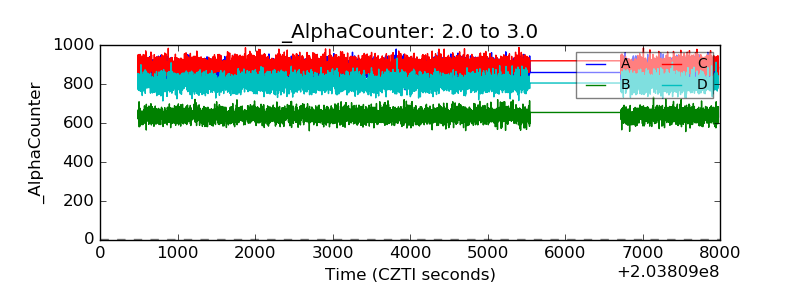 |
| _CPM_Rate | 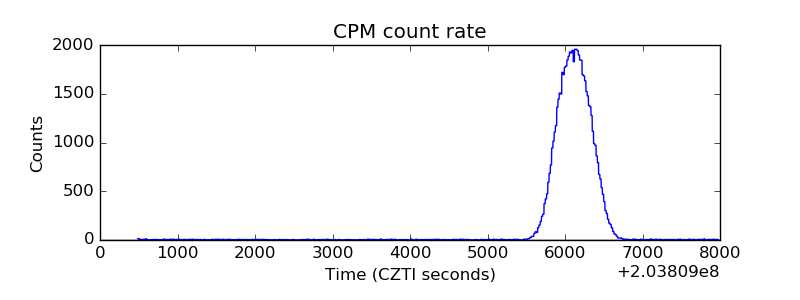 |
| CZT Counter | 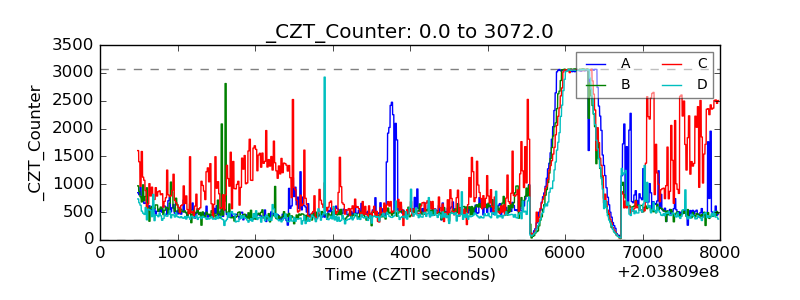 |
| +2.5 Volts monitor |  |
| +5 Volts monitor |  |
| Veto Counter |  |