| Param | Original file | Final file |
|---|---|---|
| Filename | modeM0/AS1G05_239T02_9000000496_03892cztM0_level2.evt | modeM0/AS1G05_239T02_9000000496_03892cztM0_level2_quad_clean.evt |
| Size (bytes) | 744,166,080 | 52,614,720 |
| Size | 709.7 MB | 50.2 MB |
| Events in quadrant A | 5,241,350 | 305,844 |
| Events in quadrant B | 3,406,969 | 333,131 |
| Events in quadrant C | 10,113,511 | 187,508 |
| Events in quadrant D | 3,331,493 | 307,285 |
| Mode M0 | |||
|---|---|---|---|
| Quadrant | BADHDUFLAG | Total packets | Discarded packets |
| A | 0 | 19982 | 3 |
| B | 0 | 14164 | 2 |
| C | 0 | 34378 | 2 |
| D | 0 | 14405 | 2 |
| Mode M9 | |||
|---|---|---|---|
| Quadrant | BADHDUFLAG | Total packets | Discarded packets |
| A | 0 | 23 | 0 |
| B | 0 | 23 | 0 |
| C | 0 | 23 | 0 |
| D | 0 | 24 | 0 |
| Mode SS | |||
|---|---|---|---|
| Quadrant | BADHDUFLAG | Total packets | Discarded packets |
| A | 0 | 132 | 0 |
| B | 0 | 132 | 0 |
| C | 0 | 132 | 0 |
| D | 0 | 132 | 0 |
| Quadrant | Total seconds | Saturated seconds | Saturation percentage |
|---|---|---|---|
| A | 6568 | 433 | 6.592570% |
| B | 6568 | 78 | 1.187576% |
| C | 6568 | 2892 | 44.031669% |
| D | 6568 | 61 | 0.928745% |
Noise dominated data is calculated using 1-second bins in cleaned event files. If a bin has >2000 counts, and if more than 50% of those come from <1% of pixels, then it is considered to be noise-dominated and hence unusable.
| Quadrant | # 1 sec bins | Bins with >0 counts | Bins with >2000 counts | High rate bins dominated by noise | Noise dominated (total time) | Noise dominated (detector-on time) | Marked lightcurve |
|---|---|---|---|---|---|---|---|
| A | 7828 | 6568 | 278 | 278 | 3.55% | 4.23% | 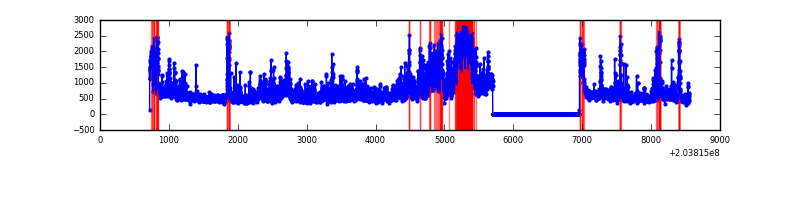 |
| B | 7828 | 6568 | 3 | 3 | 0.04% | 0.05% | 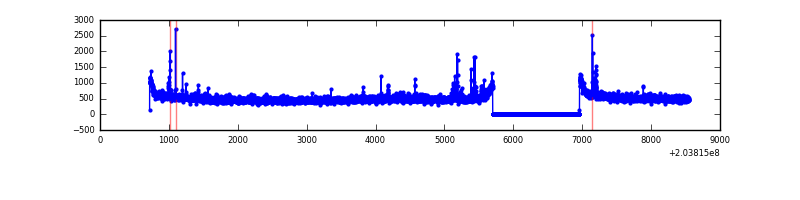 |
| C | 7827 | 6567 | 2739 | 2739 | 34.99% | 41.71% | 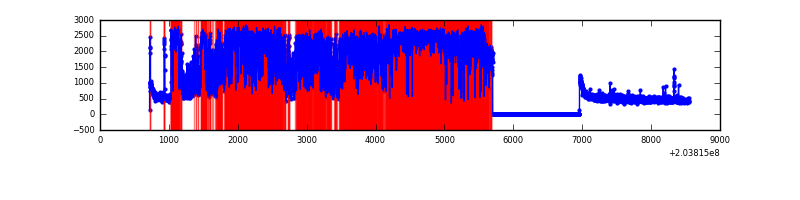 |
| D | 7828 | 6568 | 31 | 31 | 0.40% | 0.47% | 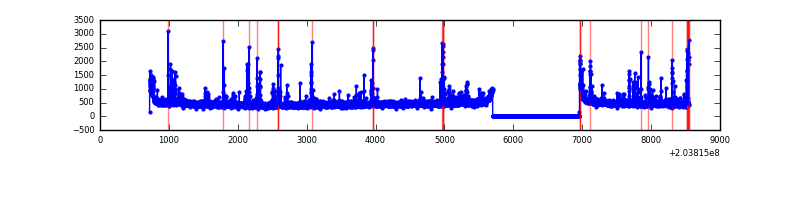 |
Top three noisy pixels from each quadrant. If the there are fewer than three noisy pixels in the level2.evt file, extra rows are filled as -1
| Pixel properties | Quadrant properties | ||||||
|---|---|---|---|---|---|---|---|
| Quadrant | DetID | PixID | Counts | Sigma | Mean | Median | Sigma |
| A | 8 | 15 | 1245270 | 7690.72 | 797 | 782 | 161.8 |
| A | 13 | 251 | 498837 | 3077.89 | 797 | 782 | 161.8 |
| A | 0 | 199 | 213821 | 1316.54 | 797 | 782 | 161.8 |
| B | 15 | 204 | 105236 | 659.51 | 831 | 813 | 158.3 |
| B | 4 | 81 | 43211 | 267.78 | 831 | 813 | 158.3 |
| B | 7 | 221 | 33795 | 208.31 | 831 | 813 | 158.3 |
| C | 2 | 53 | 7665105 | 52784.57 | 624 | 627 | 145.2 |
| C | 13 | 61 | 5292 | 32.13 | 624 | 627 | 145.2 |
| C | 10 | 65 | 5196 | 31.47 | 624 | 627 | 145.2 |
| D | 13 | 239 | 100747 | 530.79 | 774 | 752 | 188.4 |
| D | 13 | 223 | 73317 | 385.19 | 774 | 752 | 188.4 |
| D | 1 | 20 | 61747 | 323.77 | 774 | 752 | 188.4 |
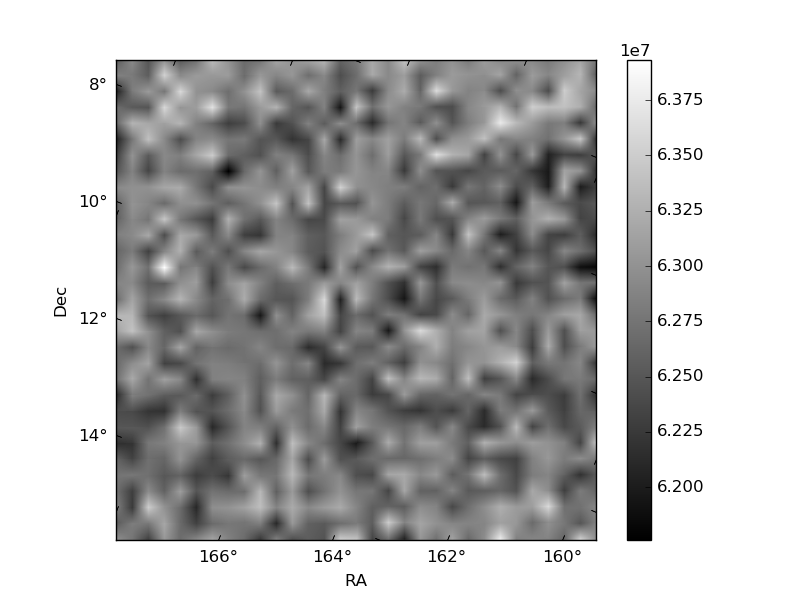
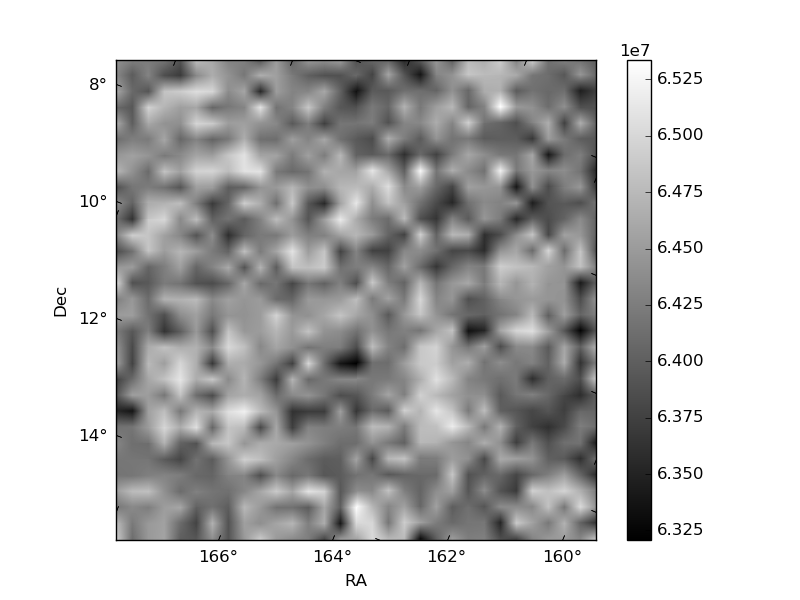
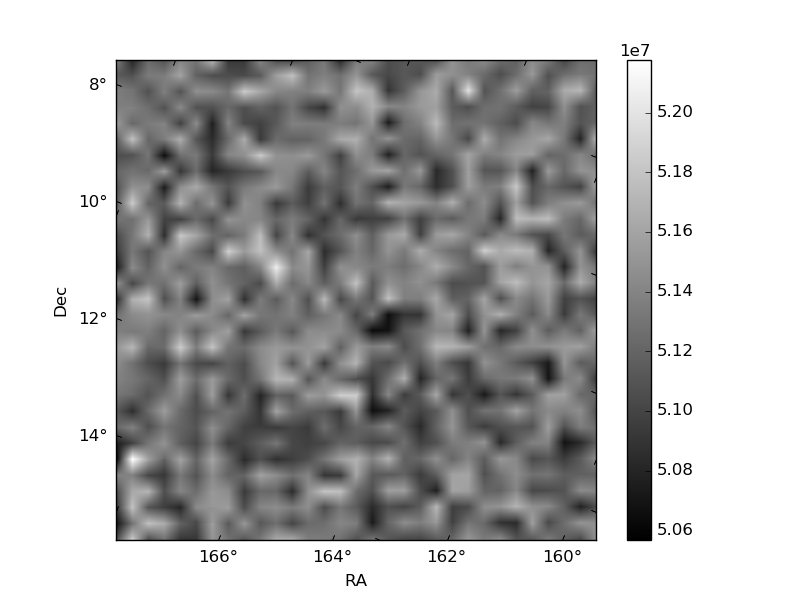
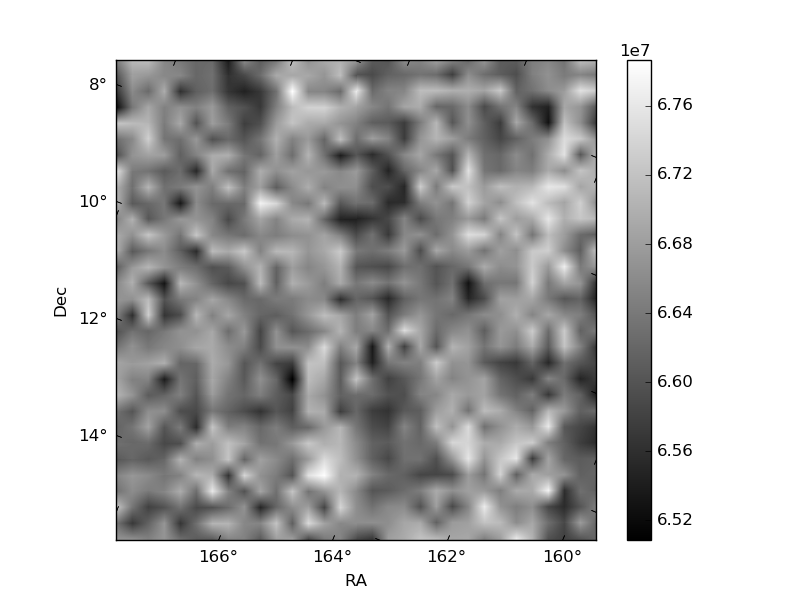
Histogram calculated using DETX and DETY for each event in the final _common_clean file
| Quadrant A | 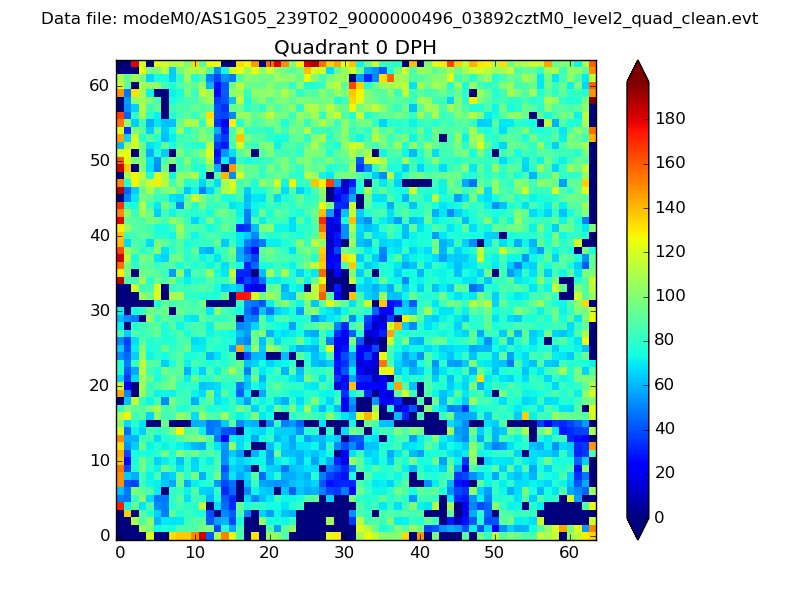 |
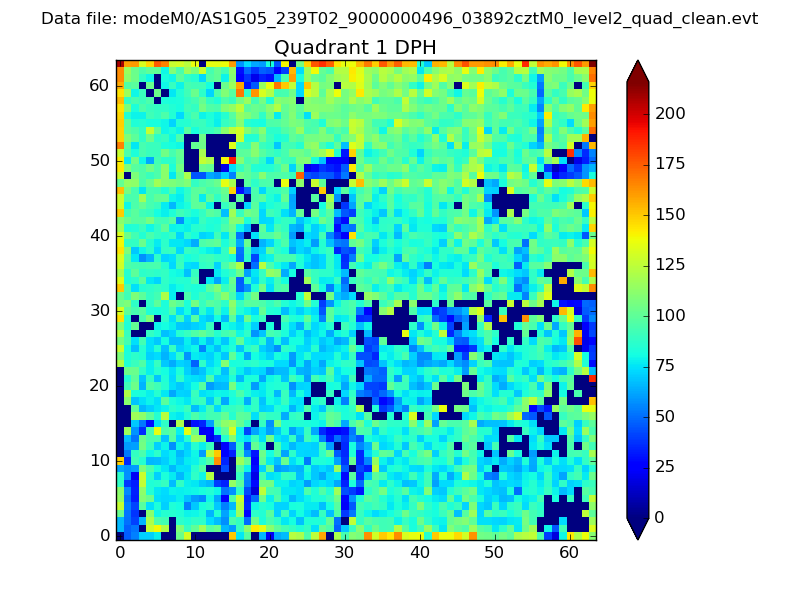 |
Quadrant B |
|---|---|---|---|
| Quadrant D | 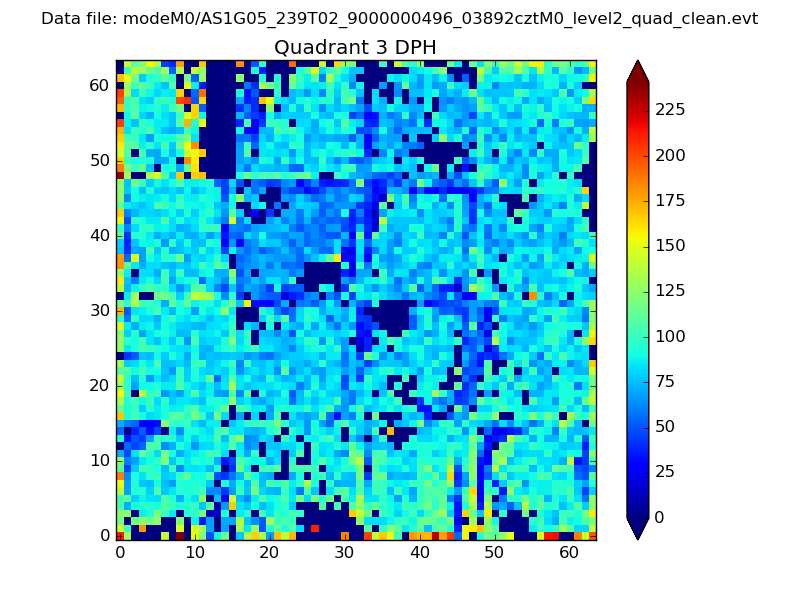 |
 |
Quadrant C |
| Plot type | Count rate plots | Images |
|---|---|---|
| Comparison with Poisson distribution Blue bars denote a histogram of data divided into 1 sec bins. Red curve is a Poisson curve with rate = median count rate of data. |
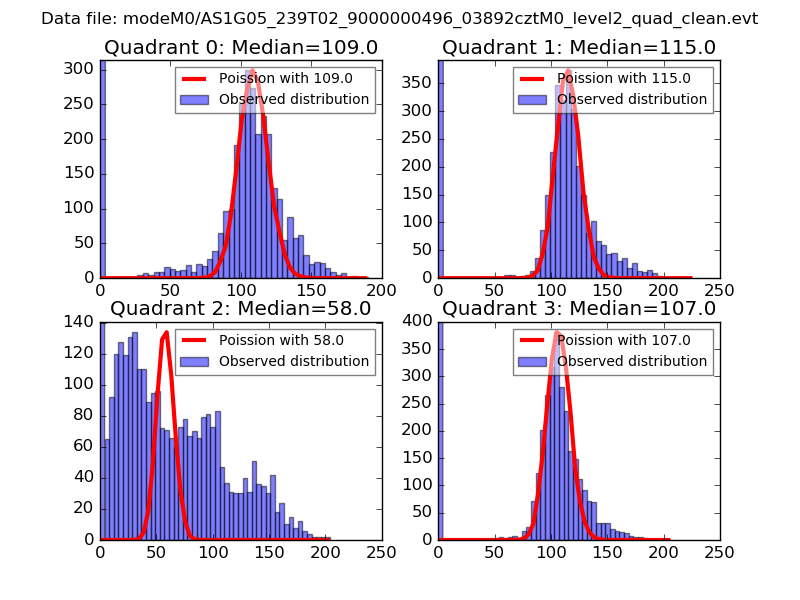 |
 |
| Quadrant-wise count rates Data is divided into 100 sec bins |
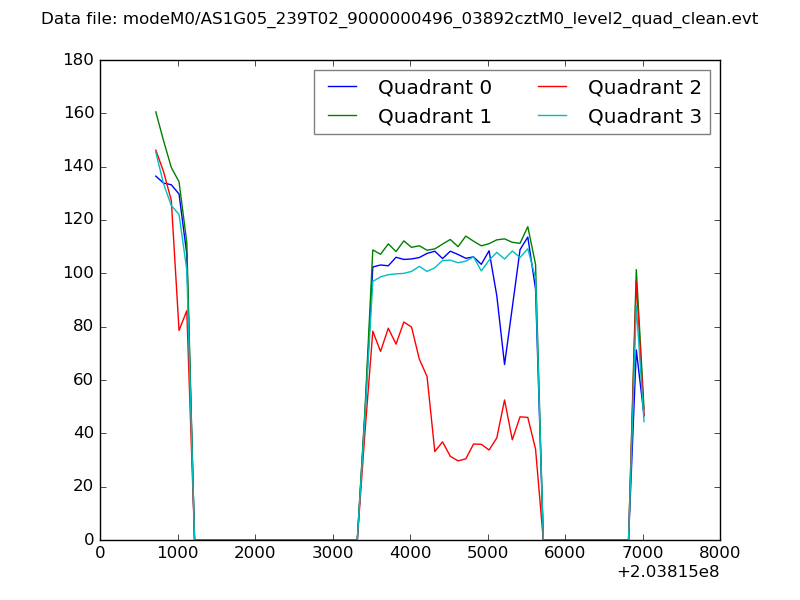 |
|
| Module-wise count rates for Quadrant A Data is divided into 100 sec bins |
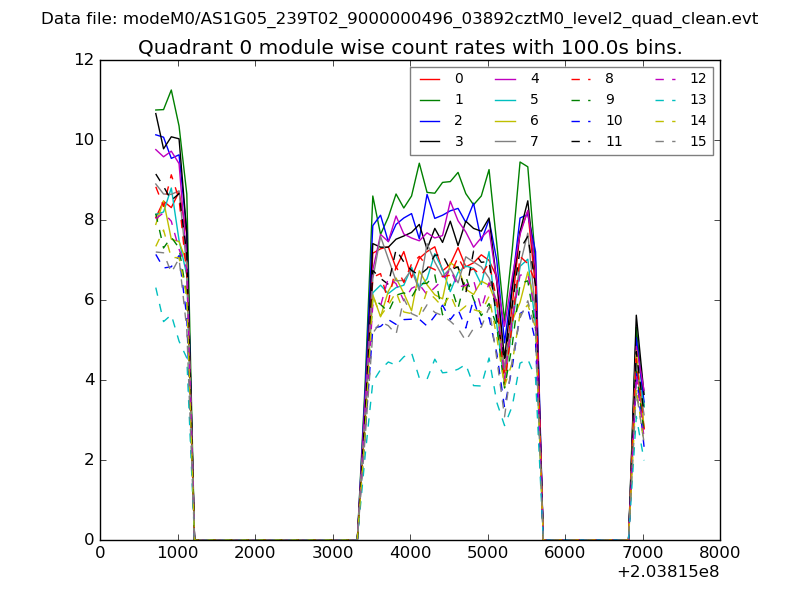 |
 |
| Module-wise count rates for Quadrant B Data is divided into 100 sec bins |
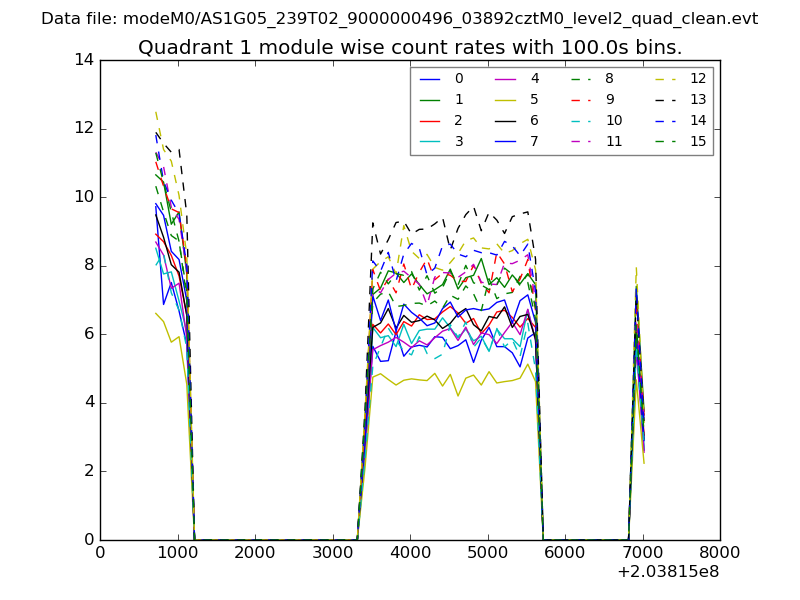 |
 |
| Module-wise count rates for Quadrant C Data is divided into 100 sec bins |
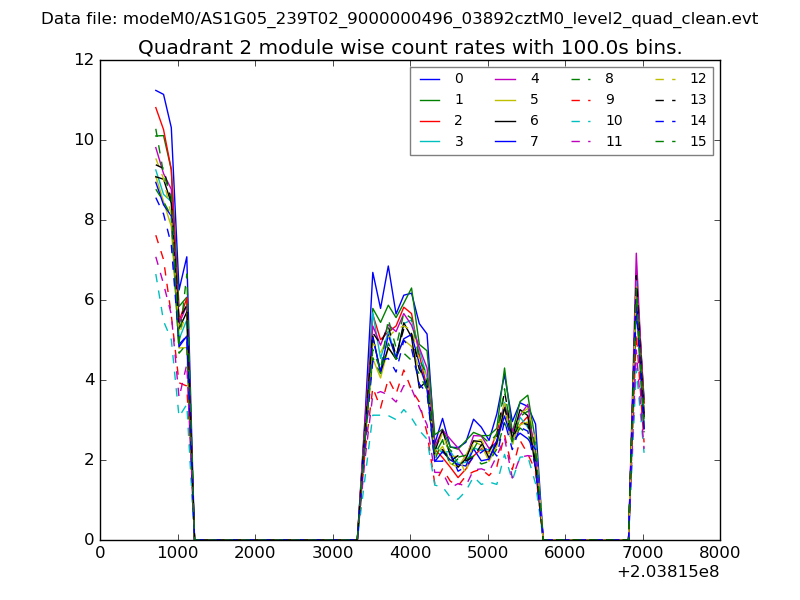 |
 |
| Module-wise count rates for Quadrant D Data is divided into 100 sec bins |
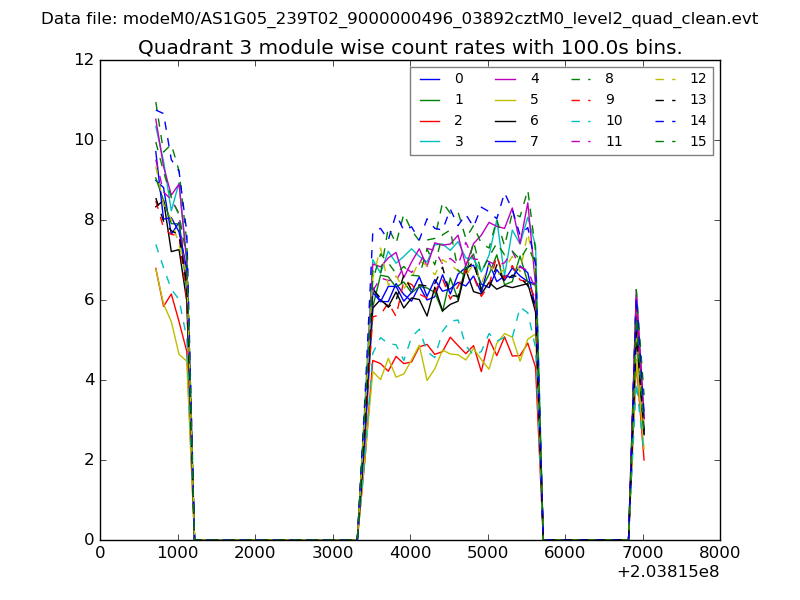 |
 |
| Parameter | Plot |
|---|---|
| CZT HV Monitor | 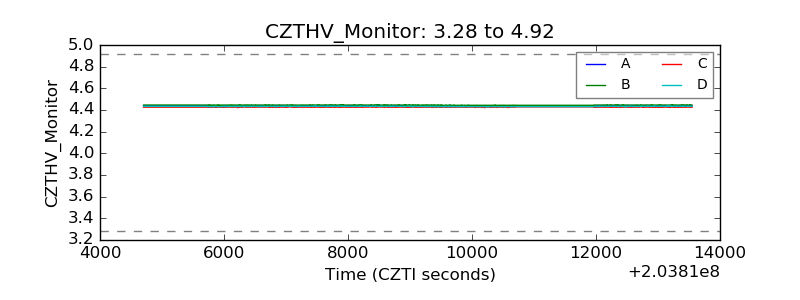 |
| D_VDD |  |
| Temperature 1 | 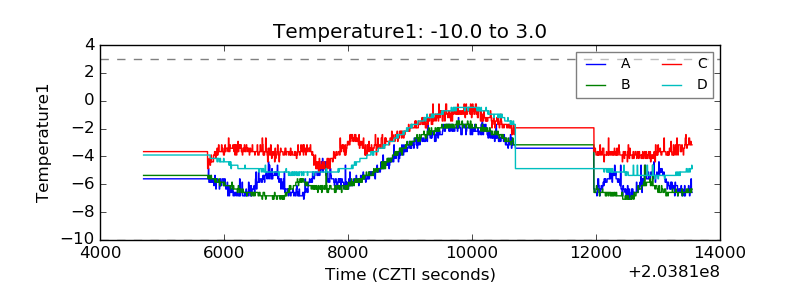 |
| Veto HV Monitor | 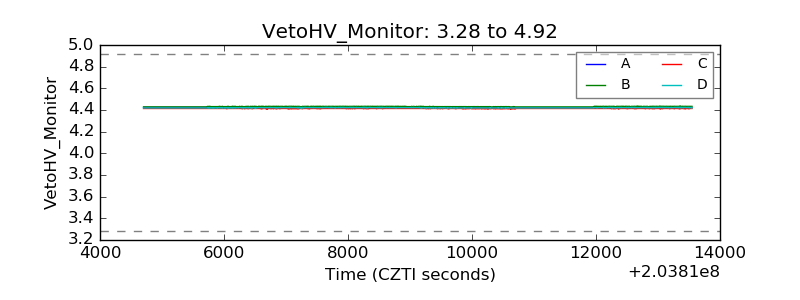 |
| Veto LLD | 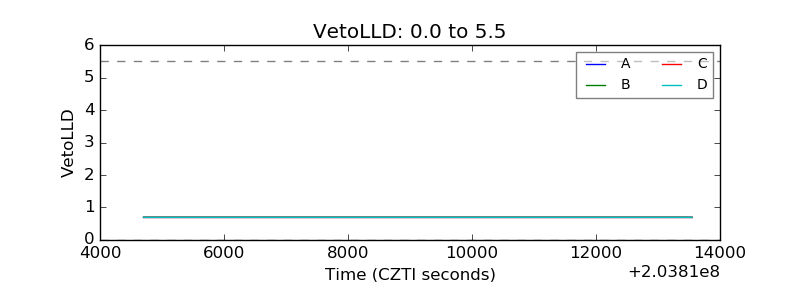 |
| Alpha Counter | 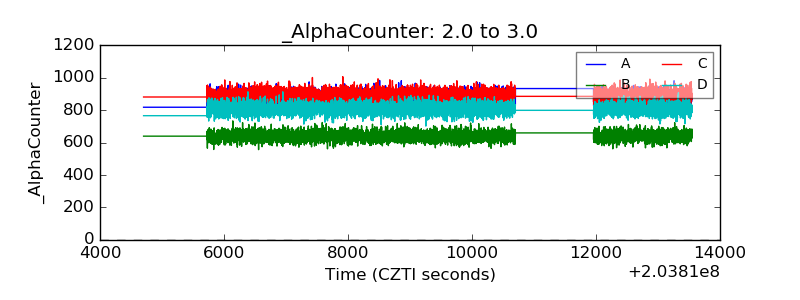 |
| _CPM_Rate | 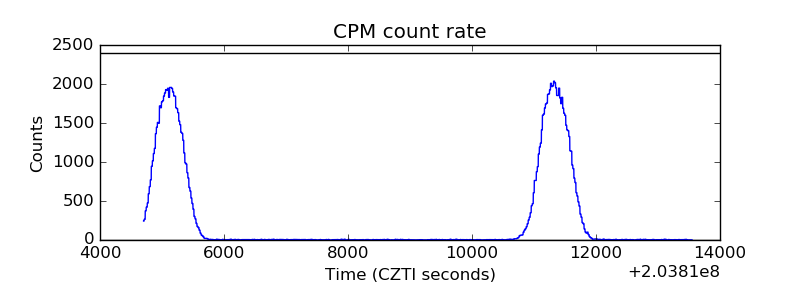 |
| CZT Counter |  |
| +2.5 Volts monitor |  |
| +5 Volts monitor |  |
| Veto Counter | 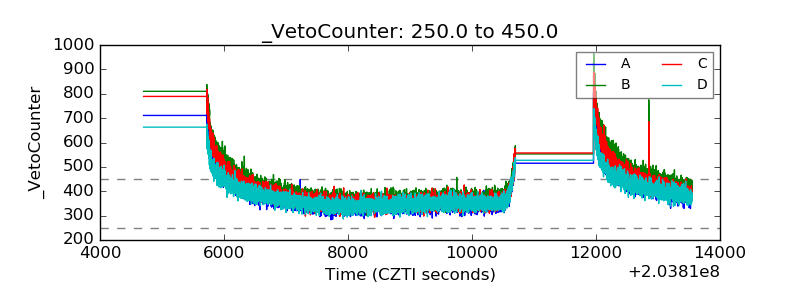 |