| Param | Original file | Final file |
|---|---|---|
| Filename | modeM0/AS1G05_239T02_9000000496_03893cztM0_level2.evt | modeM0/AS1G05_239T02_9000000496_03893cztM0_level2_quad_clean.evt |
| Size (bytes) | 529,971,840 | 54,383,040 |
| Size | 505.4 MB | 51.9 MB |
| Events in quadrant A | 4,333,331 | 300,292 |
| Events in quadrant B | 4,017,269 | 307,145 |
| Events in quadrant C | 3,510,270 | 300,158 |
| Events in quadrant D | 3,747,625 | 284,077 |
| Mode M0 | |||
|---|---|---|---|
| Quadrant | BADHDUFLAG | Total packets | Discarded packets |
| A | 0 | 17086 | 3 |
| B | 0 | 16156 | 2 |
| C | 0 | 14630 | 2 |
| D | 0 | 15425 | 2 |
| Mode M9 | |||
|---|---|---|---|
| Quadrant | BADHDUFLAG | Total packets | Discarded packets |
| A | 0 | 24 | 0 |
| B | 0 | 24 | 0 |
| C | 0 | 24 | 0 |
| D | 0 | 25 | 0 |
| Mode SS | |||
|---|---|---|---|
| Quadrant | BADHDUFLAG | Total packets | Discarded packets |
| A | 0 | 132 | 0 |
| B | 0 | 132 | 0 |
| C | 0 | 132 | 0 |
| D | 0 | 132 | 0 |
| Quadrant | Total seconds | Saturated seconds | Saturation percentage |
|---|---|---|---|
| A | 6518 | 264 | 4.050322% |
| B | 6518 | 109 | 1.672292% |
| C | 6518 | 109 | 1.672292% |
| D | 6518 | 191 | 2.930347% |
Noise dominated data is calculated using 1-second bins in cleaned event files. If a bin has >2000 counts, and if more than 50% of those come from <1% of pixels, then it is considered to be noise-dominated and hence unusable.
| Quadrant | # 1 sec bins | Bins with >0 counts | Bins with >2000 counts | High rate bins dominated by noise | Noise dominated (total time) | Noise dominated (detector-on time) | Marked lightcurve |
|---|---|---|---|---|---|---|---|
| A | 7843 | 6518 | 150 | 150 | 1.91% | 2.30% | 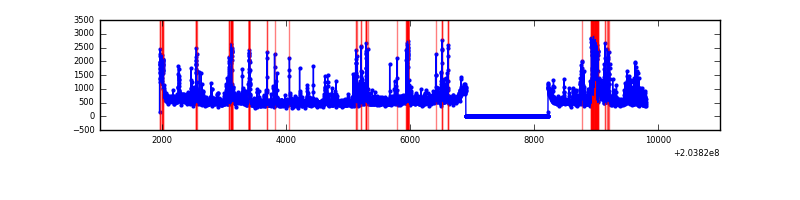 |
| B | 7843 | 6518 | 9 | 9 | 0.11% | 0.14% | 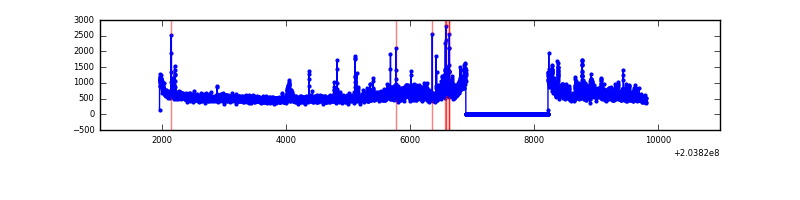 |
| C | 7843 | 6518 | 57 | 57 | 0.73% | 0.87% | 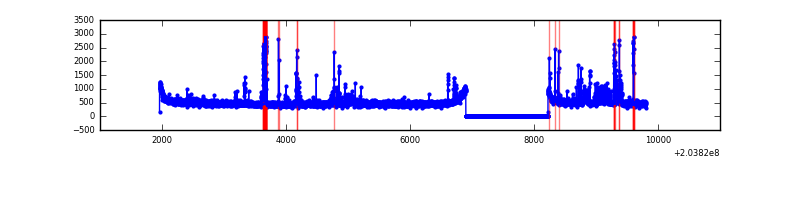 |
| D | 7843 | 6518 | 145 | 145 | 1.85% | 2.22% | 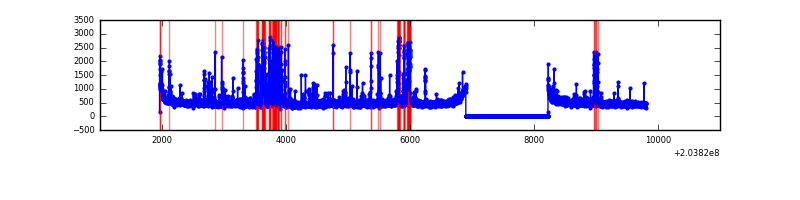 |
Top three noisy pixels from each quadrant. If the there are fewer than three noisy pixels in the level2.evt file, extra rows are filled as -1
| Pixel properties | Quadrant properties | ||||||
|---|---|---|---|---|---|---|---|
| Quadrant | DetID | PixID | Counts | Sigma | Mean | Median | Sigma |
| A | 13 | 251 | 690970 | 4155.78 | 821 | 807 | 166.1 |
| A | 8 | 15 | 250207 | 1501.75 | 821 | 807 | 166.1 |
| A | 0 | 118 | 110649 | 661.41 | 821 | 807 | 166.1 |
| B | 7 | 221 | 427622 | 2675.6 | 841 | 822 | 159.5 |
| B | 15 | 204 | 303664 | 1898.51 | 841 | 822 | 159.5 |
| B | 4 | 81 | 13906 | 82.02 | 841 | 822 | 159.5 |
| C | 2 | 53 | 190663 | 1030.88 | 790 | 795 | 184.2 |
| C | 7 | 222 | 130829 | 706.01 | 790 | 795 | 184.2 |
| C | 10 | 65 | 78763 | 423.32 | 790 | 795 | 184.2 |
| D | 13 | 239 | 352324 | 1895.98 | 779 | 759 | 185.4 |
| D | 1 | 20 | 171090 | 918.59 | 779 | 759 | 185.4 |
| D | 2 | 63 | 59483 | 316.7 | 779 | 759 | 185.4 |
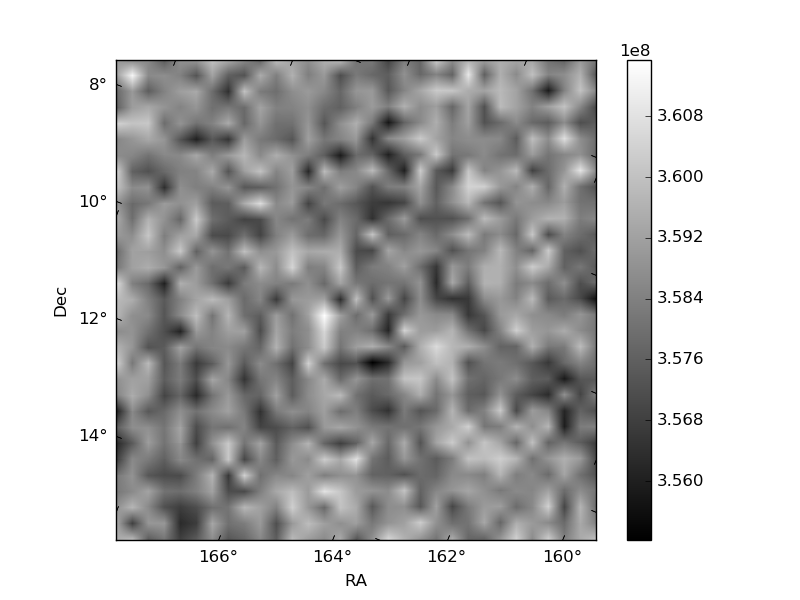
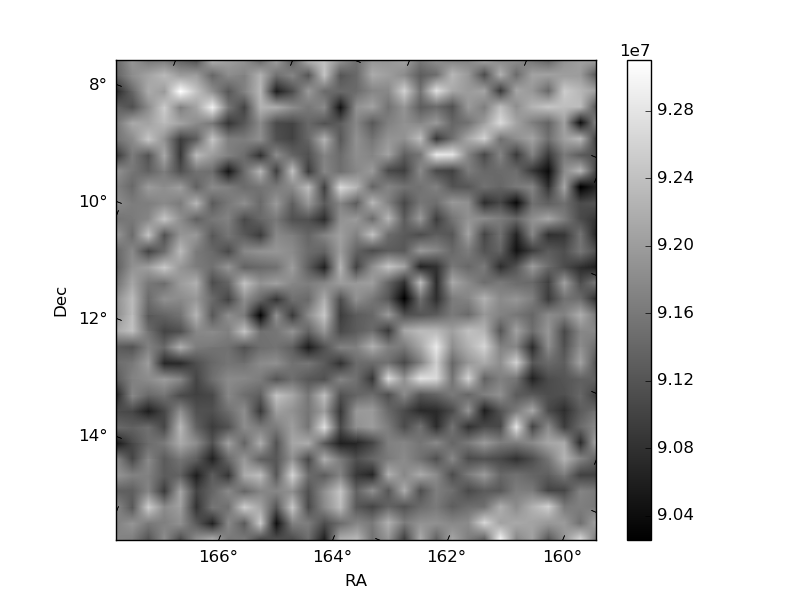
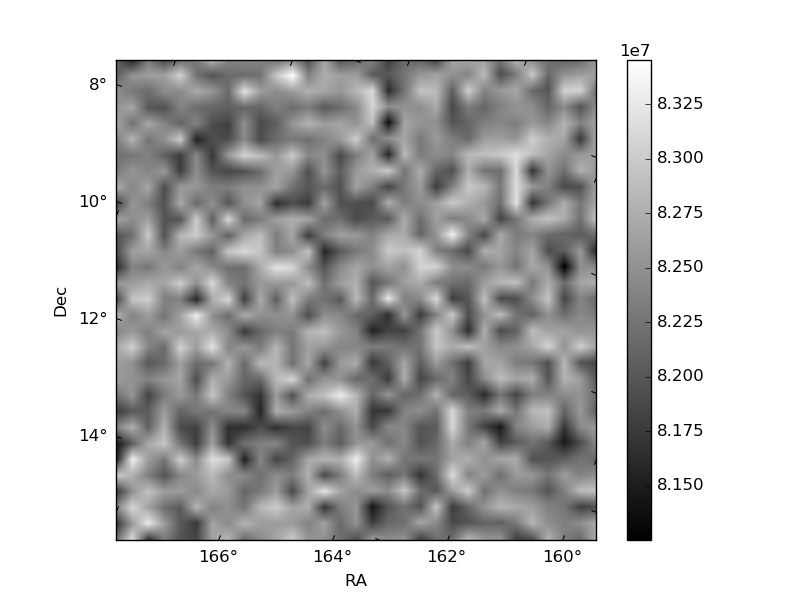
Histogram calculated using DETX and DETY for each event in the final _common_clean file
| Quadrant A | 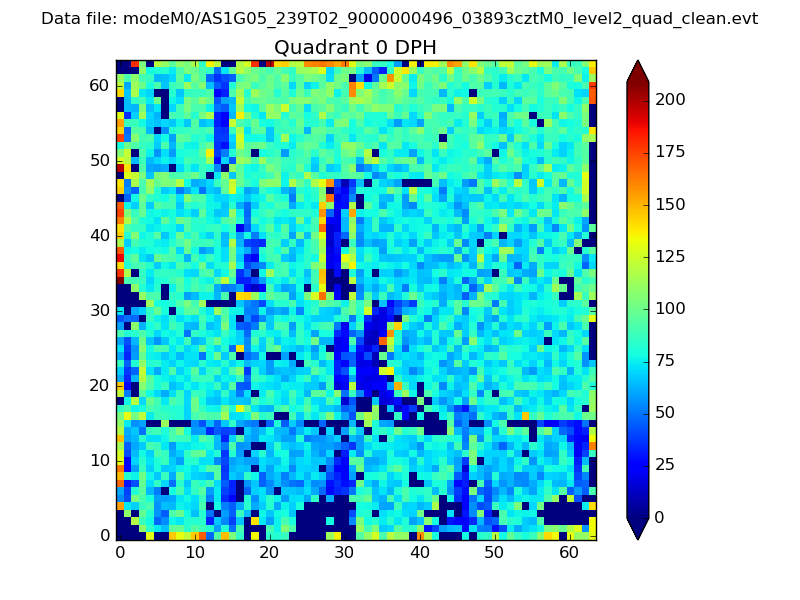 |
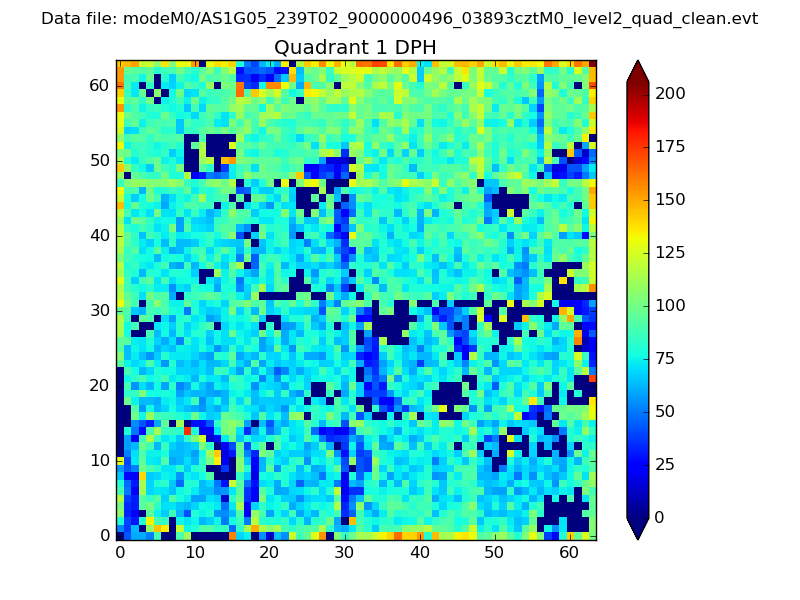 |
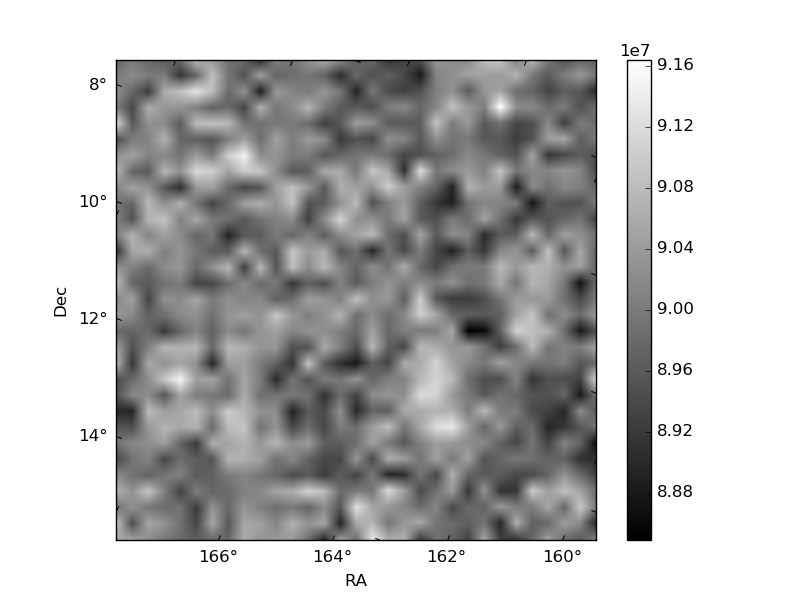
Quadrant B |
|---|---|---|---|
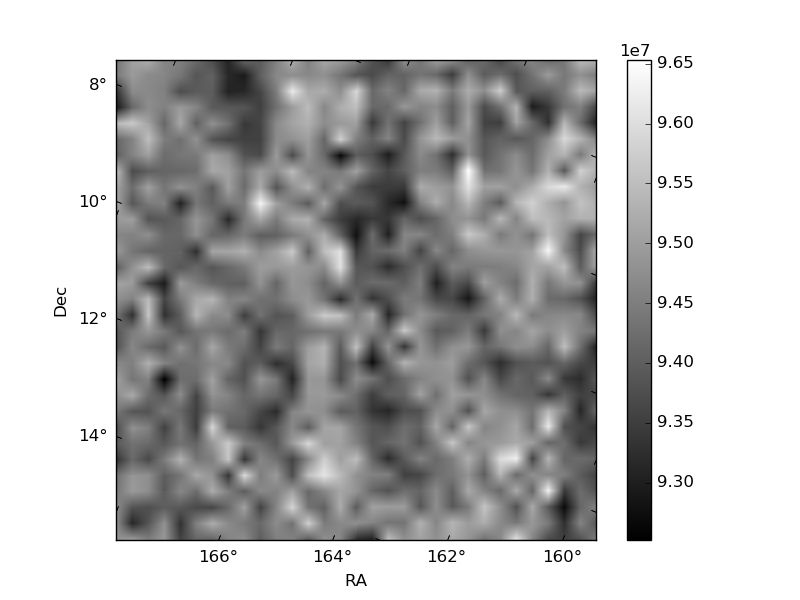
| Quadrant D | 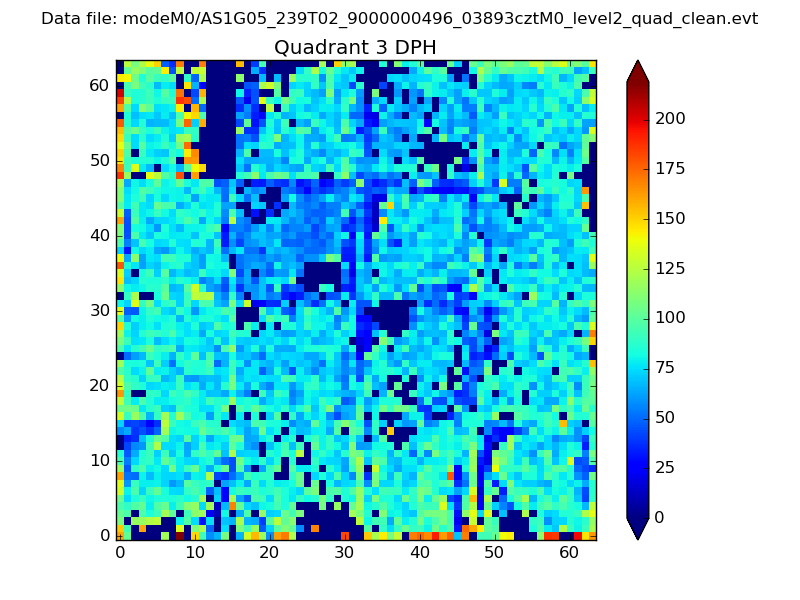 |
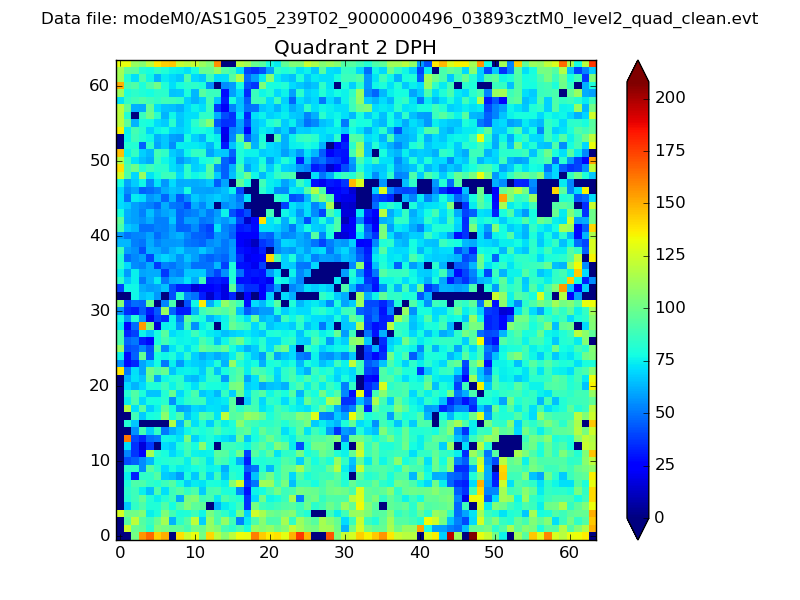 |
Quadrant C |
| Plot type | Count rate plots | Images |
|---|---|---|
| Comparison with Poisson distribution Blue bars denote a histogram of data divided into 1 sec bins. Red curve is a Poisson curve with rate = median count rate of data. |
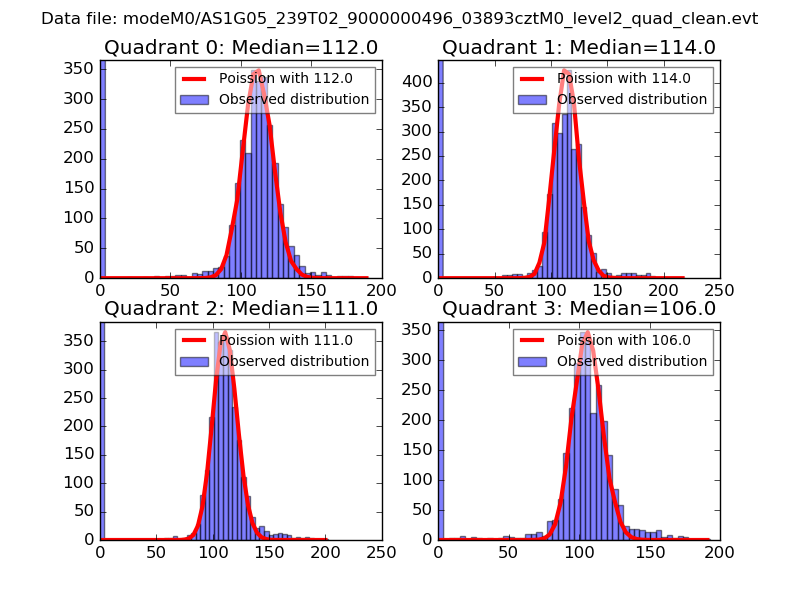 |
 |
| Quadrant-wise count rates Data is divided into 100 sec bins |
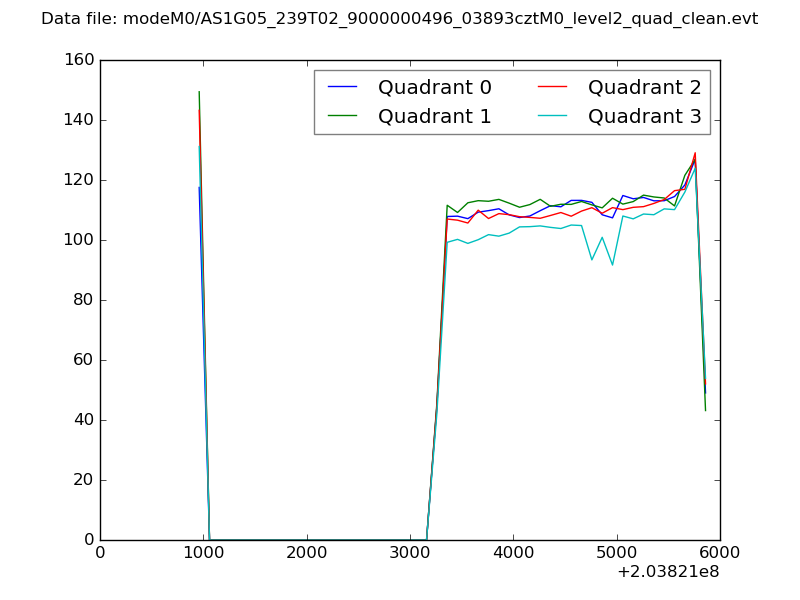 |
|
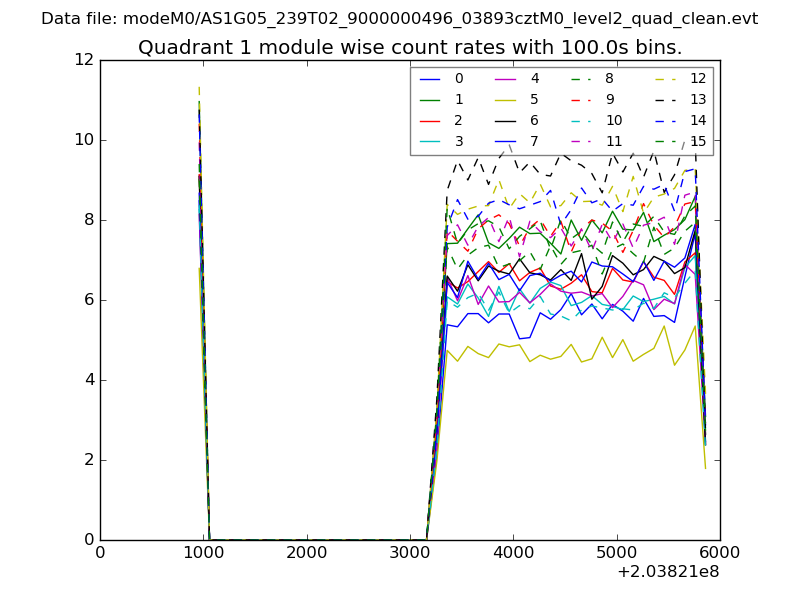
| Module-wise count rates for Quadrant A Data is divided into 100 sec bins |
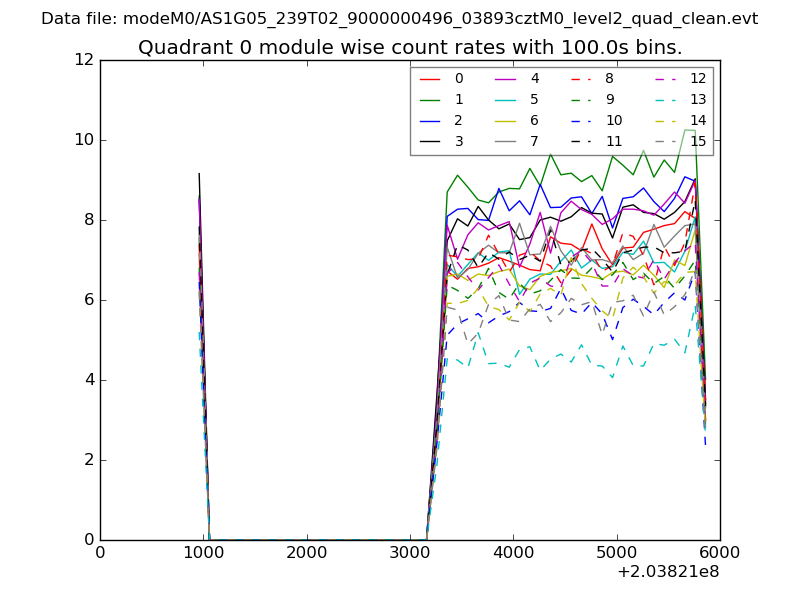 |
 |
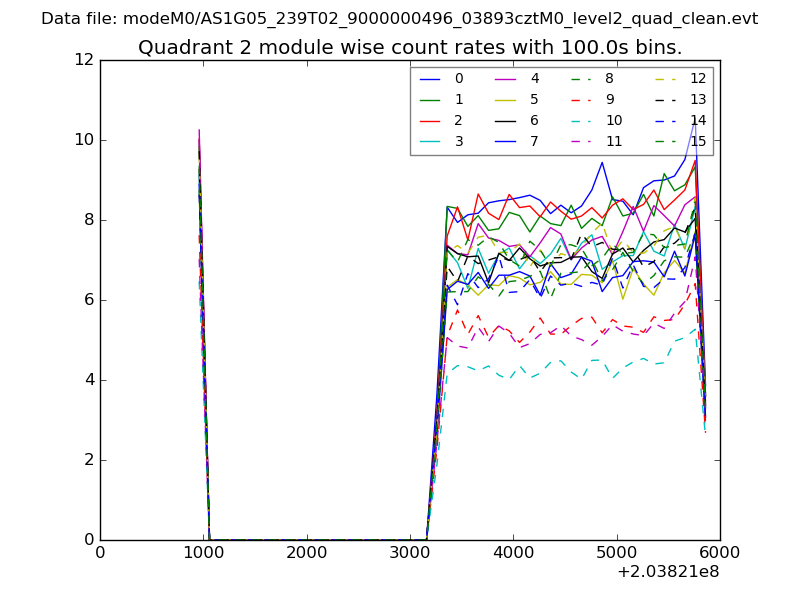
| Module-wise count rates for Quadrant B Data is divided into 100 sec bins |
 |
 |
| Module-wise count rates for Quadrant C Data is divided into 100 sec bins |
 |
 |
| Module-wise count rates for Quadrant D Data is divided into 100 sec bins |
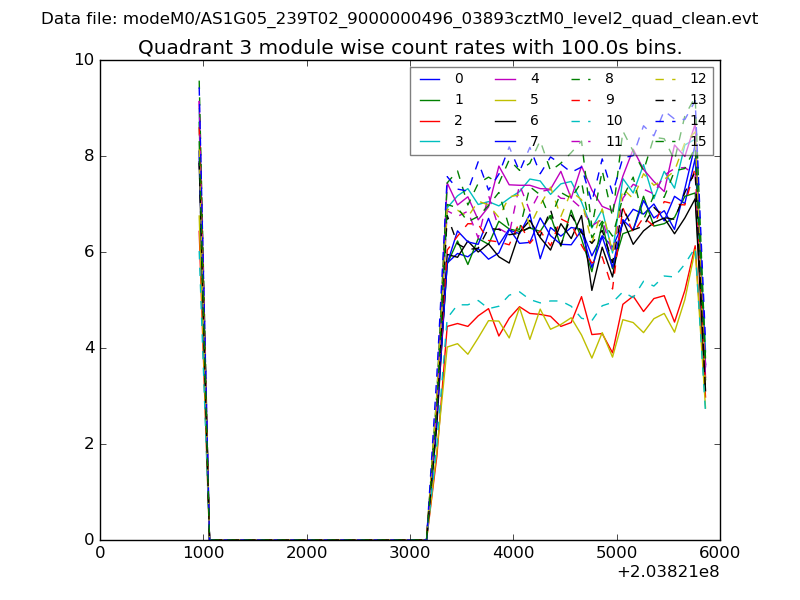 |
 |
| Parameter | Plot |
|---|---|
| CZT HV Monitor | 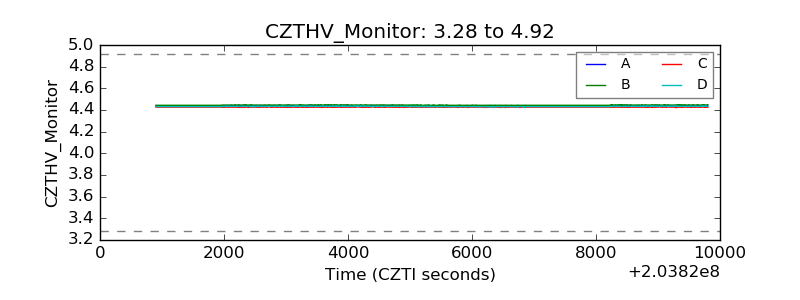 |
| D_VDD | 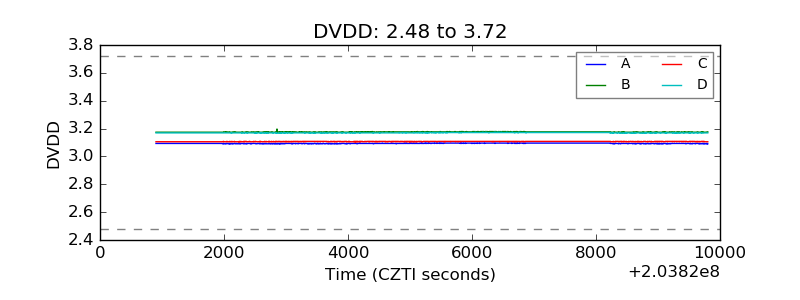 |
| Temperature 1 | 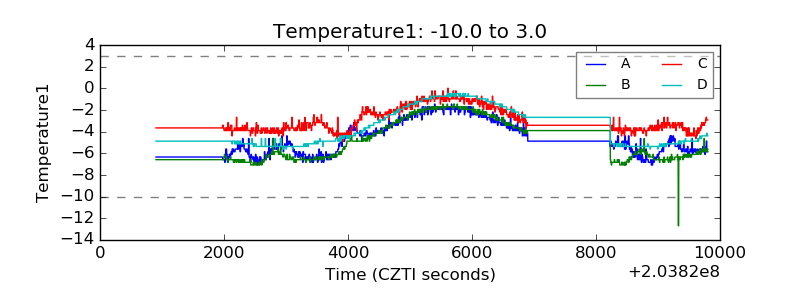 |
| Veto HV Monitor | 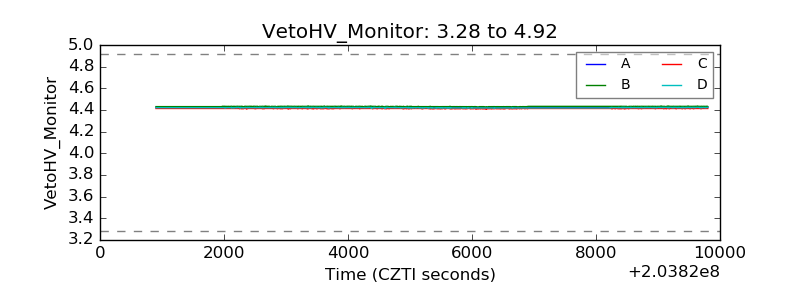 |
| Veto LLD |  |
| Alpha Counter | 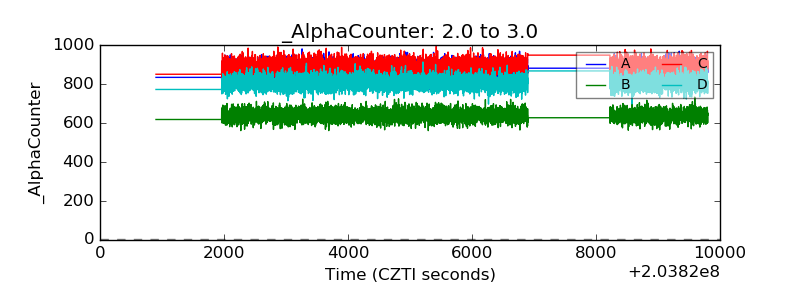 |
| _CPM_Rate | 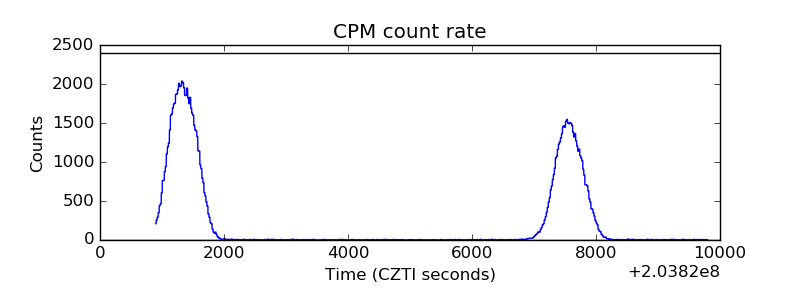 |
| CZT Counter | 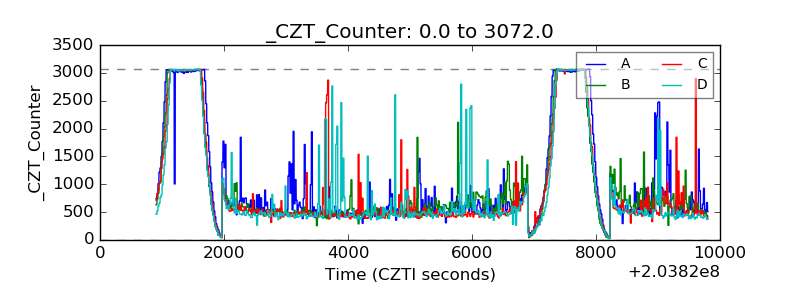 |
| +2.5 Volts monitor |  |
| +5 Volts monitor |  |
| Veto Counter | 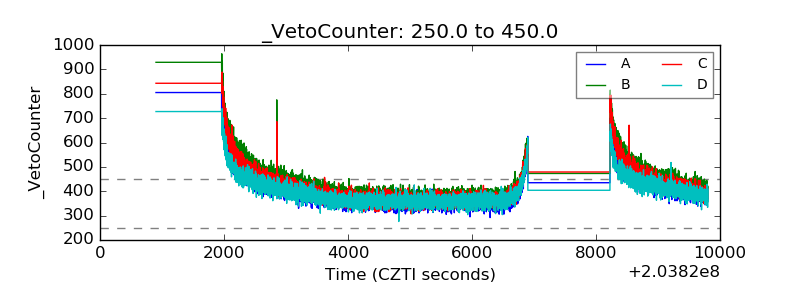 |