| Param | Original file | Final file |
|---|---|---|
| Filename | modeM0/AS1G05_239T02_9000000496_03894cztM0_level2.evt | modeM0/AS1G05_239T02_9000000496_03894cztM0_level2_quad_clean.evt |
| Size (bytes) | 469,278,720 | 57,432,960 |
| Size | 447.5 MB | 54.8 MB |
| Events in quadrant A | 3,560,625 | 336,695 |
| Events in quadrant B | 3,480,493 | 339,352 |
| Events in quadrant C | 3,757,846 | 327,494 |
| Events in quadrant D | 3,008,452 | 318,469 |
| Mode M0 | |||
|---|---|---|---|
| Quadrant | BADHDUFLAG | Total packets | Discarded packets |
| A | 0 | 14224 | 2 |
| B | 0 | 14208 | 1 |
| C | 0 | 15242 | 1 |
| D | 0 | 13050 | 1 |
| Mode M9 | |||
|---|---|---|---|
| Quadrant | BADHDUFLAG | Total packets | Discarded packets |
| A | 0 | 13 | 0 |
| B | 0 | 13 | 0 |
| C | 0 | 13 | 0 |
| D | 0 | 13 | 0 |
| Mode SS | |||
|---|---|---|---|
| Quadrant | BADHDUFLAG | Total packets | Discarded packets |
| A | 0 | 120 | 0 |
| B | 0 | 120 | 0 |
| C | 0 | 120 | 0 |
| D | 0 | 120 | 0 |
| Quadrant | Total seconds | Saturated seconds | Saturation percentage |
|---|---|---|---|
| A | 5969 | 189 | 3.166360% |
| B | 5969 | 100 | 1.675322% |
| C | 5969 | 81 | 1.357011% |
| D | 5969 | 72 | 1.206232% |
Noise dominated data is calculated using 1-second bins in cleaned event files. If a bin has >2000 counts, and if more than 50% of those come from <1% of pixels, then it is considered to be noise-dominated and hence unusable.
| Quadrant | # 1 sec bins | Bins with >0 counts | Bins with >2000 counts | High rate bins dominated by noise | Noise dominated (total time) | Noise dominated (detector-on time) | Marked lightcurve |
|---|---|---|---|---|---|---|---|
| A | 7269 | 5969 | 95 | 95 | 1.31% | 1.59% | 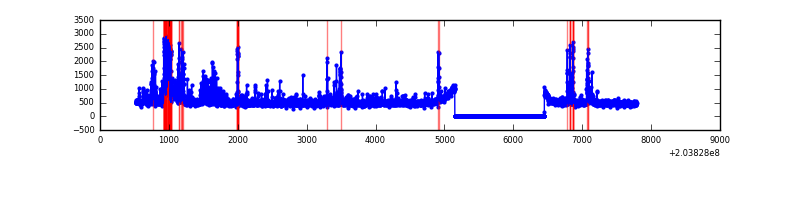 |
| B | 7269 | 5969 | 7 | 7 | 0.10% | 0.12% | 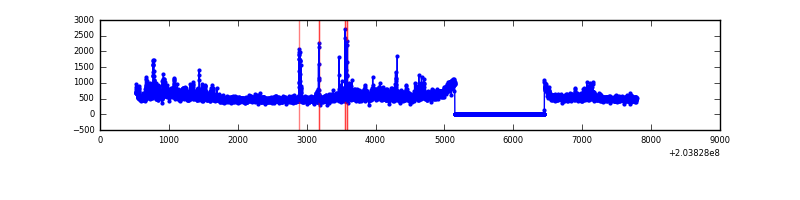 |
| C | 7269 | 5969 | 29 | 29 | 0.40% | 0.49% | 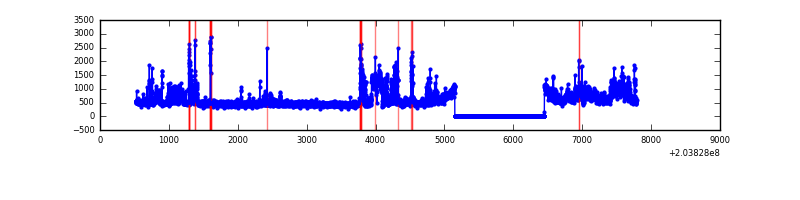 |
| D | 7269 | 5969 | 38 | 38 | 0.52% | 0.64% | 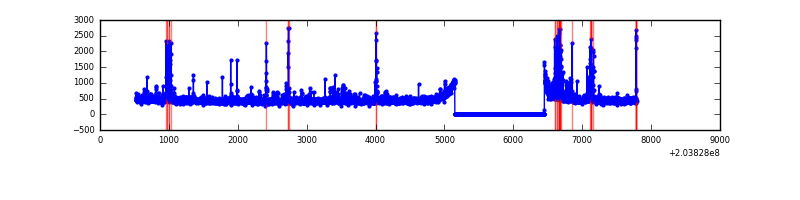 |
Top three noisy pixels from each quadrant. If the there are fewer than three noisy pixels in the level2.evt file, extra rows are filled as -1
| Pixel properties | Quadrant properties | ||||||
|---|---|---|---|---|---|---|---|
| Quadrant | DetID | PixID | Counts | Sigma | Mean | Median | Sigma |
| A | 13 | 251 | 378521 | 2502.8 | 743 | 728 | 150.9 |
| A | 0 | 118 | 140053 | 923.0 | 743 | 728 | 150.9 |
| A | 2 | 79 | 77767 | 510.37 | 743 | 728 | 150.9 |
| B | 7 | 221 | 288855 | 1997.05 | 755 | 741 | 144.3 |
| B | 15 | 204 | 195326 | 1348.76 | 755 | 741 | 144.3 |
| B | 4 | 48 | 30232 | 204.41 | 755 | 741 | 144.3 |
| C | 2 | 53 | 900552 | 5424.74 | 713 | 719 | 165.9 |
| C | 12 | 4 | 43525 | 258.06 | 713 | 719 | 165.9 |
| C | 7 | 222 | 20746 | 120.73 | 713 | 719 | 165.9 |
| D | 13 | 239 | 110463 | 637.74 | 712 | 694 | 172.1 |
| D | 2 | 14 | 36198 | 206.27 | 712 | 694 | 172.1 |
| D | 13 | 223 | 30051 | 170.56 | 712 | 694 | 172.1 |
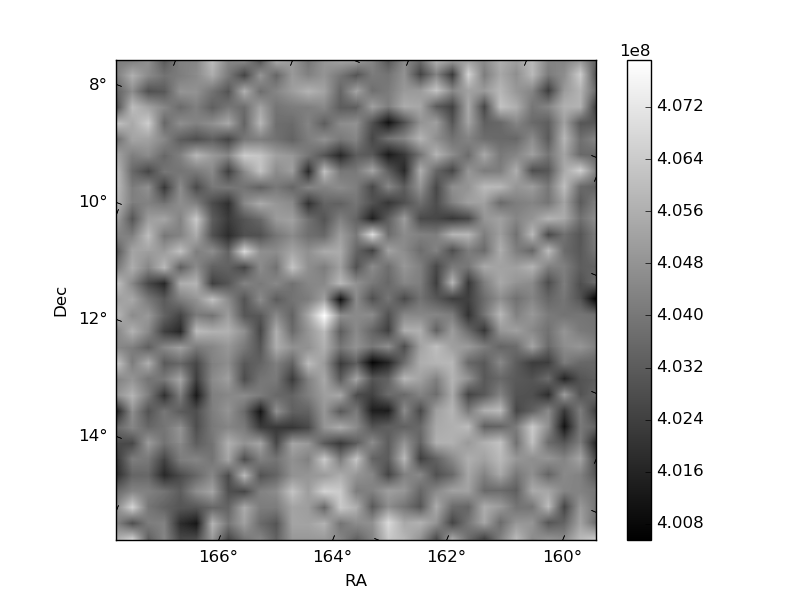
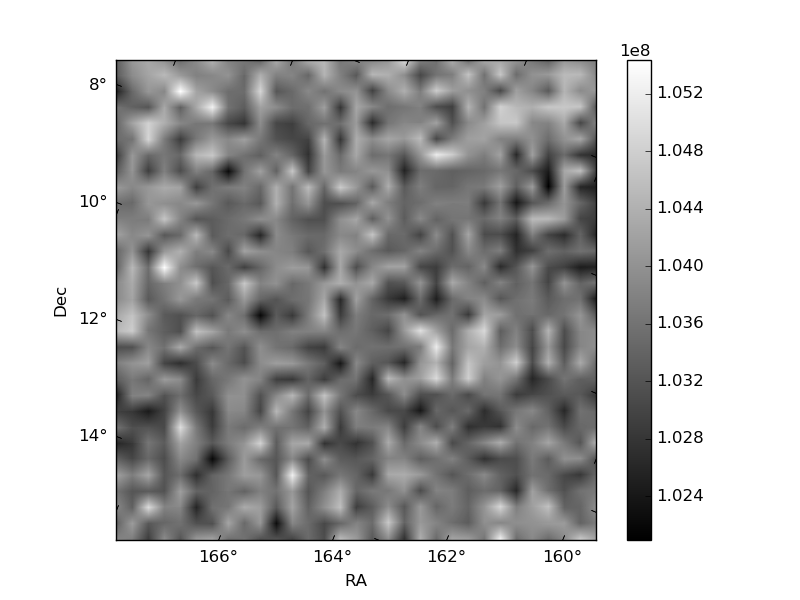
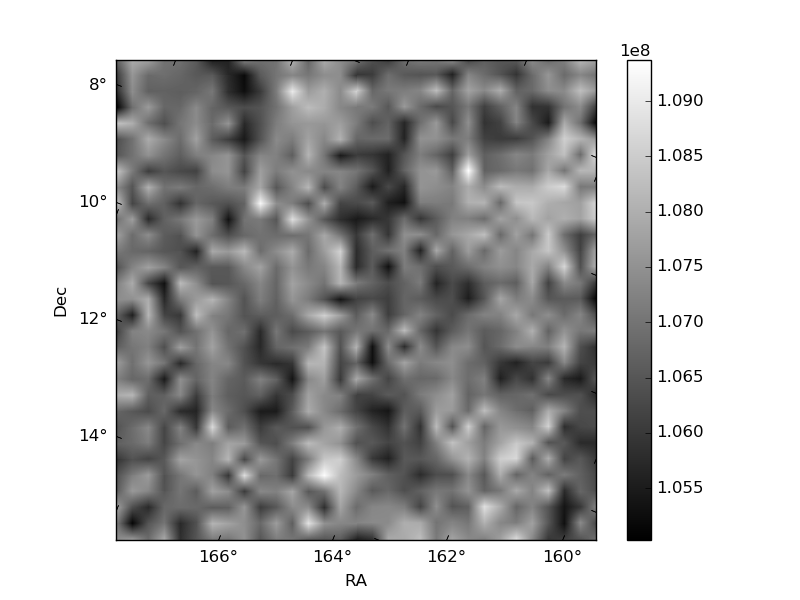
Histogram calculated using DETX and DETY for each event in the final _common_clean file
| Quadrant A | 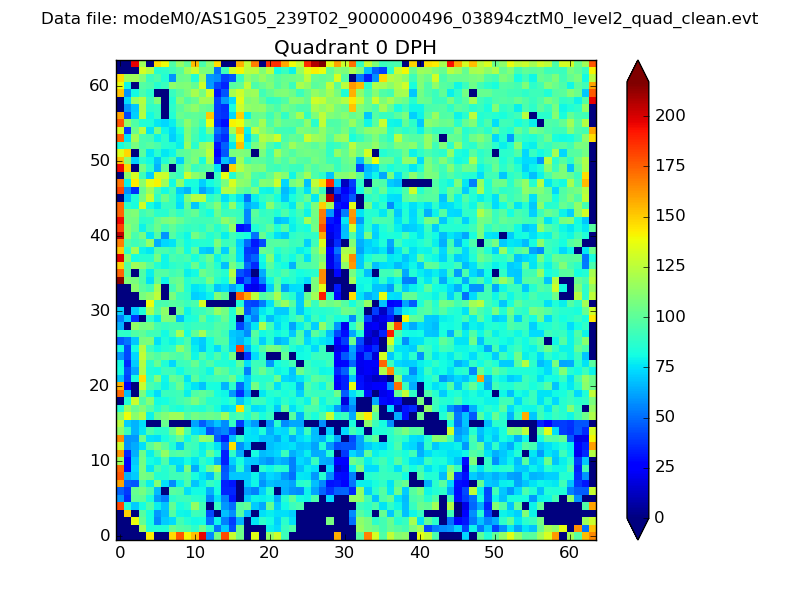 |
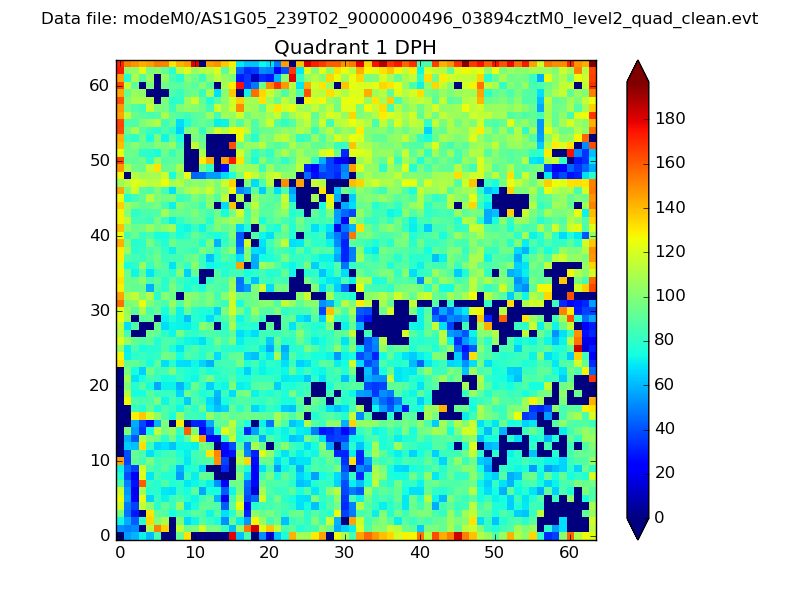 |
Quadrant B |
|---|---|---|---|
| Quadrant D | 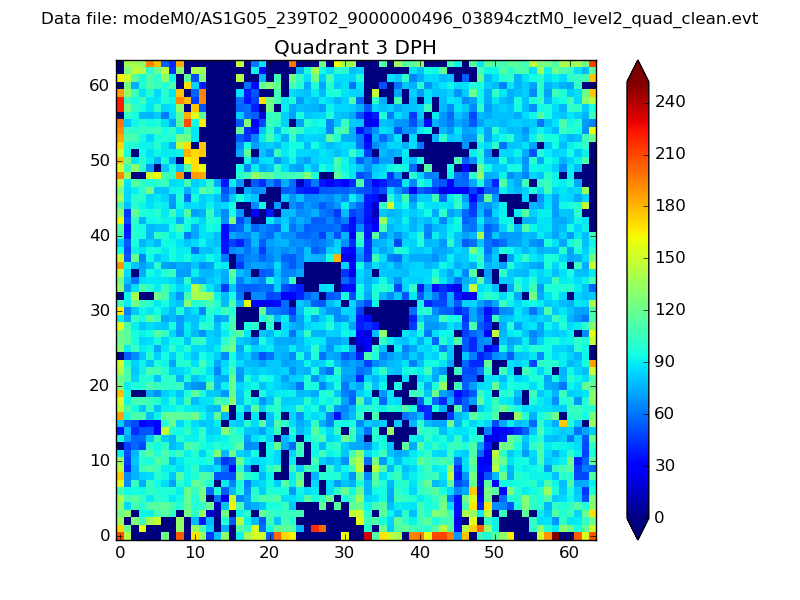 |
 |
Quadrant C |
| Plot type | Count rate plots | Images |
|---|---|---|
| Comparison with Poisson distribution Blue bars denote a histogram of data divided into 1 sec bins. Red curve is a Poisson curve with rate = median count rate of data. |
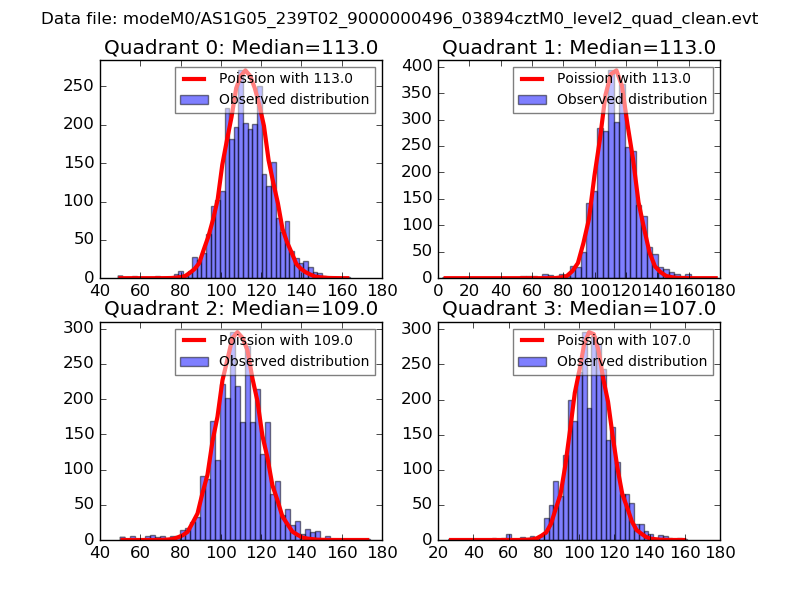 |
 |
| Quadrant-wise count rates Data is divided into 100 sec bins |
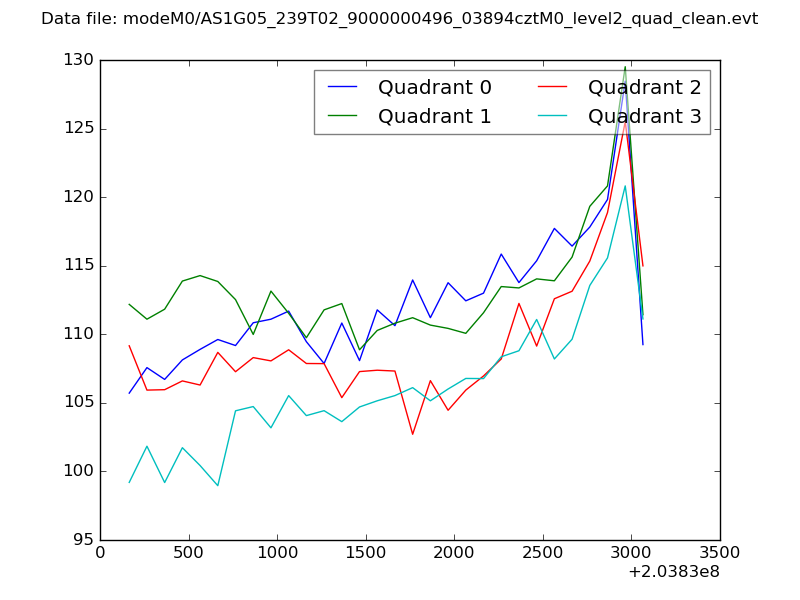 |
|
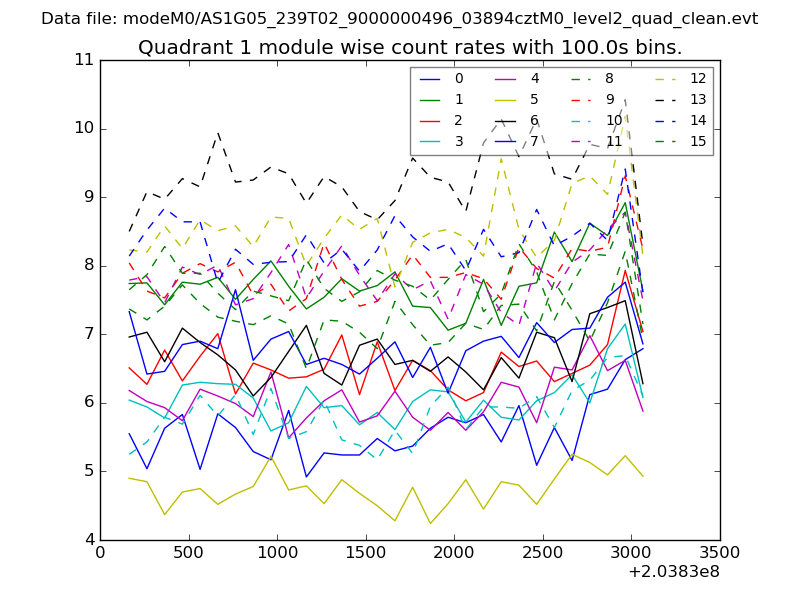
| Module-wise count rates for Quadrant A Data is divided into 100 sec bins |
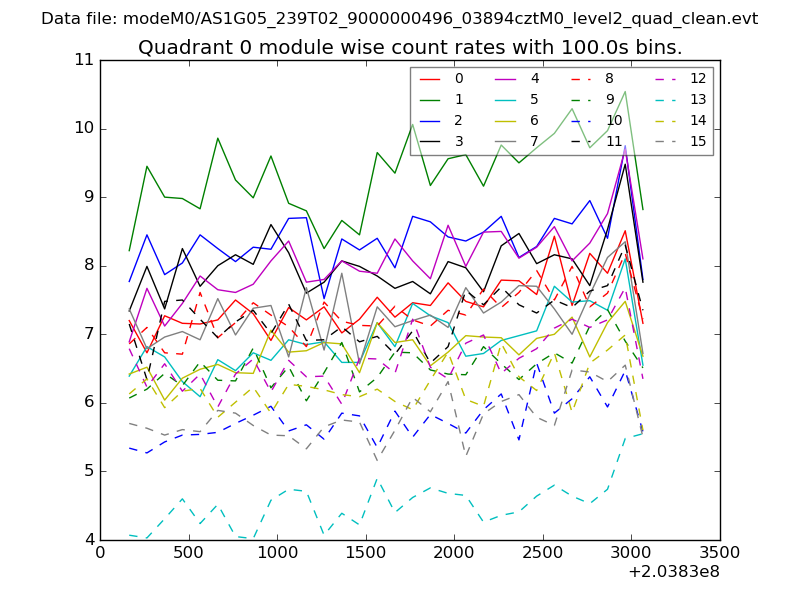 |
 |
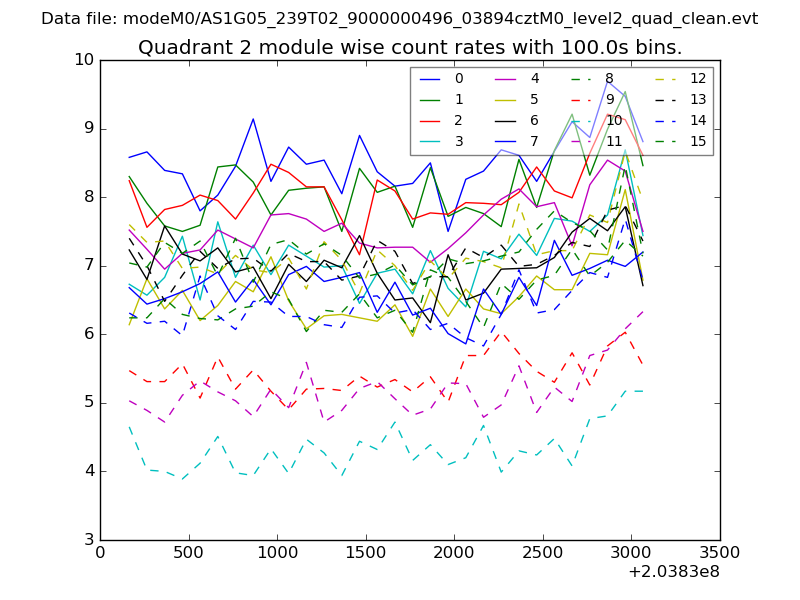
| Module-wise count rates for Quadrant B Data is divided into 100 sec bins |
 |
 |
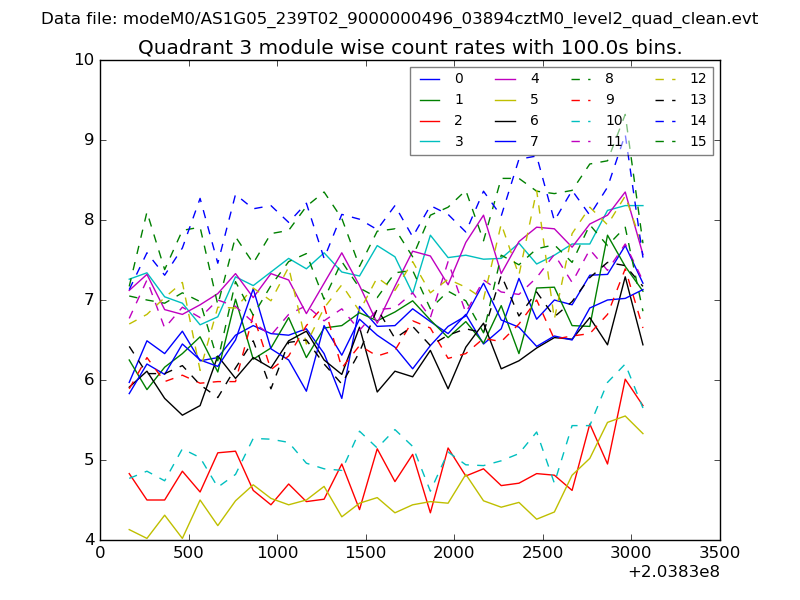
| Module-wise count rates for Quadrant C Data is divided into 100 sec bins |
 |
 |
| Module-wise count rates for Quadrant D Data is divided into 100 sec bins |
 |
 |
| Parameter | Plot |
|---|---|
| CZT HV Monitor | 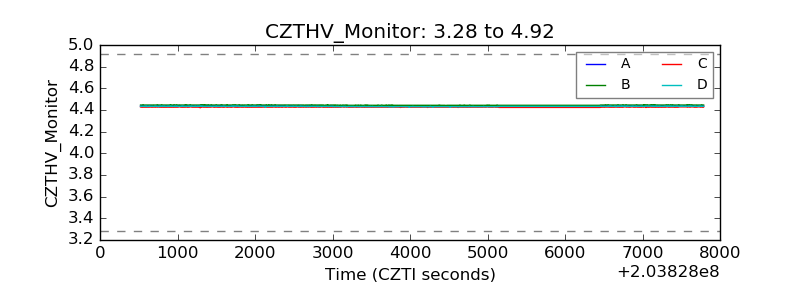 |
| D_VDD | 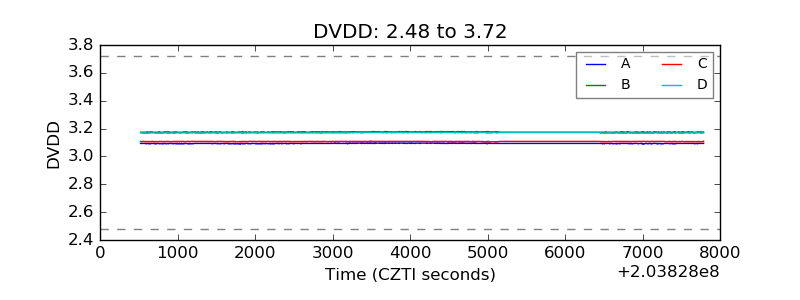 |
| Temperature 1 | 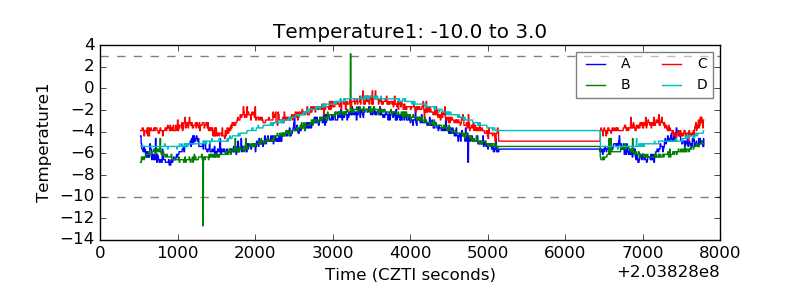 |
| Veto HV Monitor | 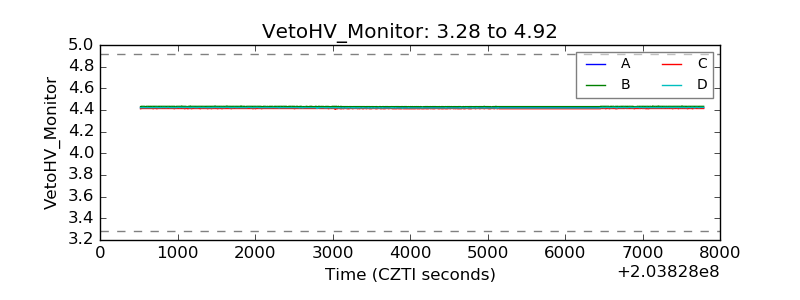 |
| Veto LLD | 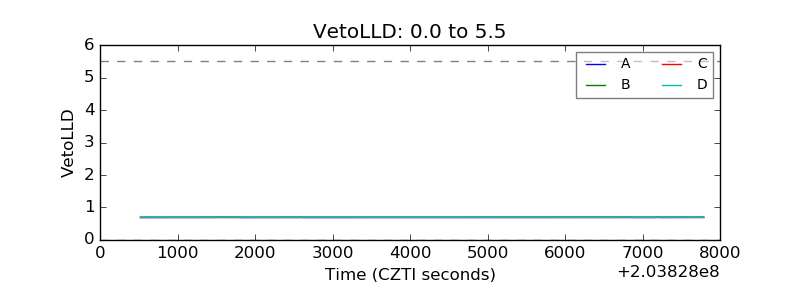 |
| Alpha Counter | 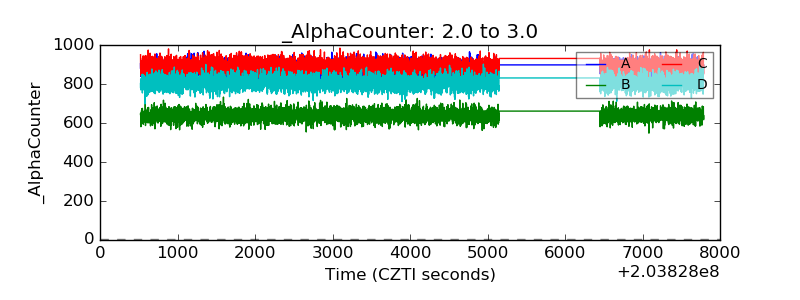 |
| _CPM_Rate | 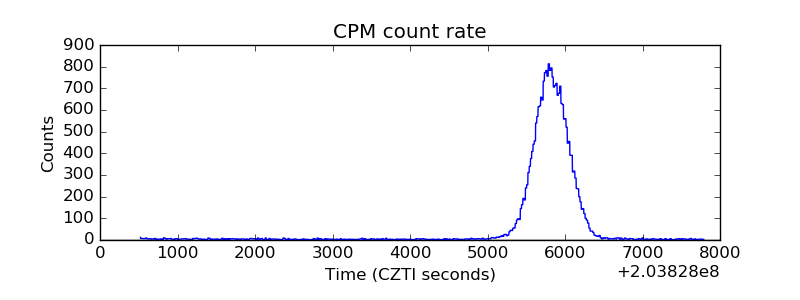 |
| CZT Counter |  |
| +2.5 Volts monitor |  |
| +5 Volts monitor |  |
| Veto Counter | 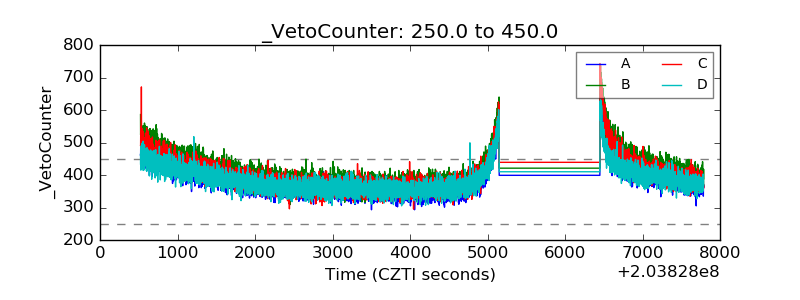 |