| Param | Original file | Final file |
|---|---|---|
| Filename | modeM0/AS1G05_239T02_9000000496_03895cztM0_level2.evt | modeM0/AS1G05_239T02_9000000496_03895cztM0_level2_quad_clean.evt |
| Size (bytes) | 549,584,640 | 68,866,560 |
| Size | 524.1 MB | 65.7 MB |
| Events in quadrant A | 3,655,259 | 412,895 |
| Events in quadrant B | 3,724,143 | 420,487 |
| Events in quadrant C | 4,925,100 | 402,629 |
| Events in quadrant D | 3,895,062 | 391,273 |
| Mode M0 | |||
|---|---|---|---|
| Quadrant | BADHDUFLAG | Total packets | Discarded packets |
| A | 0 | 14988 | 3 |
| B | 0 | 15023 | 2 |
| C | 0 | 19051 | 2 |
| D | 0 | 16166 | 2 |
| Mode M9 | |||
|---|---|---|---|
| Quadrant | BADHDUFLAG | Total packets | Discarded packets |
| A | 0 | 14 | 0 |
| B | 0 | 14 | 0 |
| C | 0 | 14 | 0 |
| D | 0 | 15 | 0 |
| Mode SS | |||
|---|---|---|---|
| Quadrant | BADHDUFLAG | Total packets | Discarded packets |
| A | 0 | 134 | 0 |
| B | 0 | 134 | 0 |
| C | 0 | 134 | 0 |
| D | 0 | 134 | 0 |
| Quadrant | Total seconds | Saturated seconds | Saturation percentage |
|---|---|---|---|
| A | 6557 | 220 | 3.355193% |
| B | 6557 | 166 | 2.531646% |
| C | 6557 | 299 | 4.560012% |
| D | 6557 | 238 | 3.629709% |
Noise dominated data is calculated using 1-second bins in cleaned event files. If a bin has >2000 counts, and if more than 50% of those come from <1% of pixels, then it is considered to be noise-dominated and hence unusable.
| Quadrant | # 1 sec bins | Bins with >0 counts | Bins with >2000 counts | High rate bins dominated by noise | Noise dominated (total time) | Noise dominated (detector-on time) | Marked lightcurve |
|---|---|---|---|---|---|---|---|
| A | 7672 | 6557 | 91 | 91 | 1.19% | 1.39% | 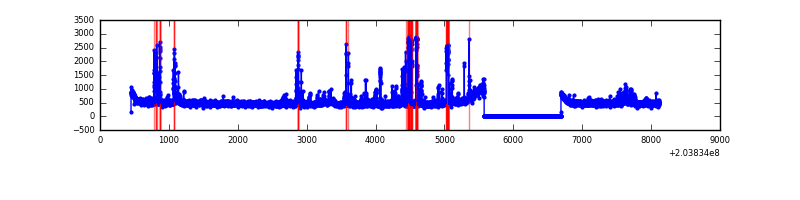 |
| B | 7672 | 6557 | 14 | 14 | 0.18% | 0.21% | 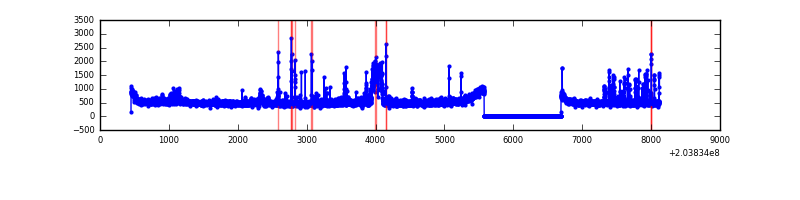 |
| C | 7672 | 6557 | 133 | 133 | 1.73% | 2.03% | 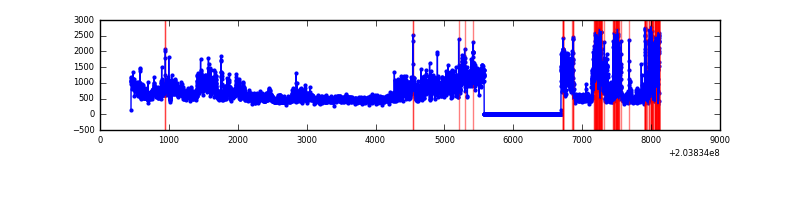 |
| D | 7671 | 6556 | 190 | 190 | 2.48% | 2.90% | 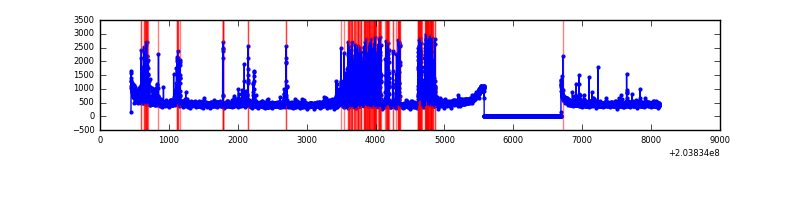 |
Top three noisy pixels from each quadrant. If the there are fewer than three noisy pixels in the level2.evt file, extra rows are filled as -1
| Pixel properties | Quadrant properties | ||||||
|---|---|---|---|---|---|---|---|
| Quadrant | DetID | PixID | Counts | Sigma | Mean | Median | Sigma |
| A | 0 | 128 | 219458 | 1332.69 | 806 | 789 | 164.1 |
| A | 0 | 118 | 174107 | 1056.3 | 806 | 789 | 164.1 |
| A | 0 | 149 | 58032 | 348.87 | 806 | 789 | 164.1 |
| B | 4 | 170 | 188266 | 1177.56 | 819 | 802 | 159.2 |
| B | 7 | 221 | 186098 | 1163.95 | 819 | 802 | 159.2 |
| B | 15 | 204 | 108850 | 678.71 | 819 | 802 | 159.2 |
| C | 2 | 53 | 1868815 | 10386.95 | 768 | 773 | 179.8 |
| C | 12 | 4 | 44759 | 244.58 | 768 | 773 | 179.8 |
| C | 7 | 222 | 9082 | 46.2 | 768 | 773 | 179.8 |
| D | 1 | 20 | 696158 | 3695.23 | 773 | 751 | 188.2 |
| D | 13 | 239 | 105001 | 553.96 | 773 | 751 | 188.2 |
| D | 2 | 14 | 41563 | 216.87 | 773 | 751 | 188.2 |
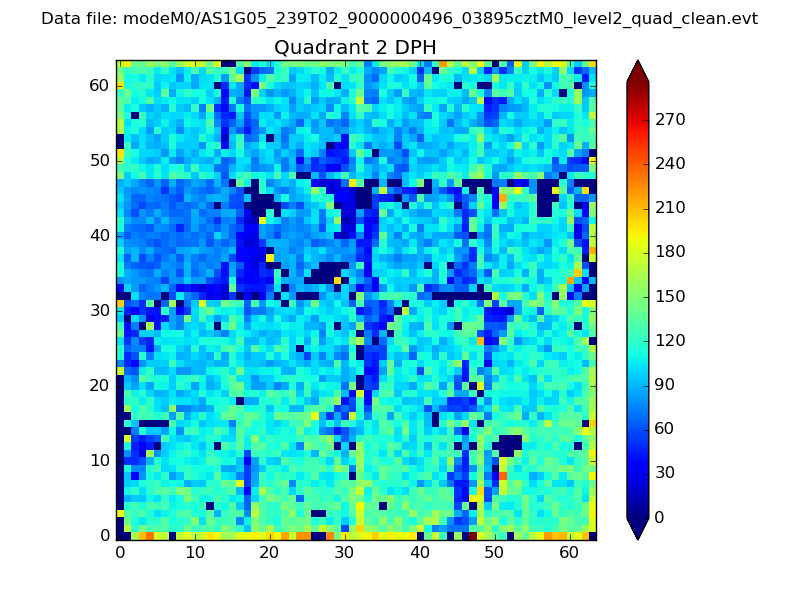
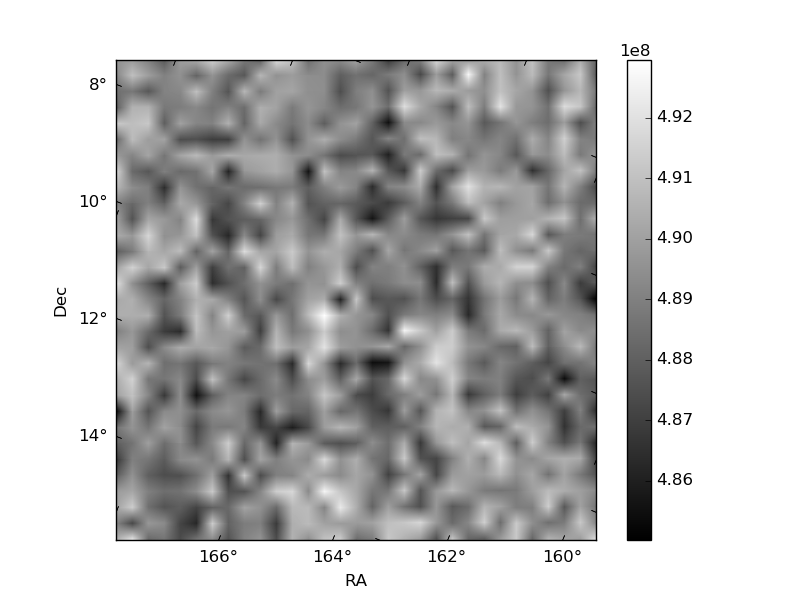
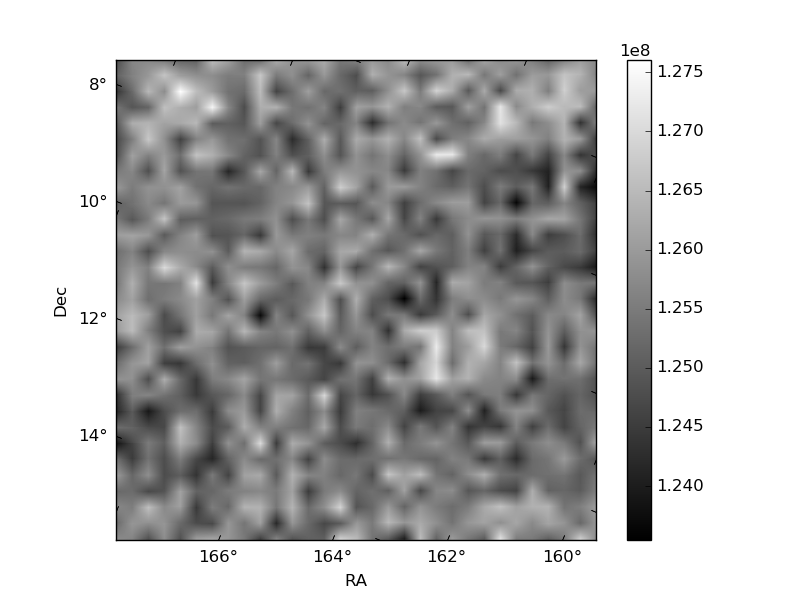
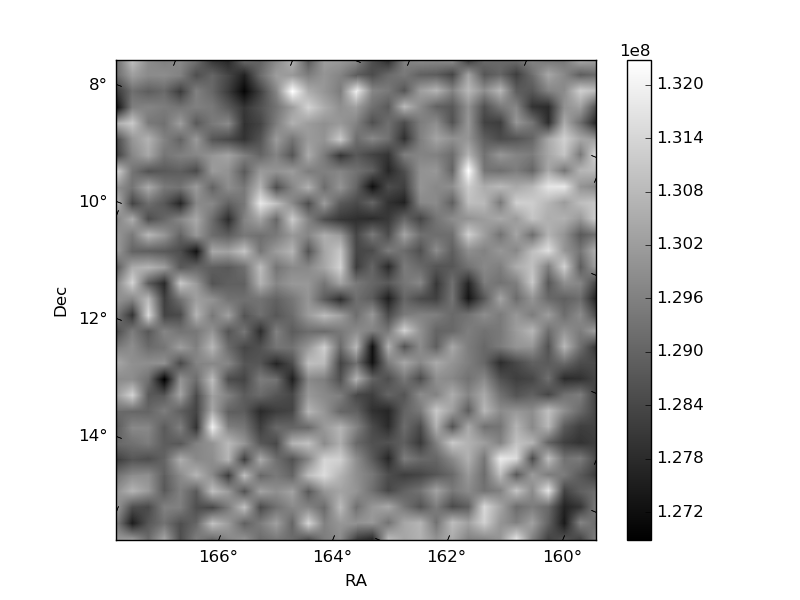
Histogram calculated using DETX and DETY for each event in the final _common_clean file
| Quadrant A | 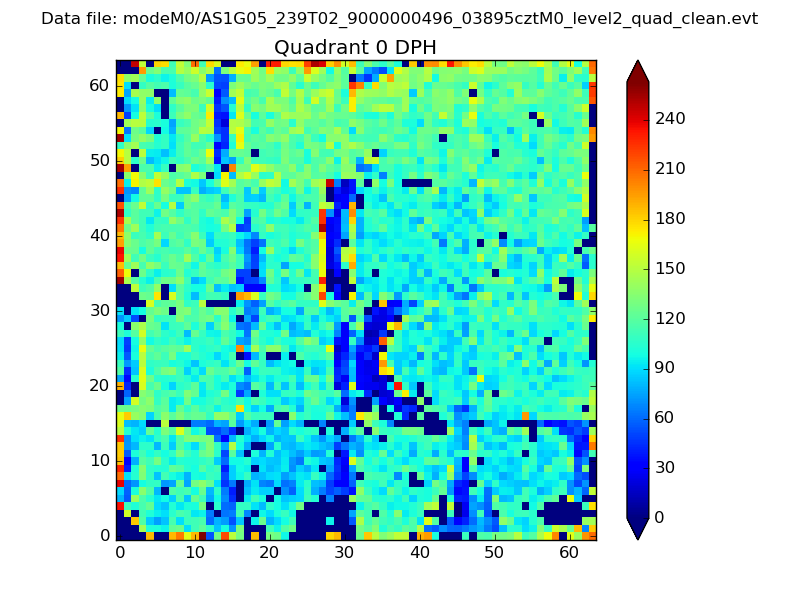 |
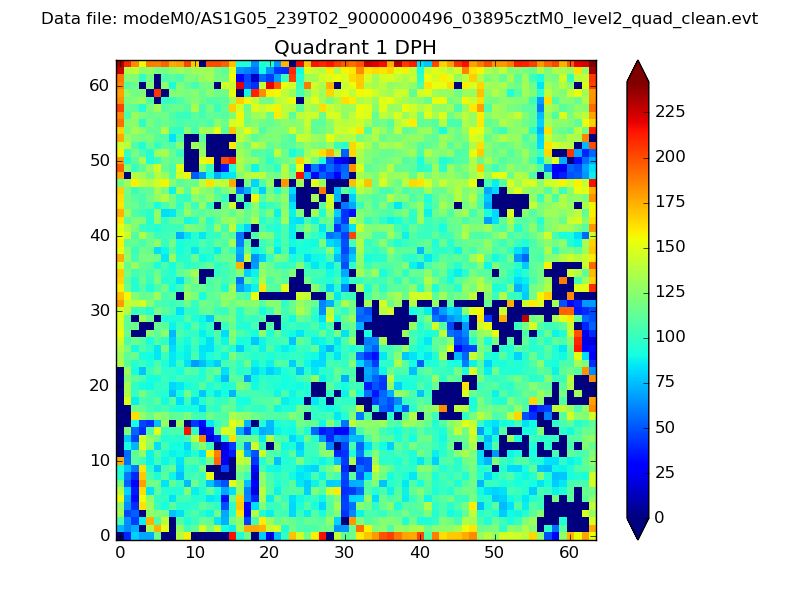 |
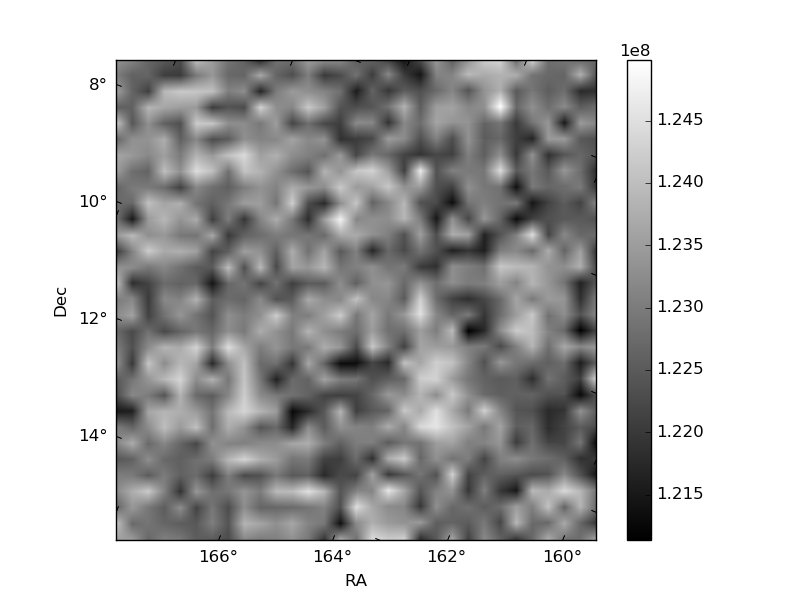
Quadrant B |
|---|---|---|---|
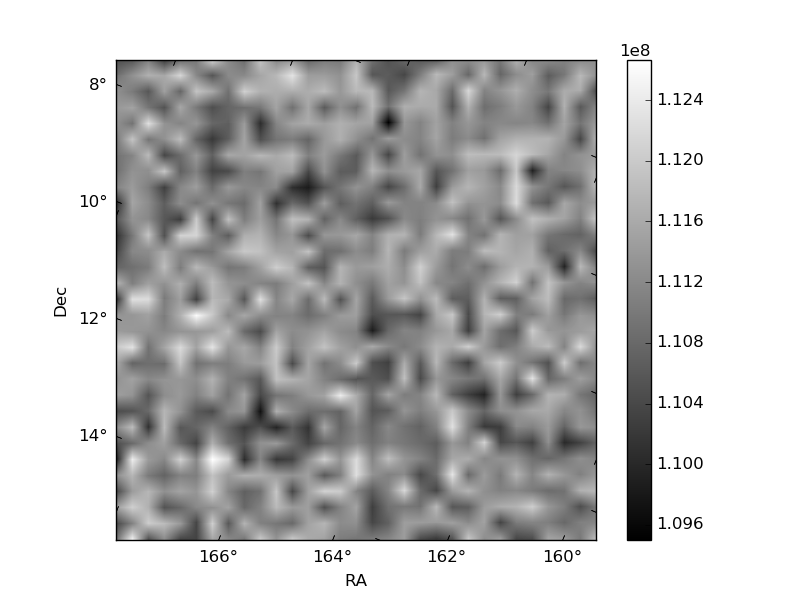
| Quadrant D | 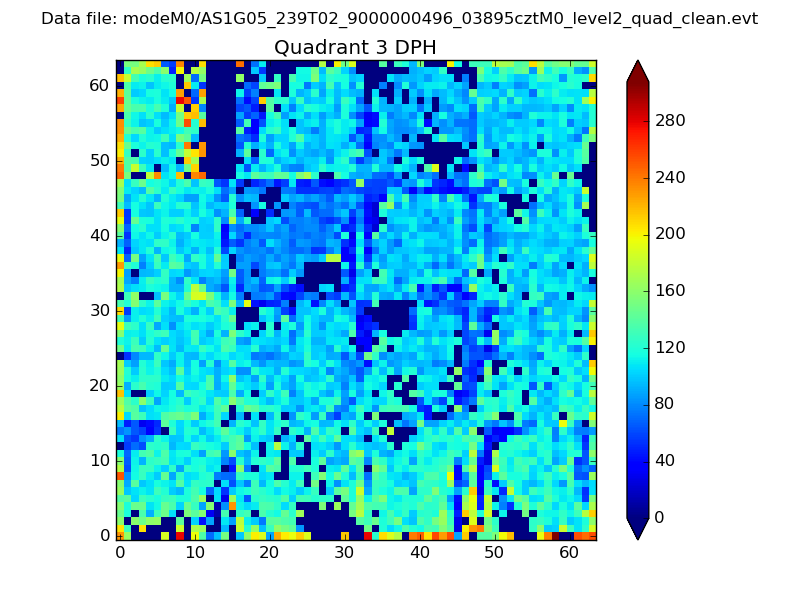 |
 |
Quadrant C |
| Plot type | Count rate plots | Images |
|---|---|---|
| Comparison with Poisson distribution Blue bars denote a histogram of data divided into 1 sec bins. Red curve is a Poisson curve with rate = median count rate of data. |
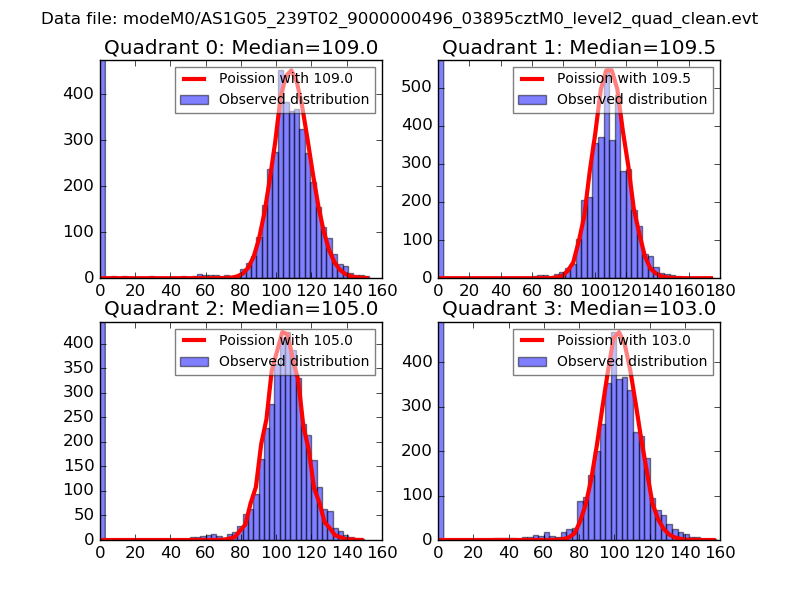 |
 |
| Quadrant-wise count rates Data is divided into 100 sec bins |
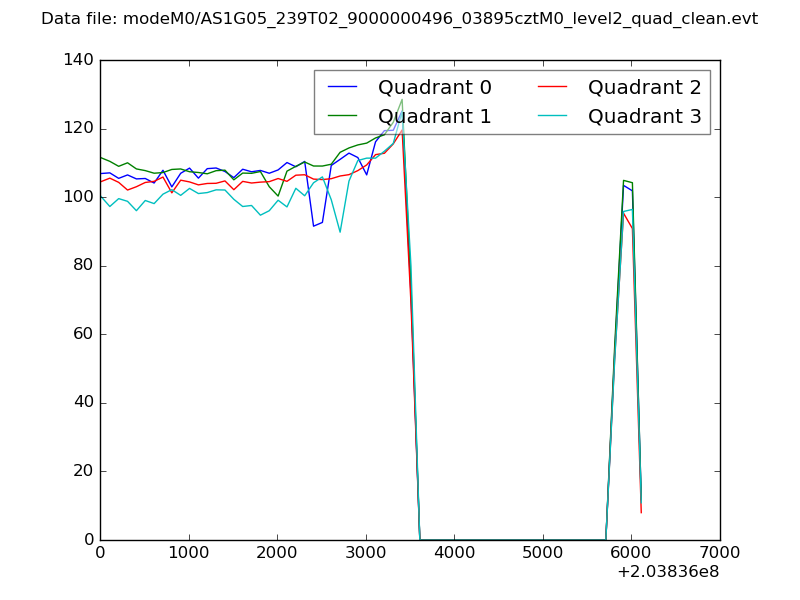 |
|
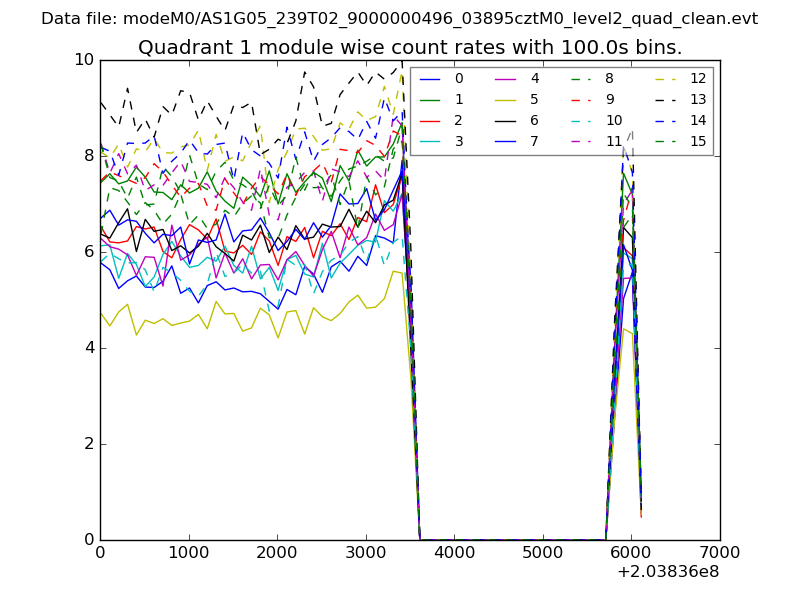
| Module-wise count rates for Quadrant A Data is divided into 100 sec bins |
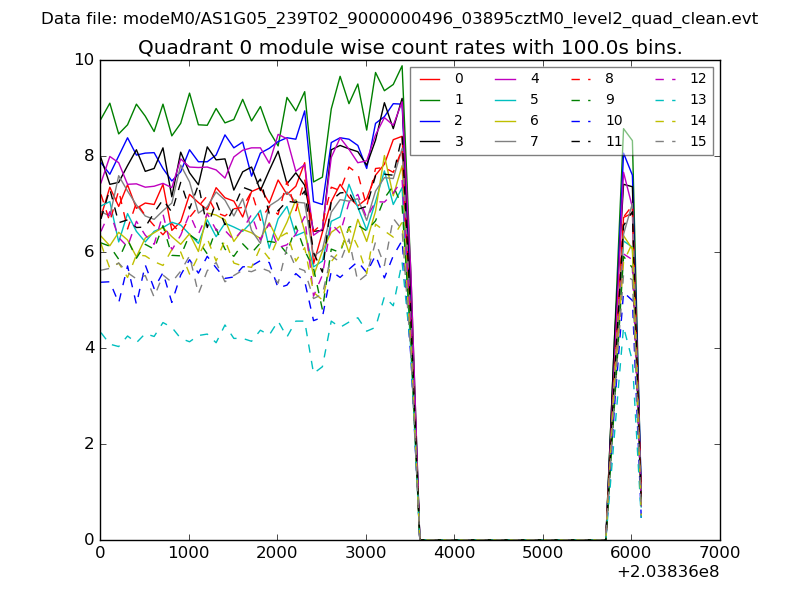 |
 |
| Module-wise count rates for Quadrant B Data is divided into 100 sec bins |
 |
 |
| Module-wise count rates for Quadrant C Data is divided into 100 sec bins |
 |
 |
| Module-wise count rates for Quadrant D Data is divided into 100 sec bins |
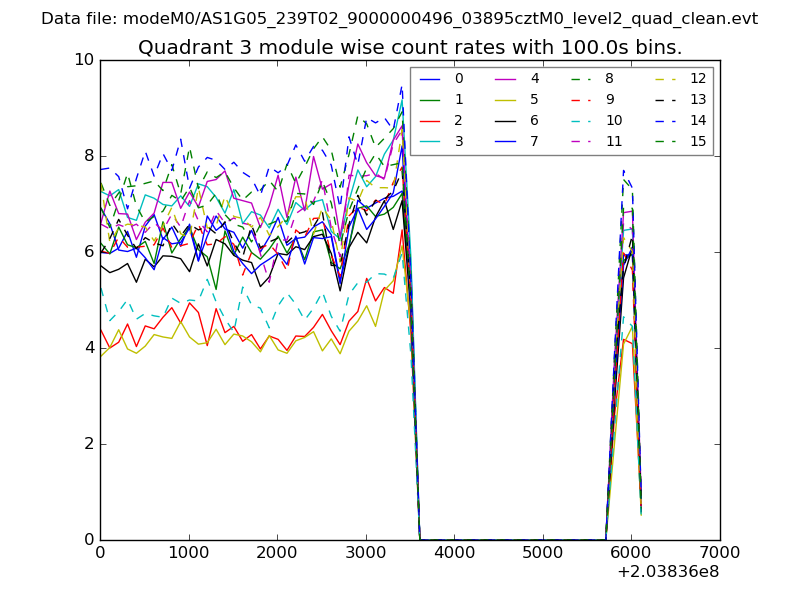 |
 |
| Parameter | Plot |
|---|---|
| CZT HV Monitor | 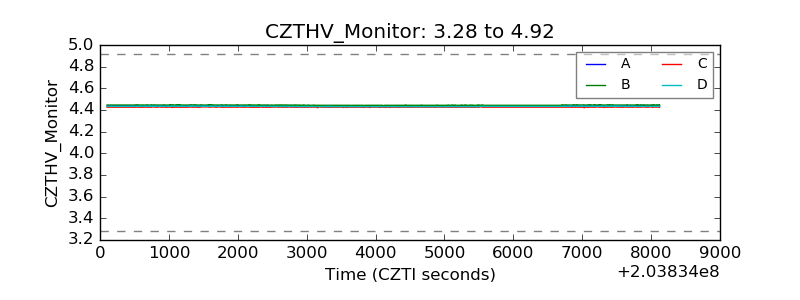 |
| D_VDD | 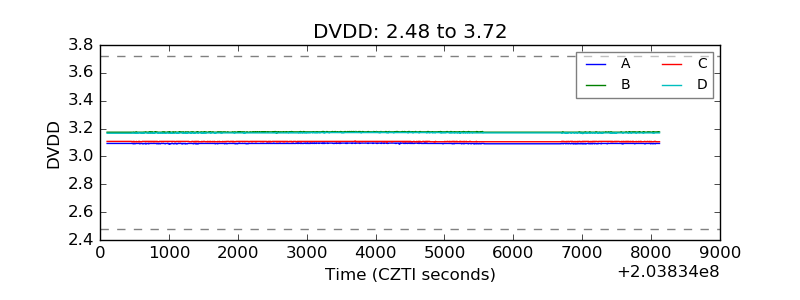 |
| Temperature 1 | 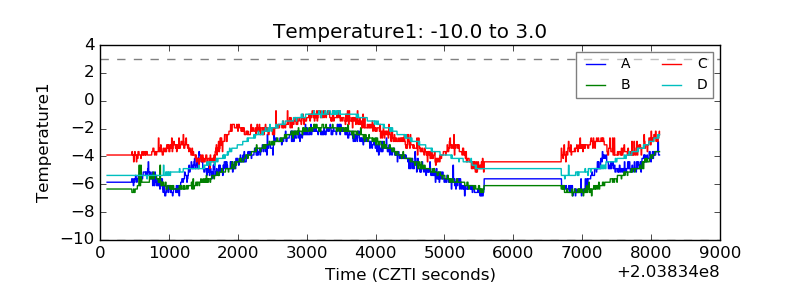 |
| Veto HV Monitor | 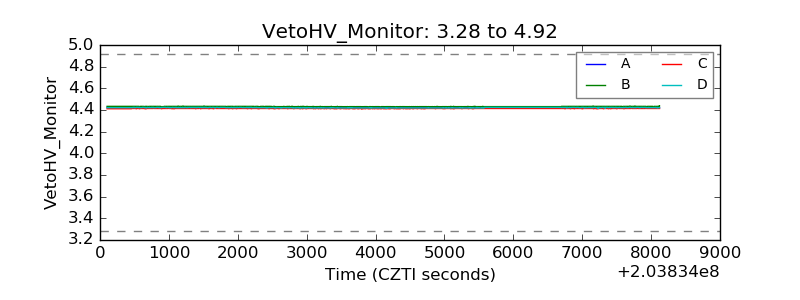 |
| Veto LLD | 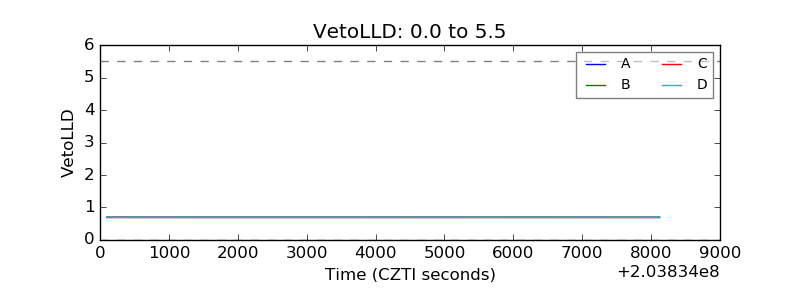 |
| Alpha Counter | 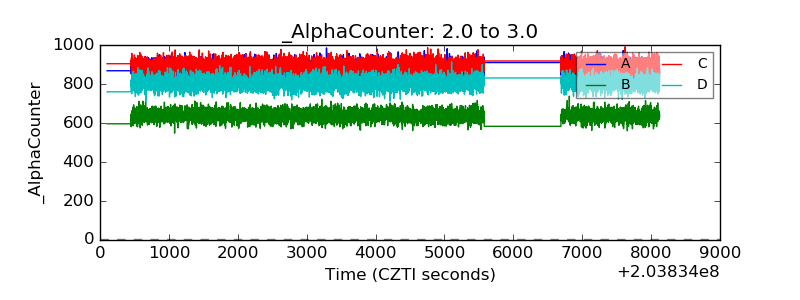 |
| _CPM_Rate | 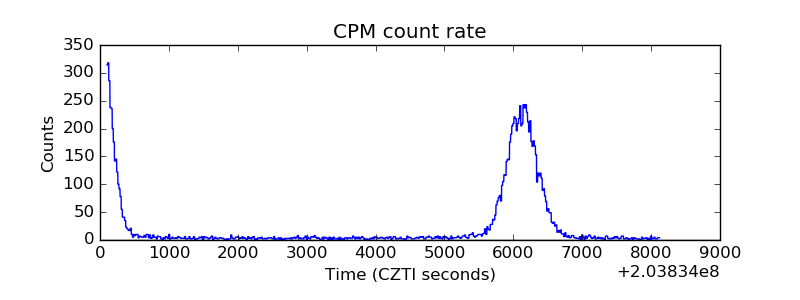 |
| CZT Counter | 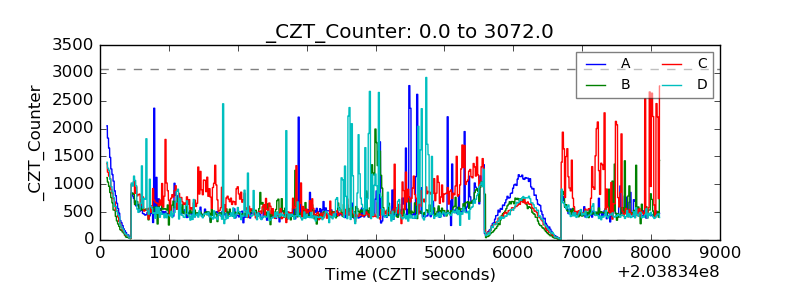 |
| +2.5 Volts monitor |  |
| +5 Volts monitor |  |
| Veto Counter | 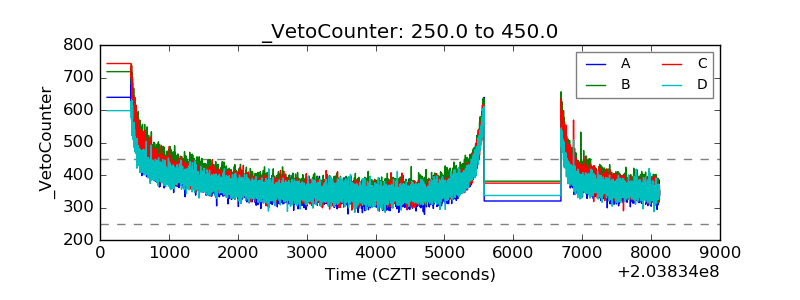 |