| Param | Original file | Final file |
|---|---|---|
| Filename | modeM0/AS1SLEW_01234_9000000495_03884cztM0_level2.evt | modeM0/AS1SLEW_01234_9000000495_03884cztM0_level2_quad_clean.evt |
| Size (bytes) | 41,500,800 | 10,592,640 |
| Size | 39.6 MB | 10.1 MB |
| Events in quadrant A | 287,992 | 68,413 |
| Events in quadrant B | 311,366 | 66,658 |
| Events in quadrant C | 268,041 | 65,575 |
| Events in quadrant D | 339,287 | 64,023 |
| Mode SS | |||
|---|---|---|---|
| Quadrant | BADHDUFLAG | Total packets | Discarded packets |
| A | 0 | 14 | 0 |
| B | 0 | 14 | 2 |
| C | 0 | 14 | 2 |
| D | 0 | 14 | 2 |
| Mode M0 | |||
|---|---|---|---|
| Quadrant | BADHDUFLAG | Total packets | Discarded packets |
| A | 0 | 1482 | 47 |
| B | 0 | 1463 | 52 |
| C | 0 | 1442 | 66 |
| D | 0 | 1718 | 159 |
| Quadrant | Total seconds | Saturated seconds | Saturation percentage |
|---|---|---|---|
| A | 697 | 1 | 0.143472% |
| B | 695 | 0 | 0.000000% |
| C | 688 | 0 | 0.000000% |
| D | 683 | 5 | 0.732064% |
Noise dominated data is calculated using 1-second bins in cleaned event files. If a bin has >2000 counts, and if more than 50% of those come from <1% of pixels, then it is considered to be noise-dominated and hence unusable.
| Quadrant | # 1 sec bins | Bins with >0 counts | Bins with >2000 counts | High rate bins dominated by noise | Noise dominated (total time) | Noise dominated (detector-on time) | Marked lightcurve |
|---|---|---|---|---|---|---|---|
| A | 721 | 717 | 0 | 0 | 0.00% | 0.00% | 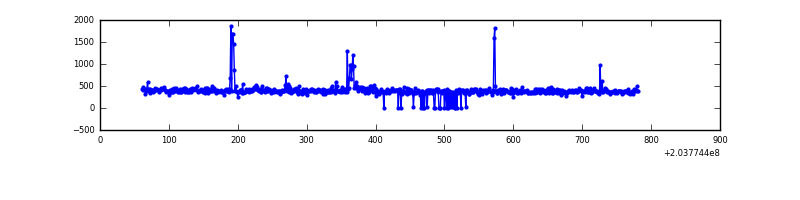 |
| B | 721 | 713 | 0 | 0 | 0.00% | 0.00% | 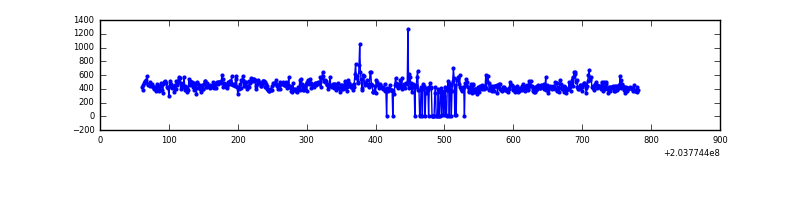 |
| C | 721 | 712 | 0 | 0 | 0.00% | 0.00% | 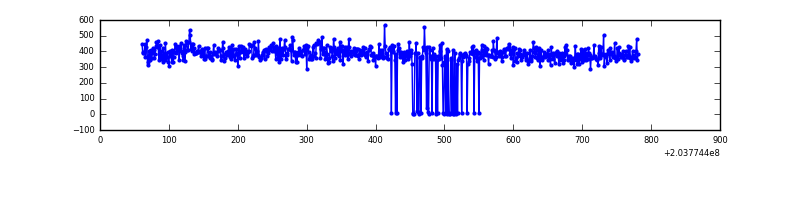 |
| D | 721 | 703 | 9 | 9 | 1.25% | 1.28% | 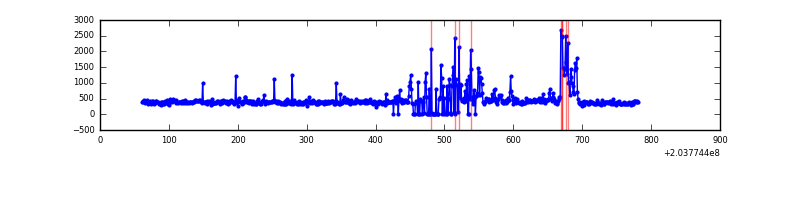 |
Top three noisy pixels from each quadrant. If the there are fewer than three noisy pixels in the level2.evt file, extra rows are filled as -1
| Pixel properties | Quadrant properties | ||||||
|---|---|---|---|---|---|---|---|
| Quadrant | DetID | PixID | Counts | Sigma | Mean | Median | Sigma |
| A | 0 | 118 | 11552 | 702.03 | 69 | 67 | 16.4 |
| A | 15 | 174 | 5253 | 316.98 | 69 | 67 | 16.4 |
| A | 0 | 226 | 1784 | 104.93 | 69 | 67 | 16.4 |
| B | 15 | 204 | 32596 | 2078.81 | 70 | 69 | 15.6 |
| B | 0 | 199 | 3952 | 248.16 | 70 | 69 | 15.6 |
| B | 5 | 200 | 1786 | 109.73 | 70 | 69 | 15.6 |
| C | 8 | 128 | 1153 | 60.8 | 67 | 67 | 17.9 |
| C | 8 | 112 | 944 | 49.1 | 67 | 67 | 17.9 |
| C | 5 | 16 | 674 | 33.99 | 67 | 67 | 17.9 |
| D | 12 | 217 | 55486 | 3075.47 | 66 | 64 | 18.0 |
| D | 13 | 248 | 12507 | 690.49 | 66 | 64 | 18.0 |
| D | 14 | 34 | 9781 | 539.21 | 66 | 64 | 18.0 |
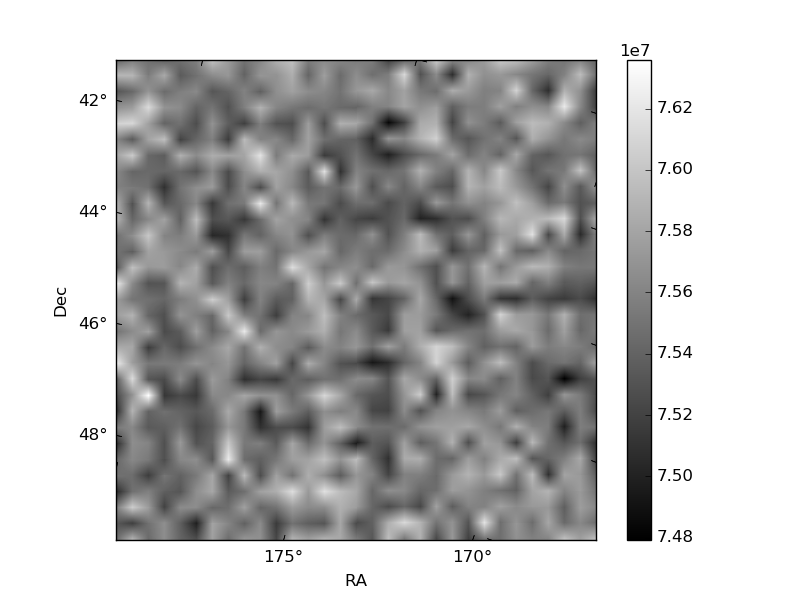
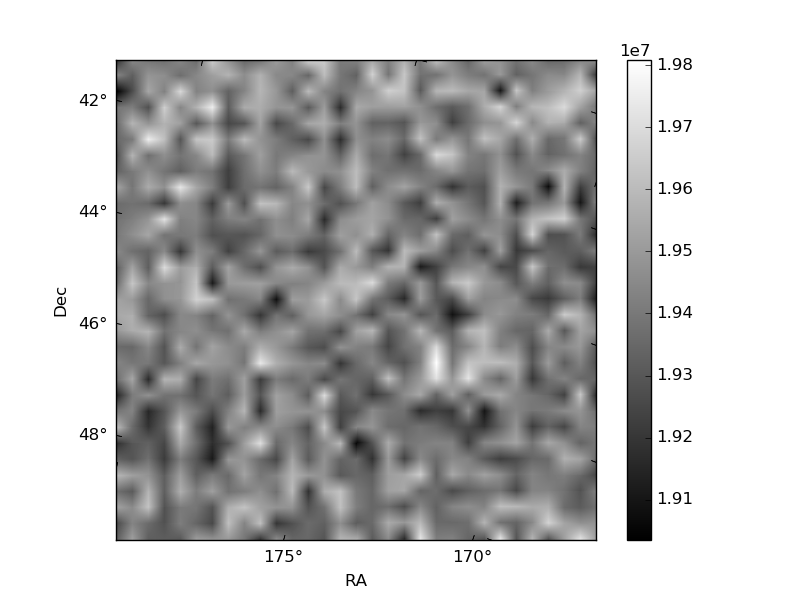
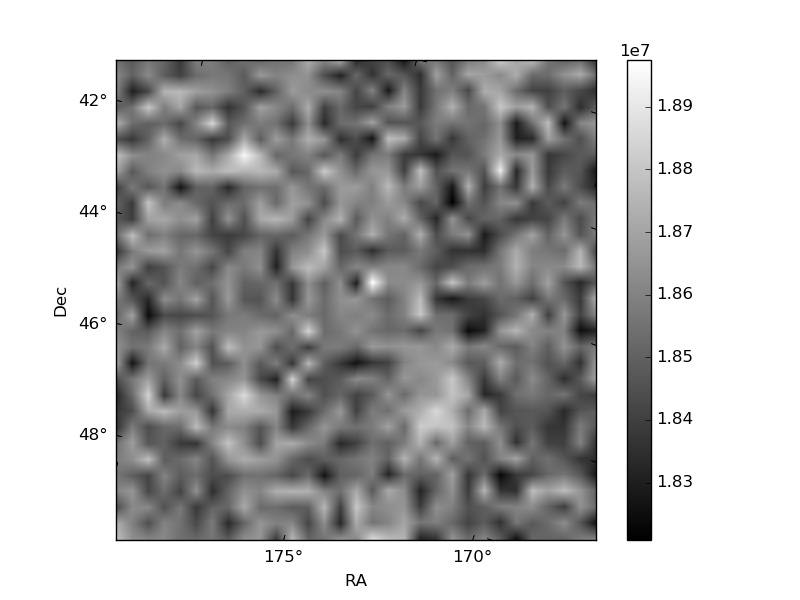
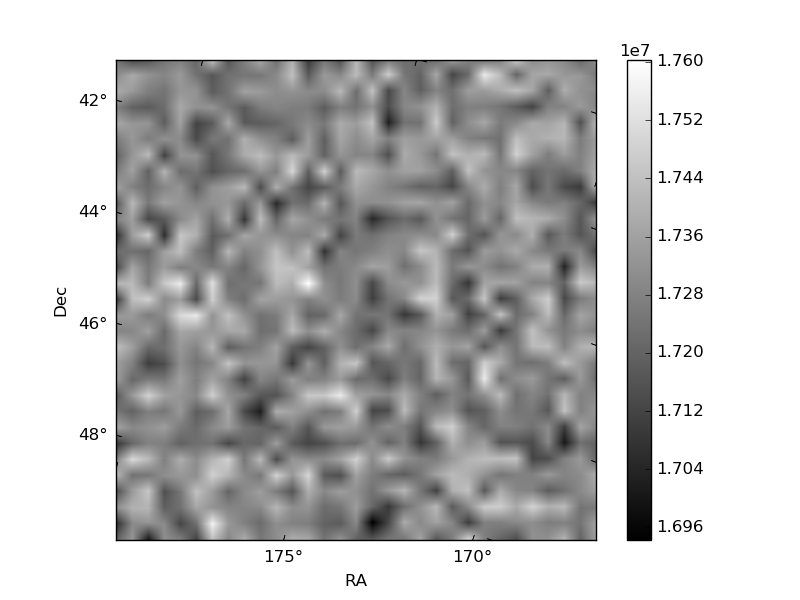
Histogram calculated using DETX and DETY for each event in the final _common_clean file
| Quadrant A | 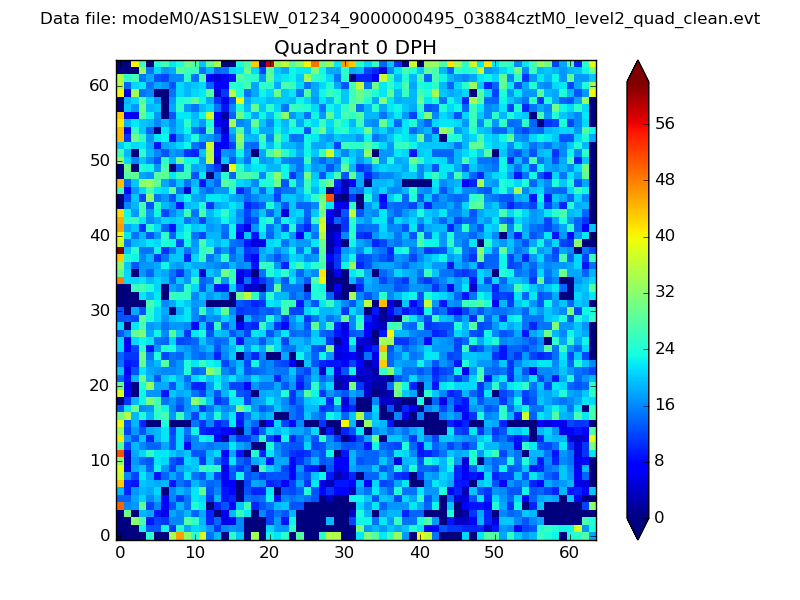 |
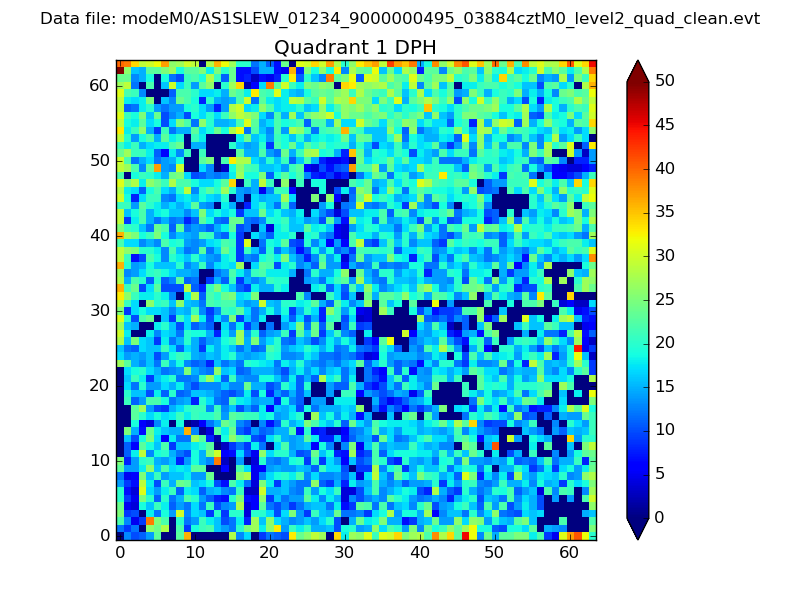 |
Quadrant B |
|---|---|---|---|
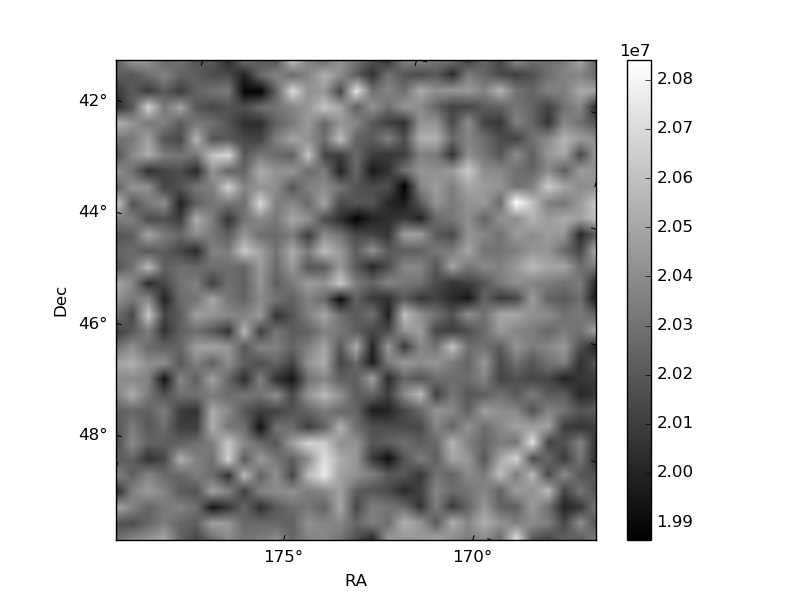
| Quadrant D | 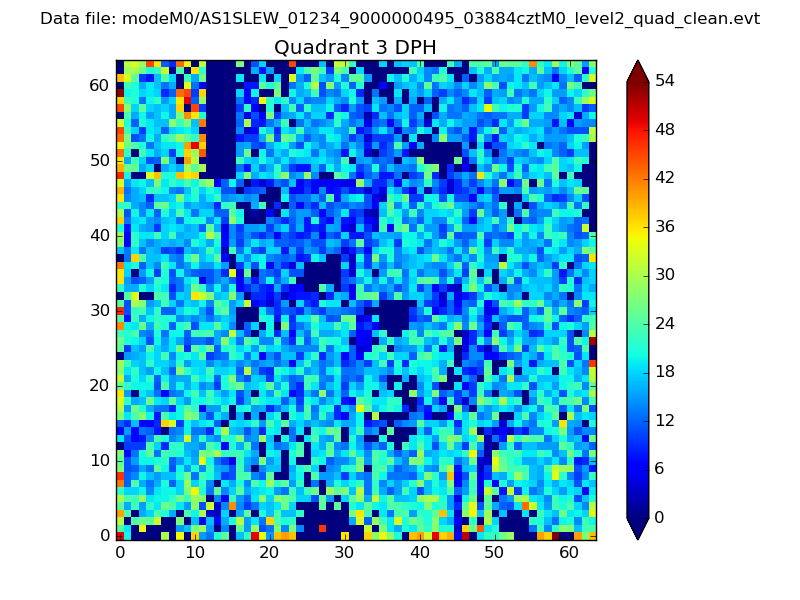 |
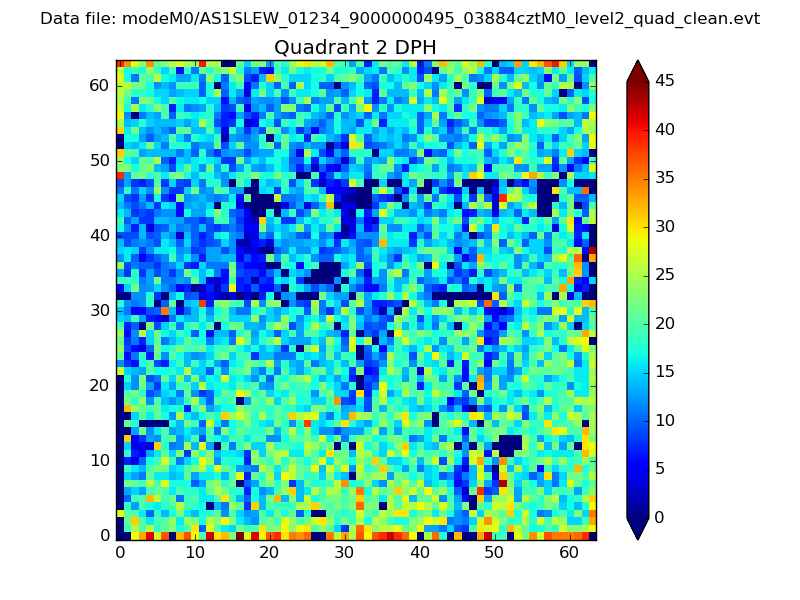 |
Quadrant C |
| Plot type | Count rate plots | Images |
|---|---|---|
| Comparison with Poisson distribution Blue bars denote a histogram of data divided into 1 sec bins. Red curve is a Poisson curve with rate = median count rate of data. |
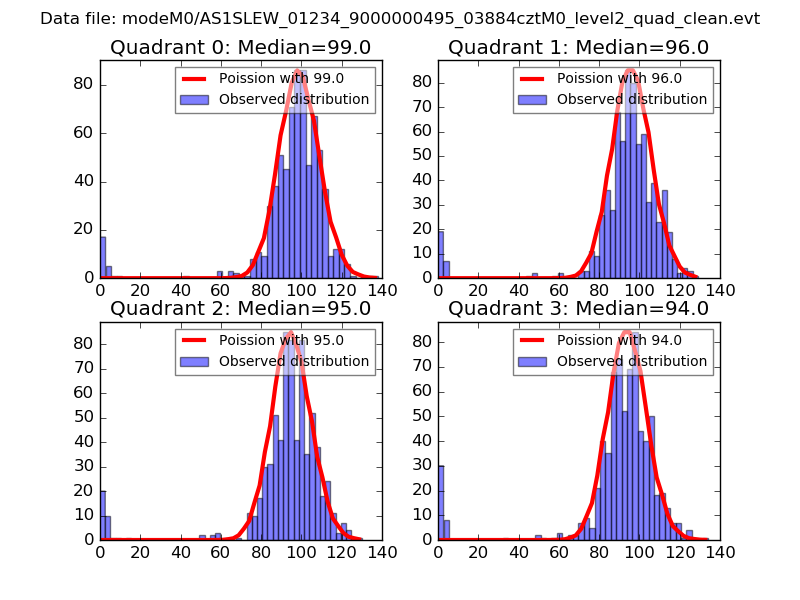 |
 |
| Quadrant-wise count rates Data is divided into 100 sec bins |
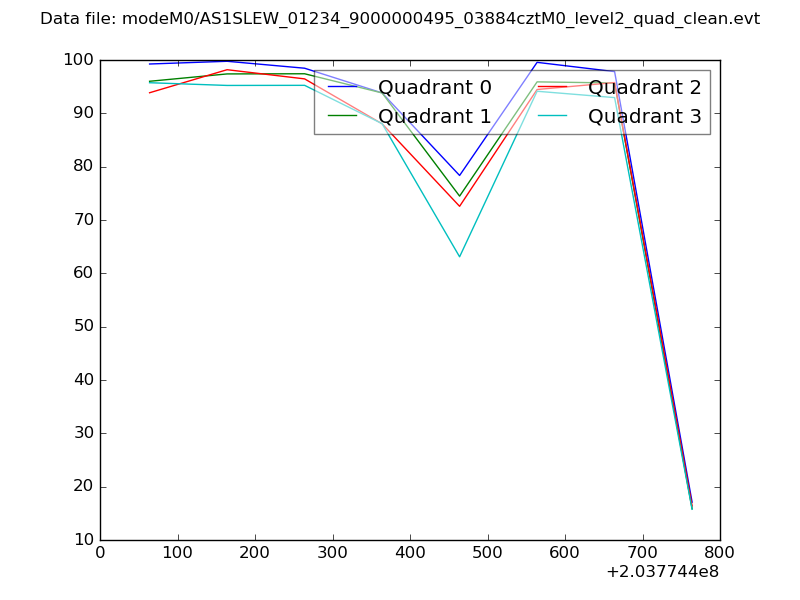 |
|
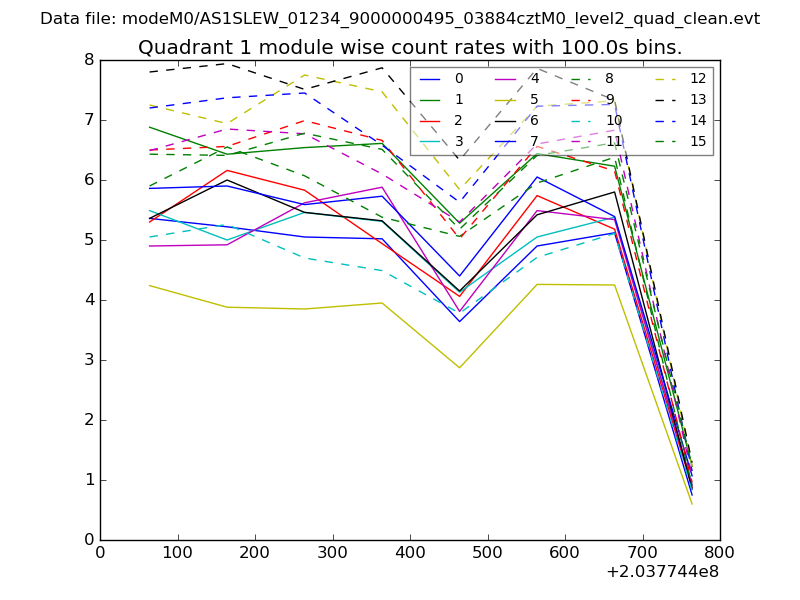
| Module-wise count rates for Quadrant A Data is divided into 100 sec bins |
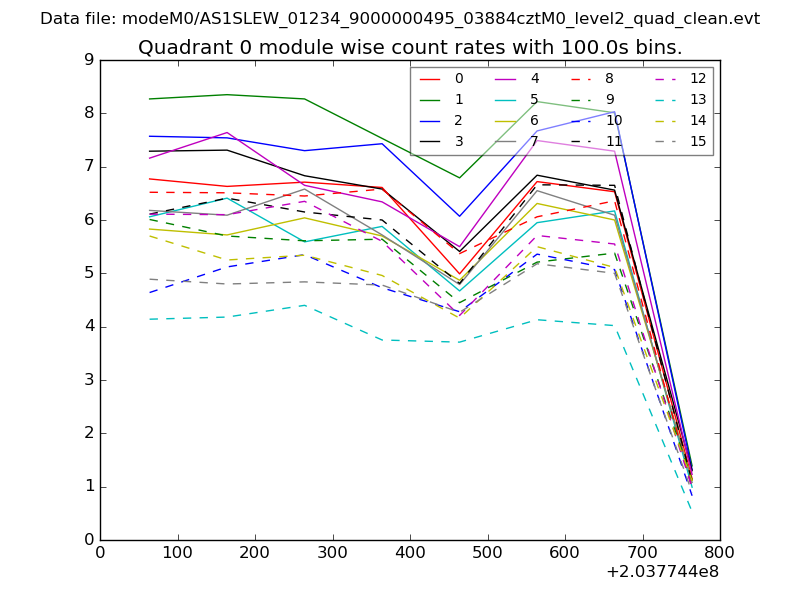 |
 |
| Module-wise count rates for Quadrant B Data is divided into 100 sec bins |
 |
 |
| Module-wise count rates for Quadrant C Data is divided into 100 sec bins |
 |
 |
| Module-wise count rates for Quadrant D Data is divided into 100 sec bins |
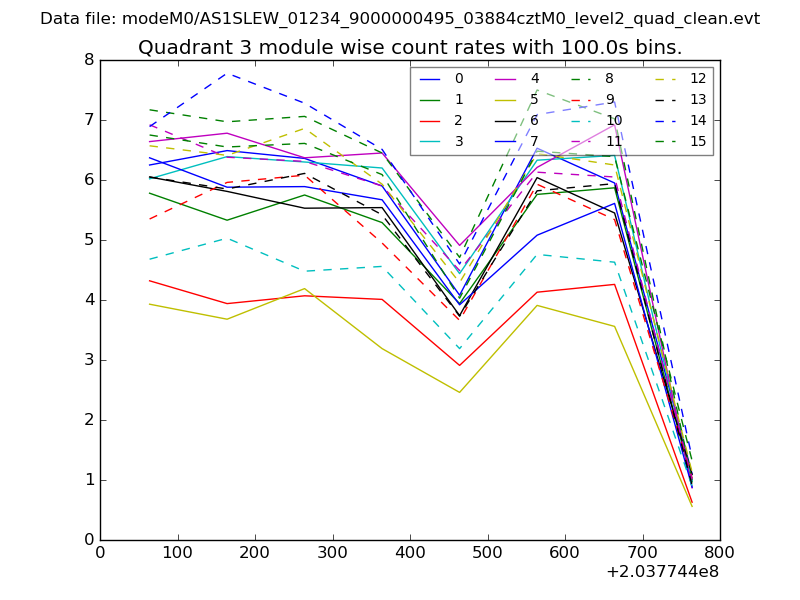 |
 |
| Parameter | Plot |
|---|---|
| CZT HV Monitor | 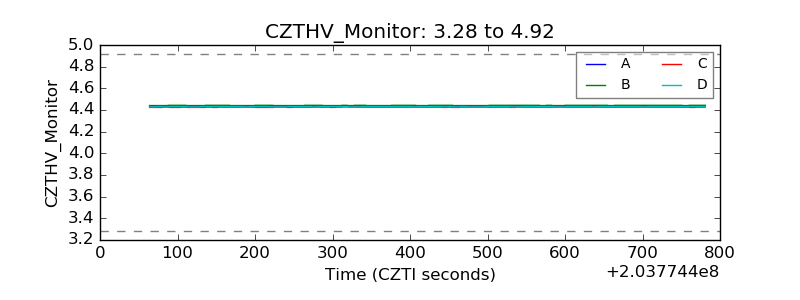 |
| D_VDD | 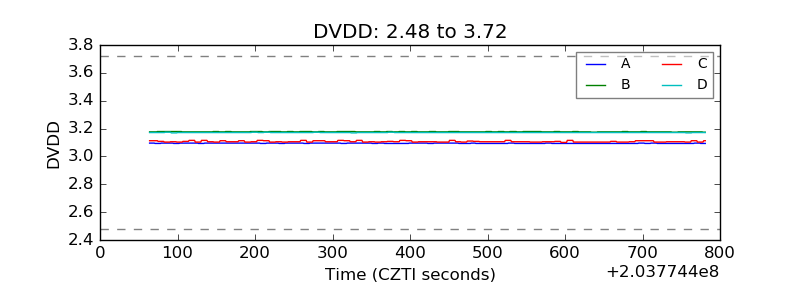 |
| Temperature 1 |  |
| Veto HV Monitor | 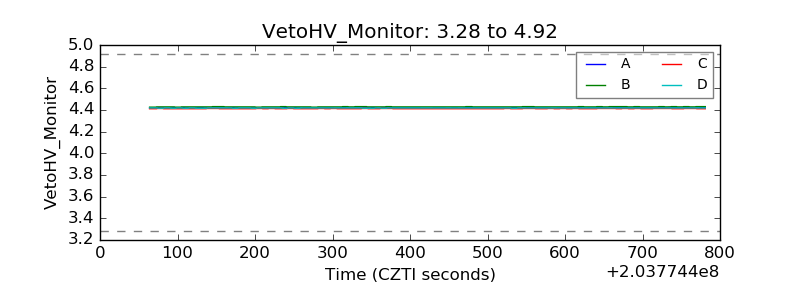 |
| Veto LLD | 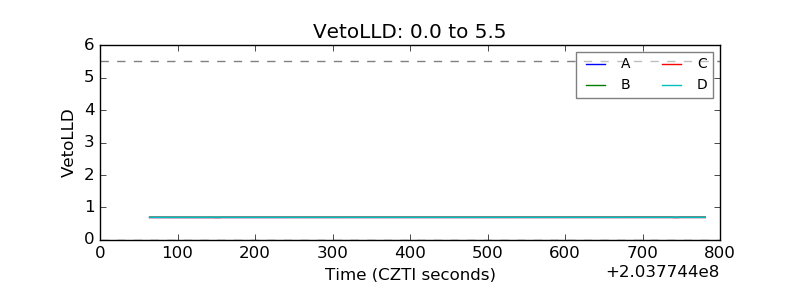 |
| Alpha Counter | 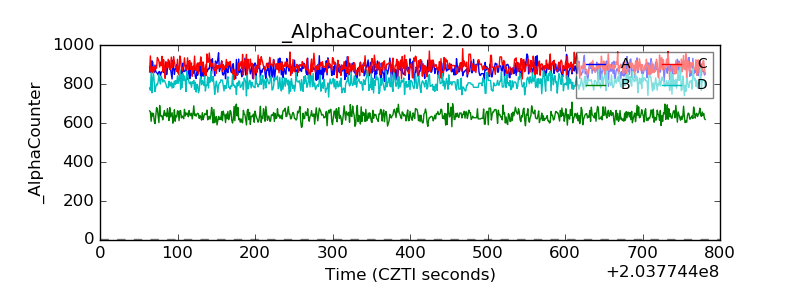 |
| _CPM_Rate | 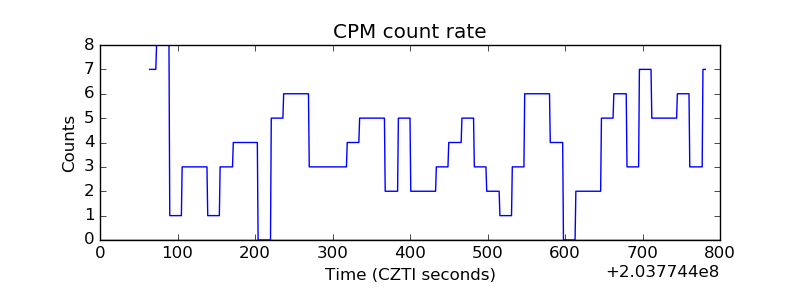 |
| CZT Counter | 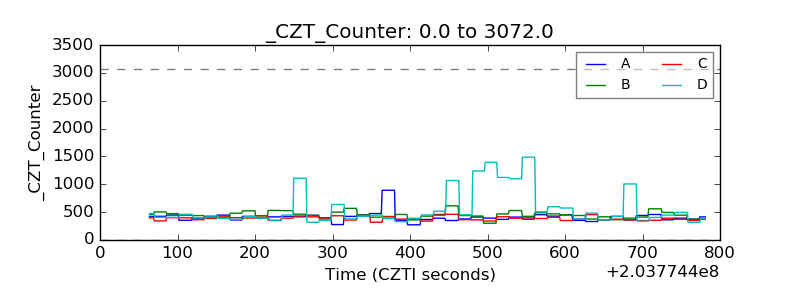 |
| +2.5 Volts monitor |  |
| +5 Volts monitor | 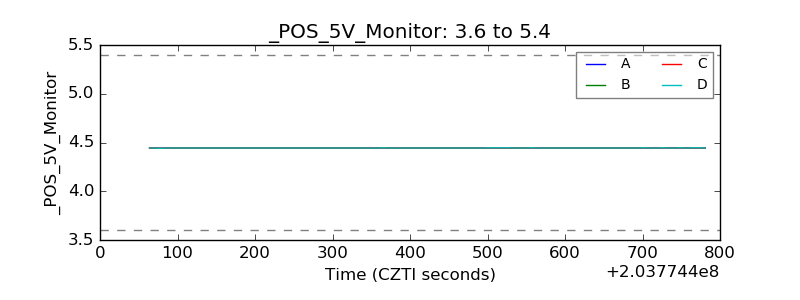 |
| Veto Counter |  |