| Param | Original file | Final file |
|---|---|---|
| Filename | modeM0/AS1G05_083T02_9000000498cztM0_level2.fits | modeM0/AS1G05_083T02_9000000498cztM0_level2_quad_clean.evt |
| Size (bytes) | 228,165,120 | 276,675,840 |
| Size | 217.6 MB | 263.9 MB |
| Events in quadrant A | 1,370,130 | 1,763,282 |
| Events in quadrant B | 1,315,472 | 1,726,707 |
| Events in quadrant C | 1,227,158 | 1,488,223 |
| Events in quadrant D | 1,159,876 | 1,566,203 |
| Mode M9 | |||
|---|---|---|---|
| Quadrant | BADHDUFLAG | Total packets | Discarded packets |
| A | 0 | 12 | 0 |
| B | 0 | 12 | 0 |
| C | 0 | 12 | 0 |
| D | 0 | 12 | 0 |
| Mode SS | |||
|---|---|---|---|
| Quadrant | BADHDUFLAG | Total packets | Discarded packets |
| A | 0 | 540 | 0 |
| B | 0 | 540 | 0 |
| C | 0 | 540 | 0 |
| D | 0 | 540 | 0 |
| Mode M0 | |||
|---|---|---|---|
| Quadrant | BADHDUFLAG | Total packets | Discarded packets |
| A | 0 | 57607 | 0 |
| B | 0 | 63012 | 0 |
| C | 0 | 84219 | 0 |
| D | 0 | 59005 | 0 |
| Quadrant | Total seconds | Saturated seconds | Saturation percentage |
|---|---|---|---|
| A | 26675 | 684 | 2.564199% |
| B | 26672 | 923 | 3.460558% |
| C | 26653 | 4201 | 15.761828% |
| D | 26674 | 616 | 2.309365% |
Noise dominated data is calculated using 1-second bins in cleaned event files. If a bin has >2000 counts, and if more than 50% of those come from <1% of pixels, then it is considered to be noise-dominated and hence unusable.
| Quadrant | # 1 sec bins | Bins with >0 counts | Bins with >2000 counts | High rate bins dominated by noise | Noise dominated (total time) | Noise dominated (detector-on time) | Marked lightcurve |
|---|---|---|---|---|---|---|---|
| A | 27427 | 26670 | 0 | 0 | 0.00% | 0.00% | 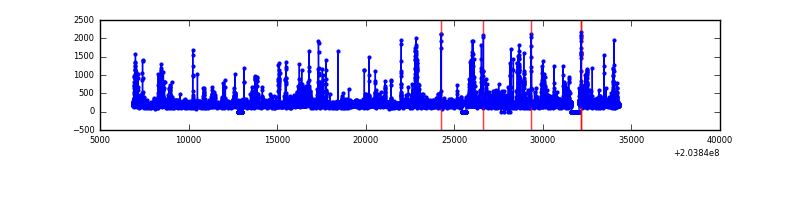 |
| B | 27427 | 26658 | 0 | 0 | 0.00% | 0.00% |  |
| C | 27427 | 26606 | 0 | 0 | 0.00% | 0.00% |  |
| D | 27427 | 26668 | 0 | 0 | 0.00% | 0.00% |  |
Top three noisy pixels from each quadrant. If the there are fewer than three noisy pixels in the level2.evt file, extra rows are filled as -1
| Pixel properties | Quadrant properties | ||||||
|---|---|---|---|---|---|---|---|
| Quadrant | DetID | PixID | Counts | Sigma | Mean | Median | Sigma |
| A | 0 | 29 | 1372 | 11.0 | 355 | 331 | 94.7 |
| A | 14 | 188 | 1370 | 10.98 | 355 | 331 | 94.7 |
| A | 14 | 204 | 1205 | 9.23 | 355 | 331 | 94.7 |
| B | 2 | 9 | 1111 | 10.76 | 348 | 332 | 72.4 |
| B | 12 | 226 | 992 | 9.12 | 348 | 332 | 72.4 |
| B | 14 | 254 | 954 | 8.59 | 348 | 332 | 72.4 |
| C | 1 | 80 | 944 | 7.33 | 323 | 298 | 88.2 |
| C | 1 | 81 | 918 | 7.03 | 323 | 298 | 88.2 |
| C | 12 | 241 | 903 | 6.86 | 323 | 298 | 88.2 |
| D | 3 | 14 | 926 | 6.91 | 331 | 300 | 90.5 |
| D | 3 | 31 | 910 | 6.74 | 331 | 300 | 90.5 |
| D | 3 | 30 | 866 | 6.25 | 331 | 300 | 90.5 |
Histogram calculated using DETX and DETY for each event in the final _common_clean file
| Quadrant A |  |
 |
Quadrant B |
|---|---|---|---|
| Quadrant D |  |
 |
Quadrant C |
| Plot type | Count rate plots | Images |
|---|---|---|
| Comparison with Poisson distribution Blue bars denote a histogram of data divided into 1 sec bins. Red curve is a Poisson curve with rate = median count rate of data. |
 |
 |
| Quadrant-wise count rates Data is divided into 100 sec bins |
 |
|
| Module-wise count rates for Quadrant A Data is divided into 100 sec bins |
 |
 |
| Module-wise count rates for Quadrant B Data is divided into 100 sec bins |
 |
 |
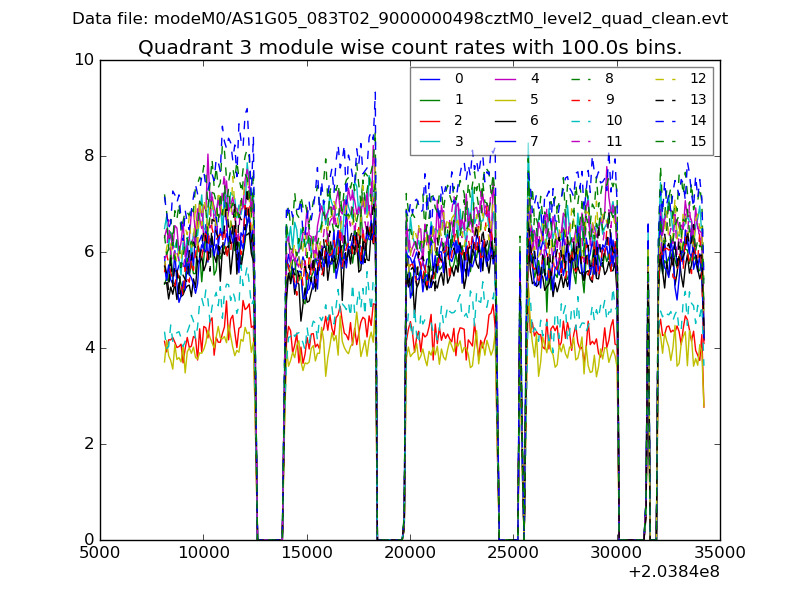
| Module-wise count rates for Quadrant C Data is divided into 100 sec bins |
 |
 |
| Module-wise count rates for Quadrant D Data is divided into 100 sec bins |
 |
 |
| Parameter | Plot |
|---|---|
| CZT HV Monitor | 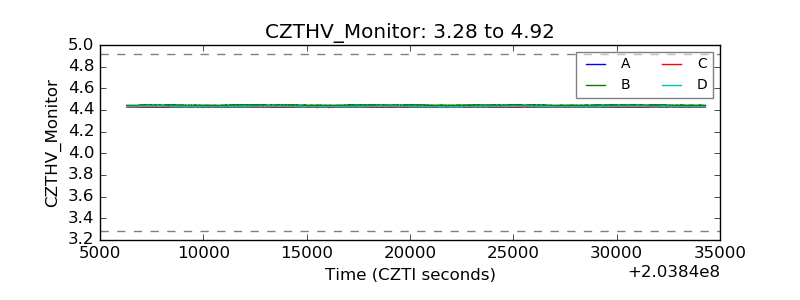 |
| D_VDD | 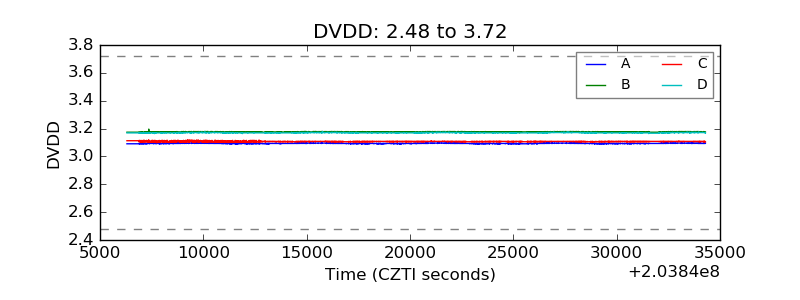 |
| Temperature 1 |  |
| Veto HV Monitor |  |
| Veto LLD | 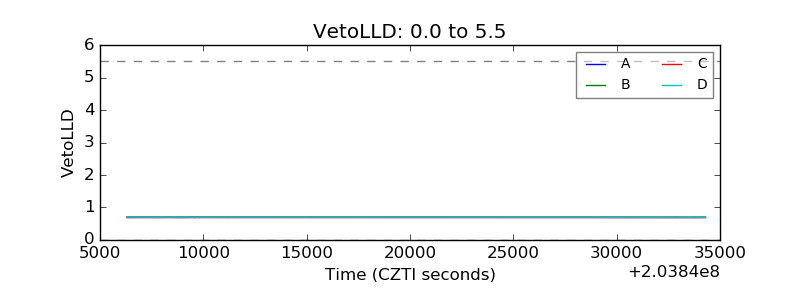 |
| Alpha Counter |  |
| _CPM_Rate |  |
| CZT Counter | 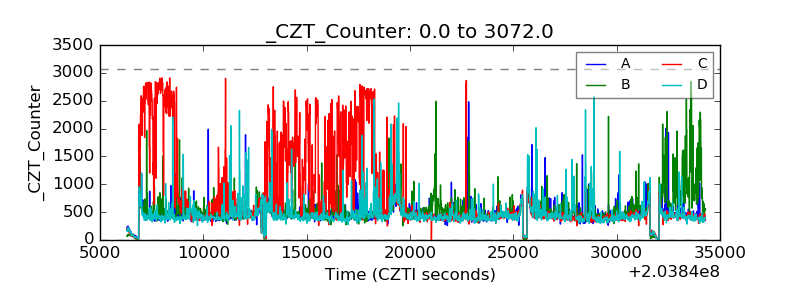 |
| +2.5 Volts monitor |  |
| +5 Volts monitor |  |
| _ROLL_ROT |  |
| _Roll_DEC | 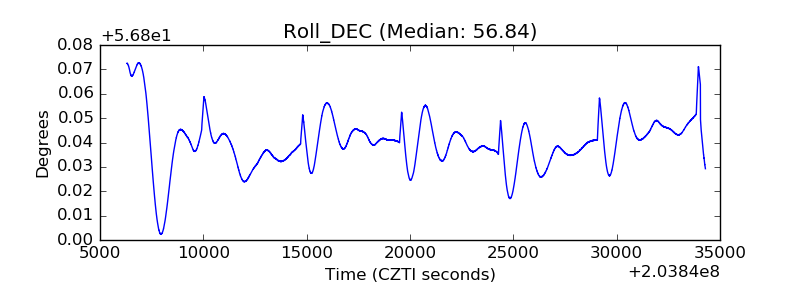 |
| _Roll_RA |  |
| Veto Counter | 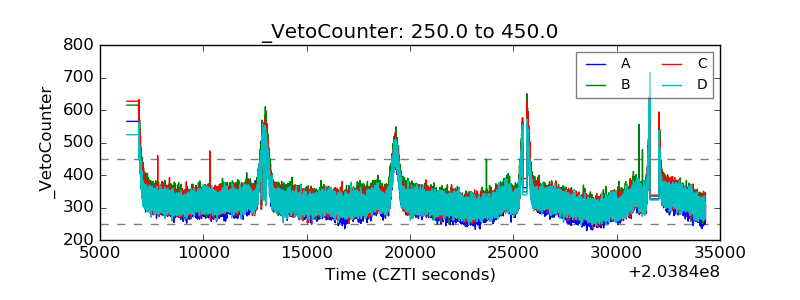 |