| Param | Original file | Final file |
|---|---|---|
| Filename | modeM0/AS1G05_083T02_9000000498_03896cztM0_level2.evt | modeM0/AS1G05_083T02_9000000498_03896cztM0_level2_quad_clean.evt |
| Size (bytes) | 199,776,960 | 6,517,440 |
| Size | 190.5 MB | 6.2 MB |
| Events in quadrant A | 749,847 | 25,047 |
| Events in quadrant B | 847,768 | 26,015 |
| Events in quadrant C | 3,625,502 | 9,229 |
| Events in quadrant D | 721,598 | 23,863 |
| Mode M9 | |||
|---|---|---|---|
| Quadrant | BADHDUFLAG | Total packets | Discarded packets |
| A | 0 | 6 | 0 |
| B | 0 | 6 | 0 |
| C | 0 | 6 | 0 |
| D | 0 | 6 | 0 |
| Mode SS | |||
|---|---|---|---|
| Quadrant | BADHDUFLAG | Total packets | Discarded packets |
| A | 0 | 30 | 0 |
| B | 0 | 30 | 0 |
| C | 0 | 30 | 0 |
| D | 0 | 30 | 0 |
| Mode M0 | |||
|---|---|---|---|
| Quadrant | BADHDUFLAG | Total packets | Discarded packets |
| A | 0 | 3309 | 2 |
| B | 0 | 3473 | 1 |
| C | 0 | 11804 | 1 |
| D | 0 | 3309 | 1 |
| Quadrant | Total seconds | Saturated seconds | Saturation percentage |
|---|---|---|---|
| A | 1517 | 80 | 5.273566% |
| B | 1517 | 76 | 5.009888% |
| C | 1517 | 1341 | 88.398154% |
| D | 1517 | 43 | 2.834542% |
Noise dominated data is calculated using 1-second bins in cleaned event files. If a bin has >2000 counts, and if more than 50% of those come from <1% of pixels, then it is considered to be noise-dominated and hence unusable.
| Quadrant | # 1 sec bins | Bins with >0 counts | Bins with >2000 counts | High rate bins dominated by noise | Noise dominated (total time) | Noise dominated (detector-on time) | Marked lightcurve |
|---|---|---|---|---|---|---|---|
| A | 1516 | 1516 | 4 | 4 | 0.26% | 0.26% | 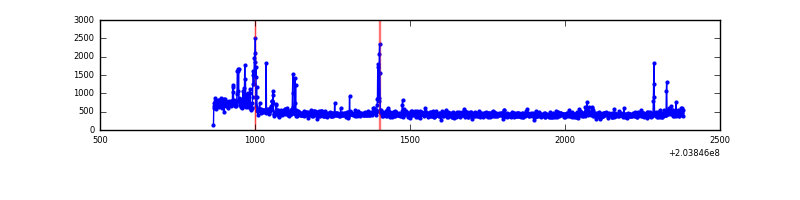 |
| B | 1516 | 1516 | 4 | 4 | 0.26% | 0.26% | 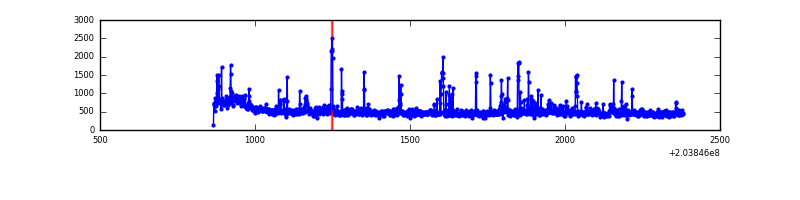 |
| C | 1516 | 1516 | 1280 | 1280 | 84.43% | 84.43% | 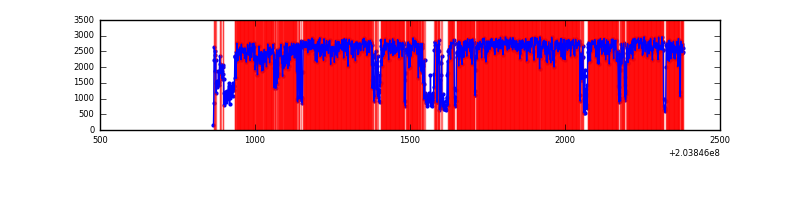 |
| D | 1516 | 1516 | 4 | 4 | 0.26% | 0.26% | 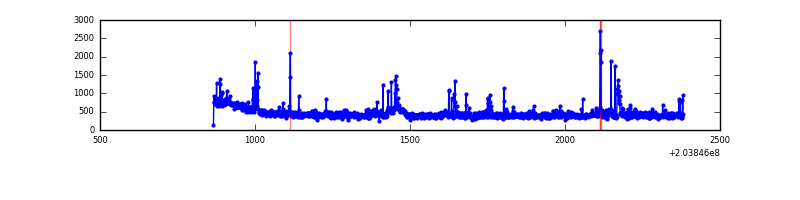 |
Top three noisy pixels from each quadrant. If the there are fewer than three noisy pixels in the level2.evt file, extra rows are filled as -1
| Pixel properties | Quadrant properties | ||||||
|---|---|---|---|---|---|---|---|
| Quadrant | DetID | PixID | Counts | Sigma | Mean | Median | Sigma |
| A | 0 | 118 | 56740 | 1474.55 | 175 | 171 | 38.4 |
| A | 0 | 226 | 7112 | 180.92 | 175 | 171 | 38.4 |
| A | 2 | 79 | 4791 | 120.42 | 175 | 171 | 38.4 |
| B | 7 | 221 | 99847 | 2722.11 | 179 | 175 | 36.6 |
| B | 4 | 81 | 30849 | 837.73 | 179 | 175 | 36.6 |
| B | 15 | 204 | 13642 | 367.79 | 179 | 175 | 36.6 |
| C | 2 | 53 | 3296308 | 159470.12 | 81 | 81 | 20.7 |
| C | 8 | 128 | 3222 | 151.96 | 81 | 81 | 20.7 |
| C | 8 | 112 | 1451 | 66.28 | 81 | 81 | 20.7 |
| D | 13 | 239 | 45837 | 1098.73 | 167 | 162 | 41.6 |
| D | 2 | 206 | 14262 | 339.18 | 167 | 162 | 41.6 |
| D | 2 | 16 | 10430 | 247.0 | 167 | 162 | 41.6 |
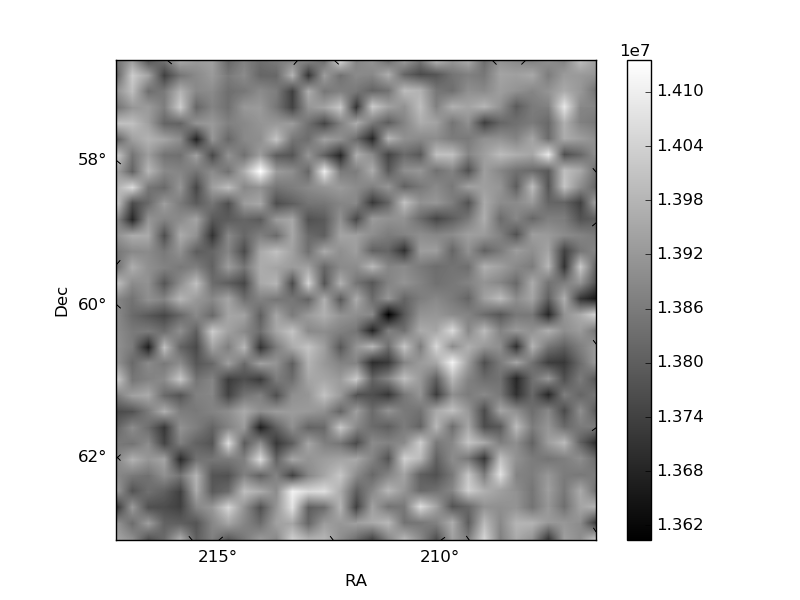
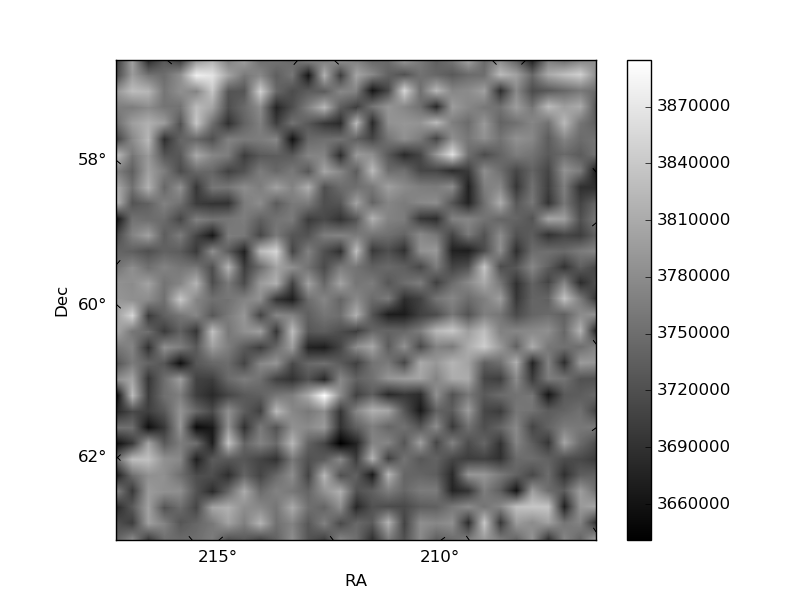
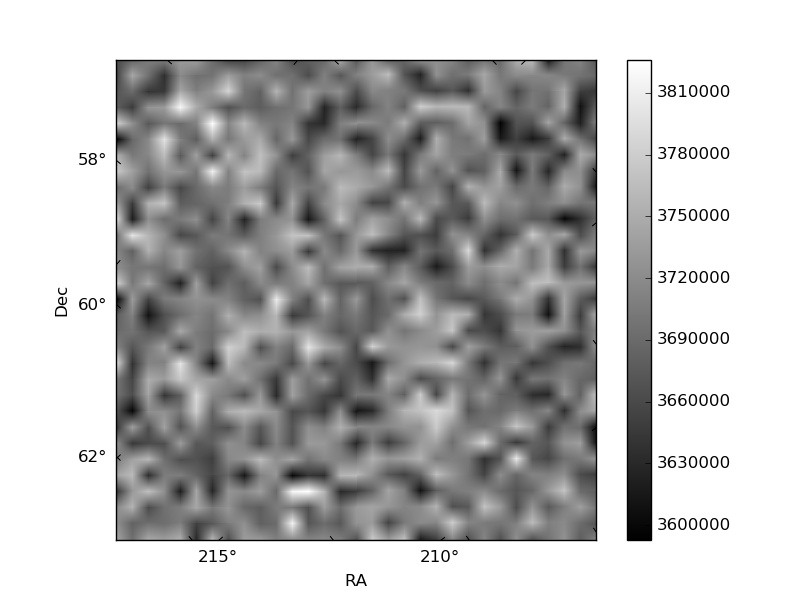
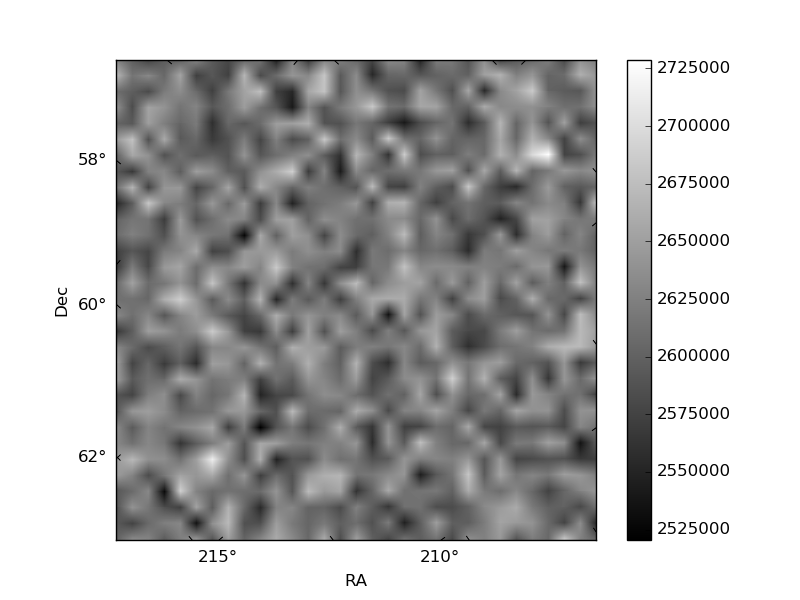
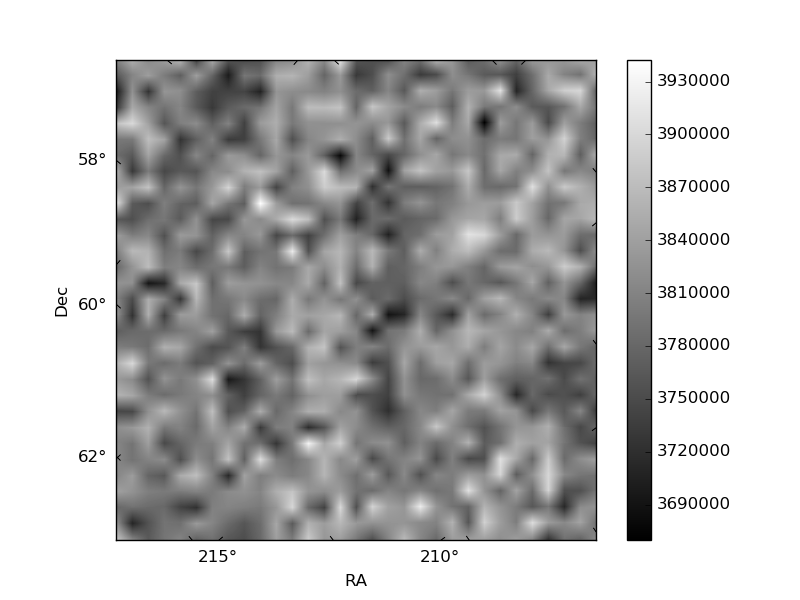
Histogram calculated using DETX and DETY for each event in the final _common_clean file
| Quadrant A | 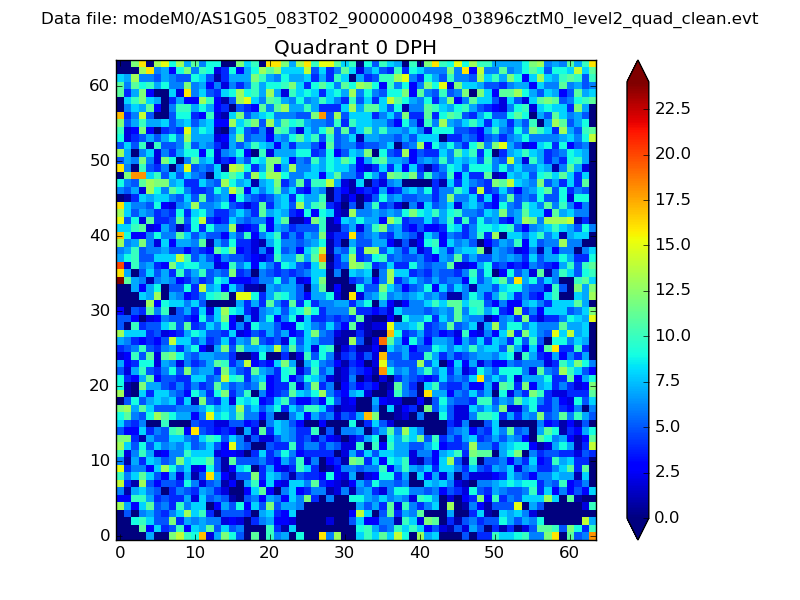 |
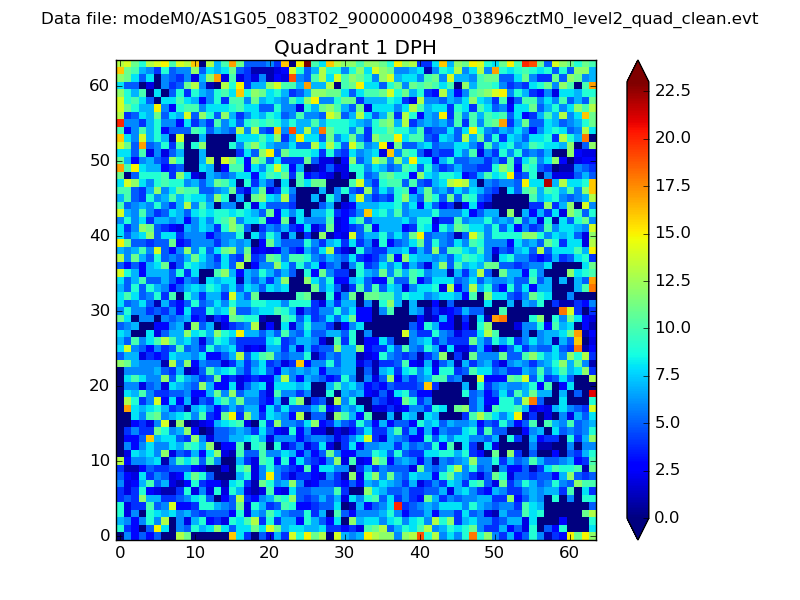 |
Quadrant B |
|---|---|---|---|
| Quadrant D | 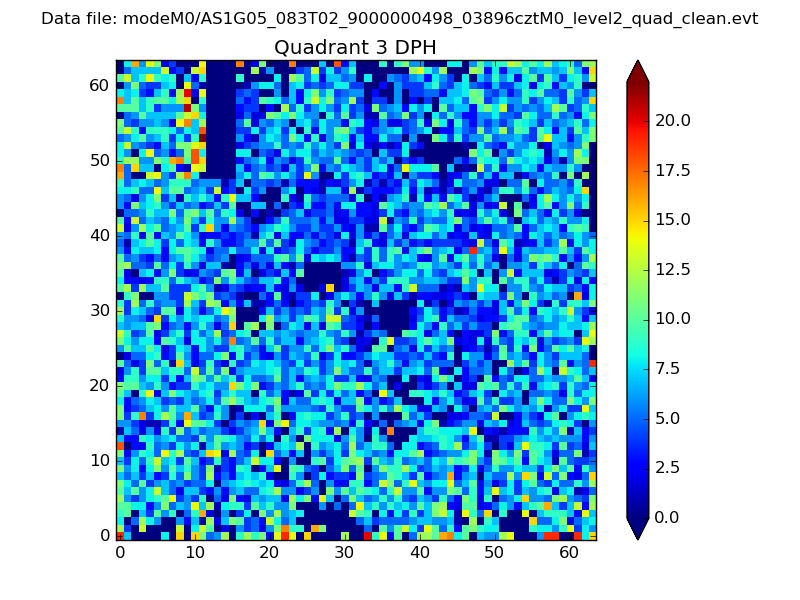 |
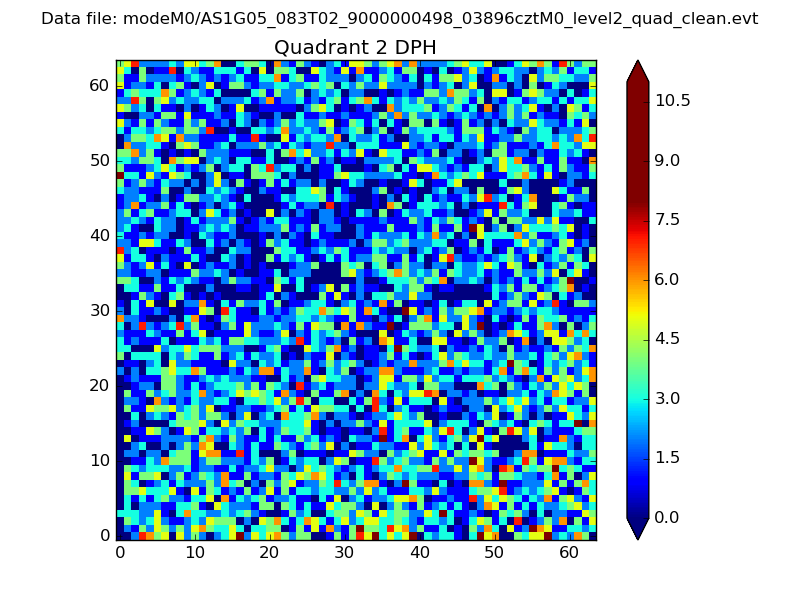 |
Quadrant C |
| Plot type | Count rate plots | Images |
|---|---|---|
| Comparison with Poisson distribution Blue bars denote a histogram of data divided into 1 sec bins. Red curve is a Poisson curve with rate = median count rate of data. |
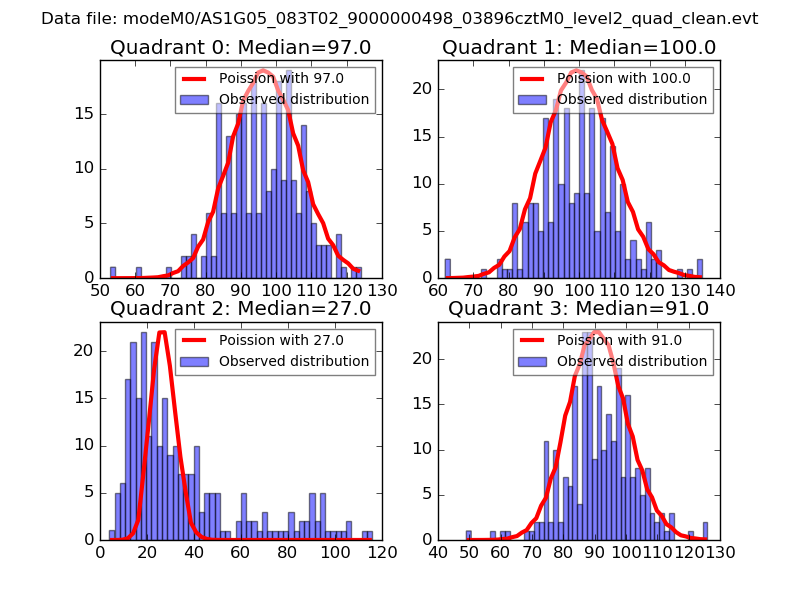 |
 |
| Quadrant-wise count rates Data is divided into 100 sec bins |
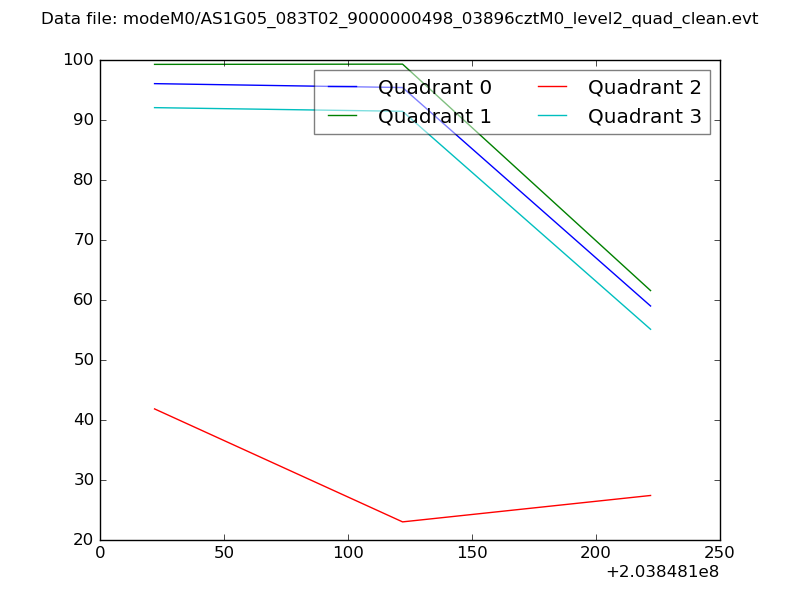 |
|
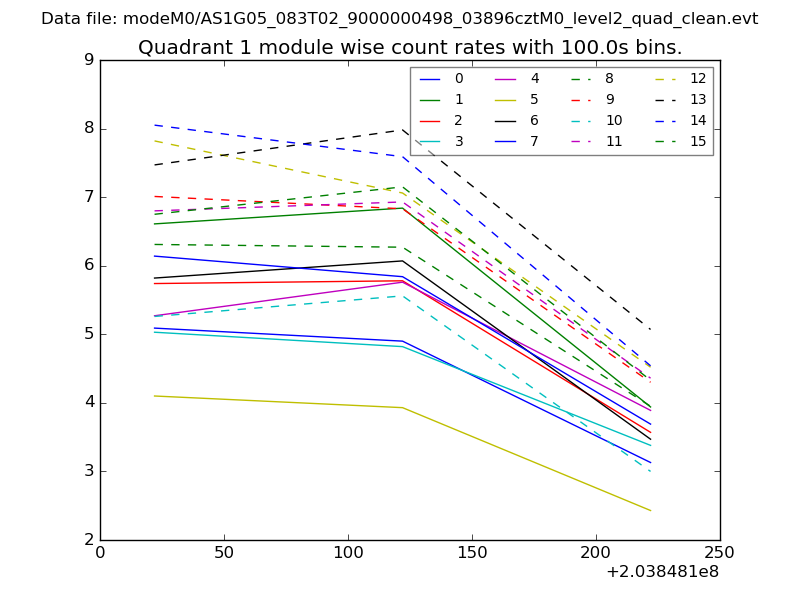
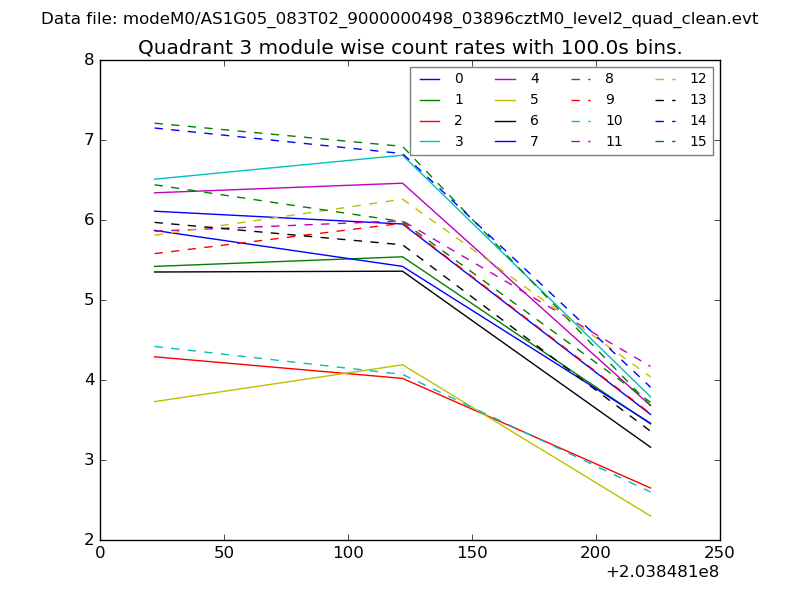
| Module-wise count rates for Quadrant A Data is divided into 100 sec bins |
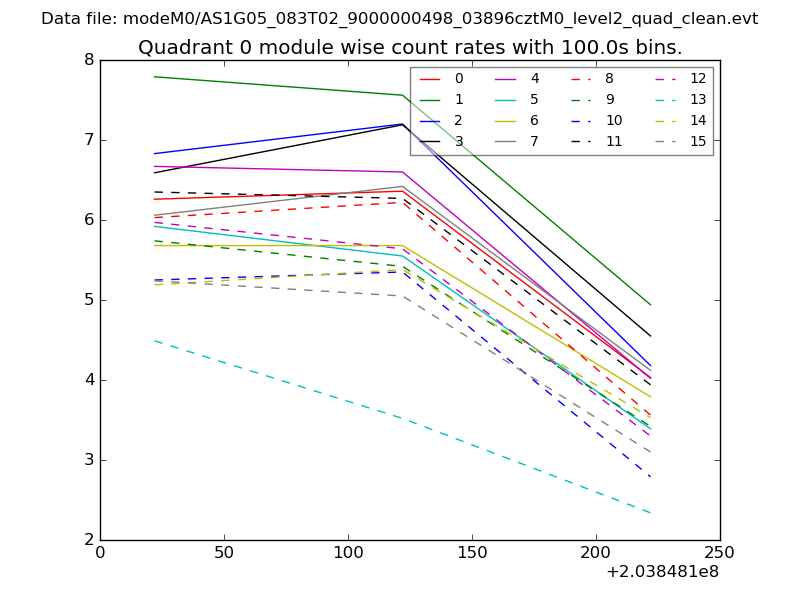 |
 |
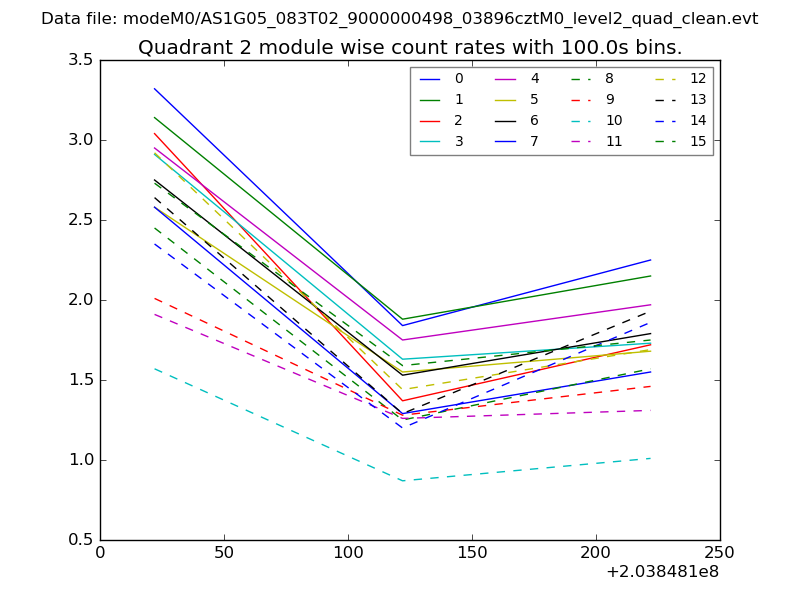
| Module-wise count rates for Quadrant B Data is divided into 100 sec bins |
 |
 |
| Module-wise count rates for Quadrant C Data is divided into 100 sec bins |
 |
 |
| Module-wise count rates for Quadrant D Data is divided into 100 sec bins |
 |
 |
| Parameter | Plot |
|---|---|
| CZT HV Monitor | 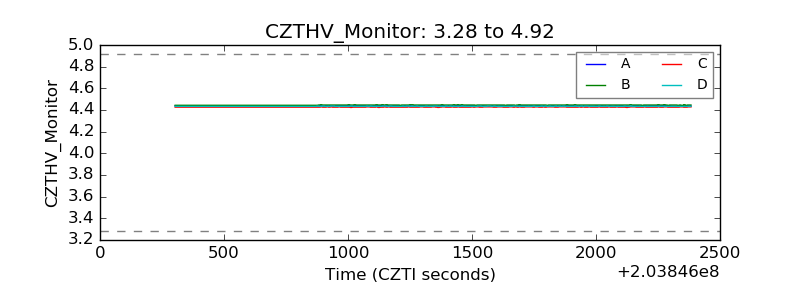 |
| D_VDD |  |
| Temperature 1 | 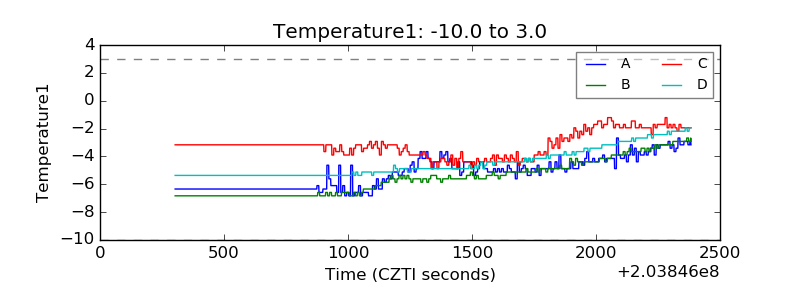 |
| Veto HV Monitor | 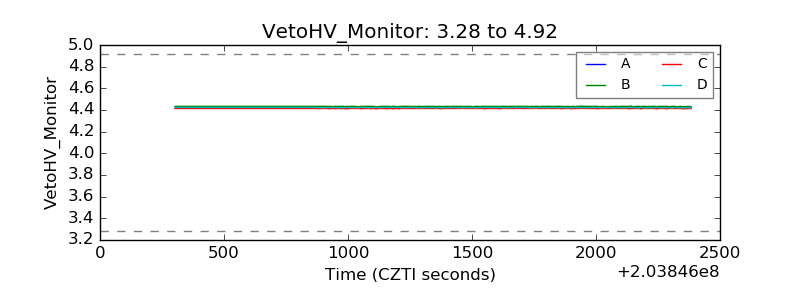 |
| Veto LLD | 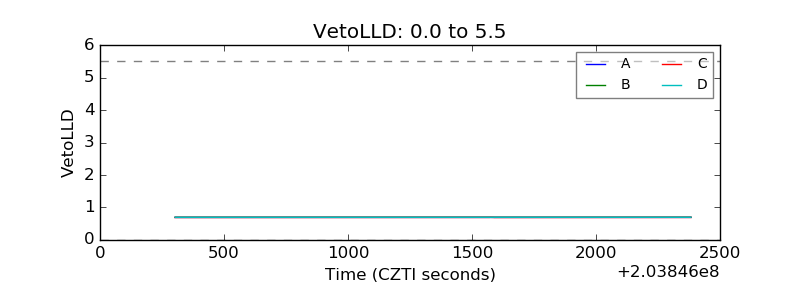 |
| Alpha Counter | 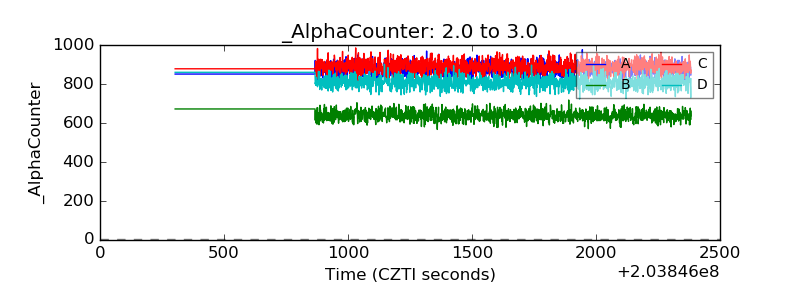 |
| _CPM_Rate | 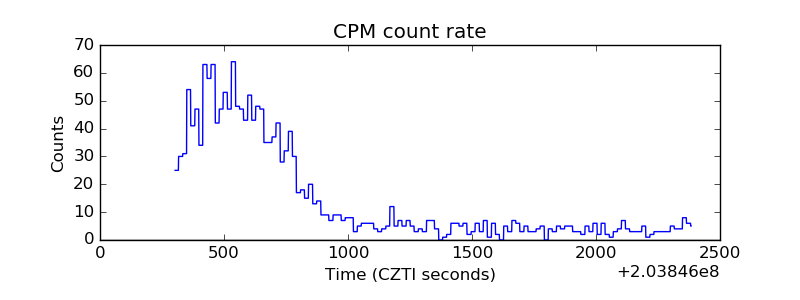 |
| CZT Counter | 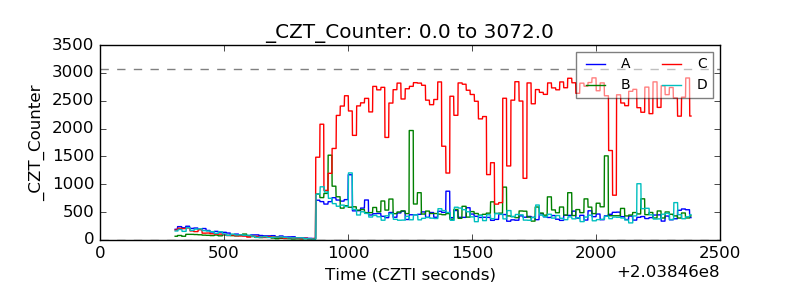 |
| +2.5 Volts monitor |  |
| +5 Volts monitor | 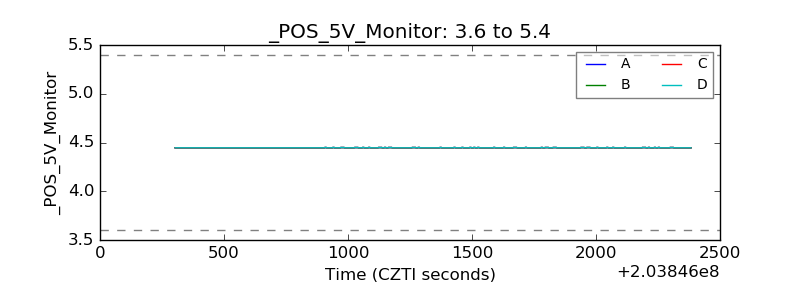 |
| Veto Counter | 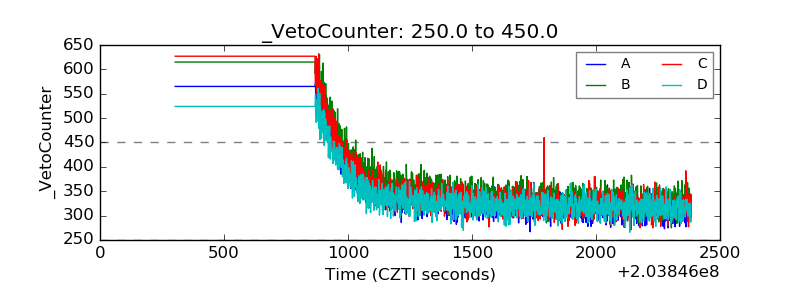 |