| Param | Original file | Final file |
|---|---|---|
| Filename | modeM0/AS1G05_083T02_9000000498_03897cztM0_level2.evt | modeM0/AS1G05_083T02_9000000498_03897cztM0_level2_quad_clean.evt |
| Size (bytes) | 665,982,720 | 86,040,000 |
| Size | 635.1 MB | 82.1 MB |
| Events in quadrant A | 3,479,210 | 541,003 |
| Events in quadrant B | 3,843,884 | 540,041 |
| Events in quadrant C | 8,560,827 | 486,418 |
| Events in quadrant D | 3,774,260 | 513,316 |
| Mode SS | |||
|---|---|---|---|
| Quadrant | BADHDUFLAG | Total packets | Discarded packets |
| A | 0 | 152 | 0 |
| B | 0 | 152 | 0 |
| C | 0 | 152 | 0 |
| D | 0 | 152 | 0 |
| Mode M0 | |||
|---|---|---|---|
| Quadrant | BADHDUFLAG | Total packets | Discarded packets |
| A | 0 | 15796 | 4 |
| B | 0 | 16339 | 3 |
| C | 0 | 30767 | 3 |
| D | 0 | 16917 | 3 |
| Quadrant | Total seconds | Saturated seconds | Saturation percentage |
|---|---|---|---|
| A | 7531 | 265 | 3.518789% |
| B | 7531 | 261 | 3.465675% |
| C | 7531 | 2163 | 28.721285% |
| D | 7531 | 241 | 3.200106% |
Noise dominated data is calculated using 1-second bins in cleaned event files. If a bin has >2000 counts, and if more than 50% of those come from <1% of pixels, then it is considered to be noise-dominated and hence unusable.
| Quadrant | # 1 sec bins | Bins with >0 counts | Bins with >2000 counts | High rate bins dominated by noise | Noise dominated (total time) | Noise dominated (detector-on time) | Marked lightcurve |
|---|---|---|---|---|---|---|---|
| A | 7640 | 7530 | 11 | 11 | 0.14% | 0.15% | 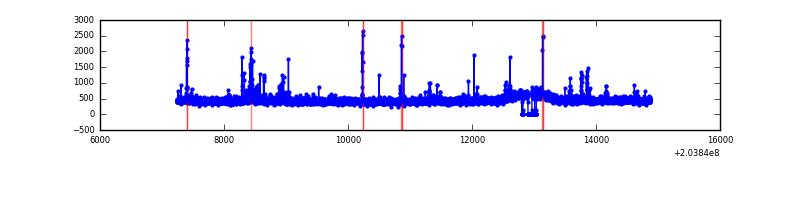 |
| B | 7640 | 7531 | 8 | 8 | 0.10% | 0.11% | 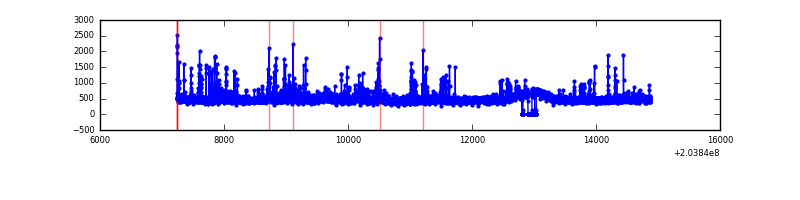 |
| C | 7640 | 7530 | 1607 | 1607 | 21.03% | 21.34% | 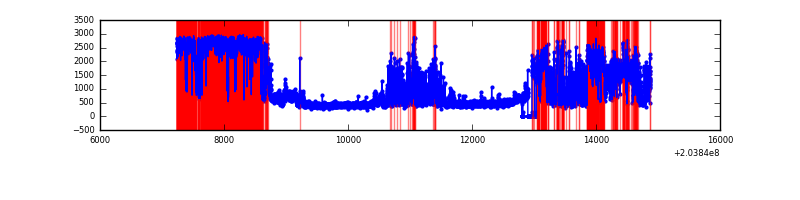 |
| D | 7640 | 7530 | 53 | 53 | 0.69% | 0.70% | 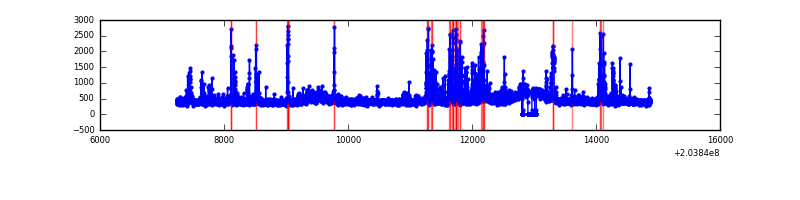 |
Top three noisy pixels from each quadrant. If the there are fewer than three noisy pixels in the level2.evt file, extra rows are filled as -1
| Pixel properties | Quadrant properties | ||||||
|---|---|---|---|---|---|---|---|
| Quadrant | DetID | PixID | Counts | Sigma | Mean | Median | Sigma |
| A | 0 | 118 | 93844 | 538.58 | 844 | 824 | 172.7 |
| A | 2 | 79 | 39751 | 225.39 | 844 | 824 | 172.7 |
| A | 15 | 174 | 24805 | 138.85 | 844 | 824 | 172.7 |
| B | 7 | 221 | 244688 | 1488.34 | 854 | 836 | 163.8 |
| B | 15 | 204 | 132297 | 802.37 | 854 | 836 | 163.8 |
| B | 4 | 81 | 79755 | 481.68 | 854 | 836 | 163.8 |
| C | 2 | 53 | 5757095 | 35216.39 | 705 | 706 | 163.5 |
| C | 8 | 128 | 13515 | 78.36 | 705 | 706 | 163.5 |
| C | 7 | 222 | 11107 | 63.63 | 705 | 706 | 163.5 |
| D | 12 | 233 | 331242 | 1669.09 | 814 | 786 | 198.0 |
| D | 1 | 20 | 63770 | 318.12 | 814 | 786 | 198.0 |
| D | 13 | 239 | 61241 | 305.35 | 814 | 786 | 198.0 |
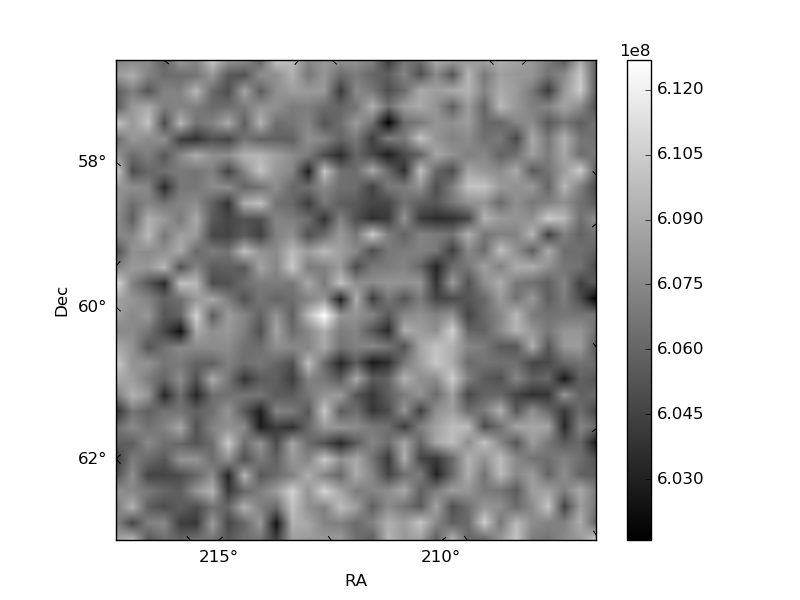
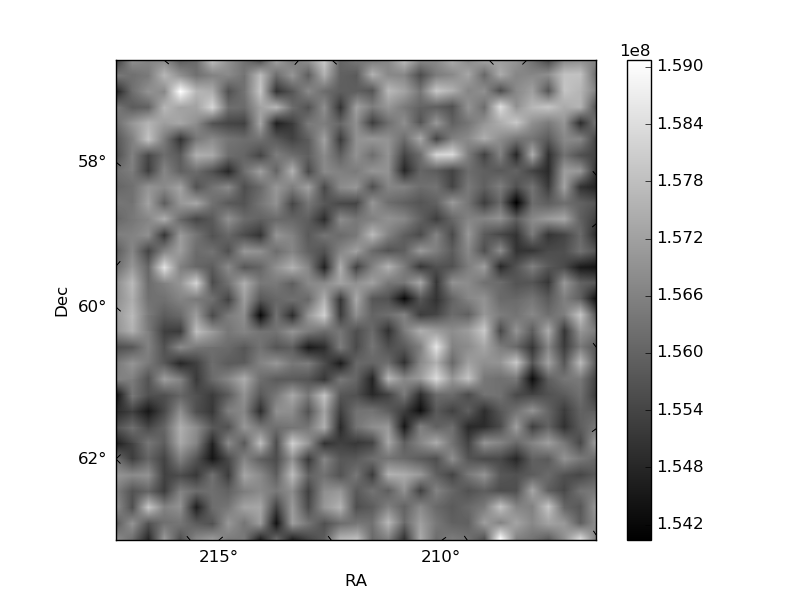
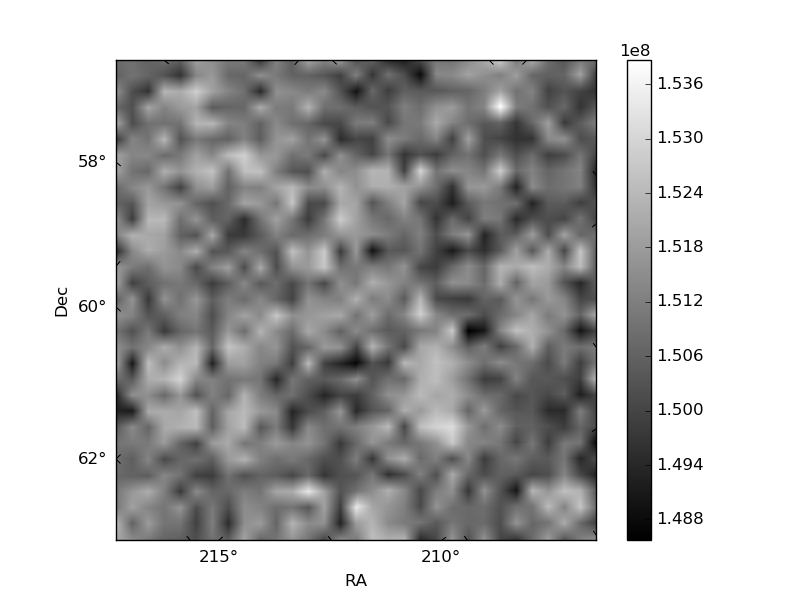
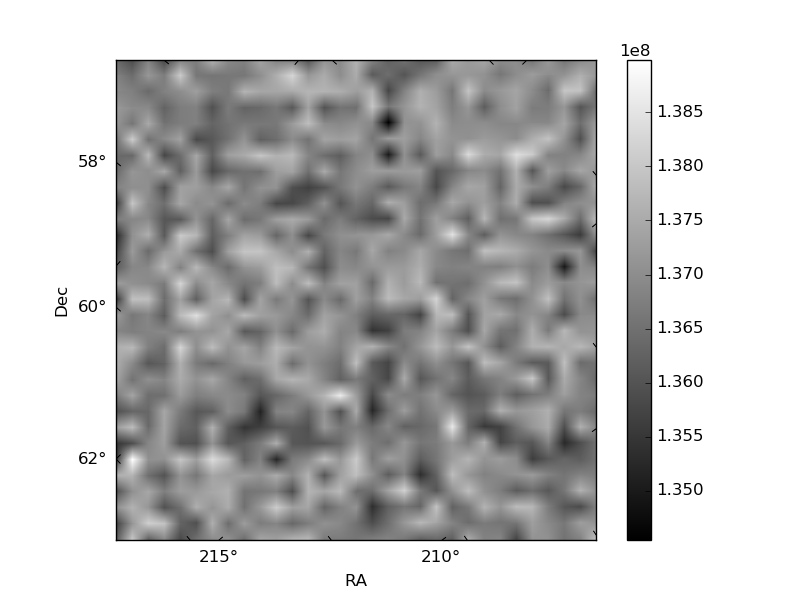
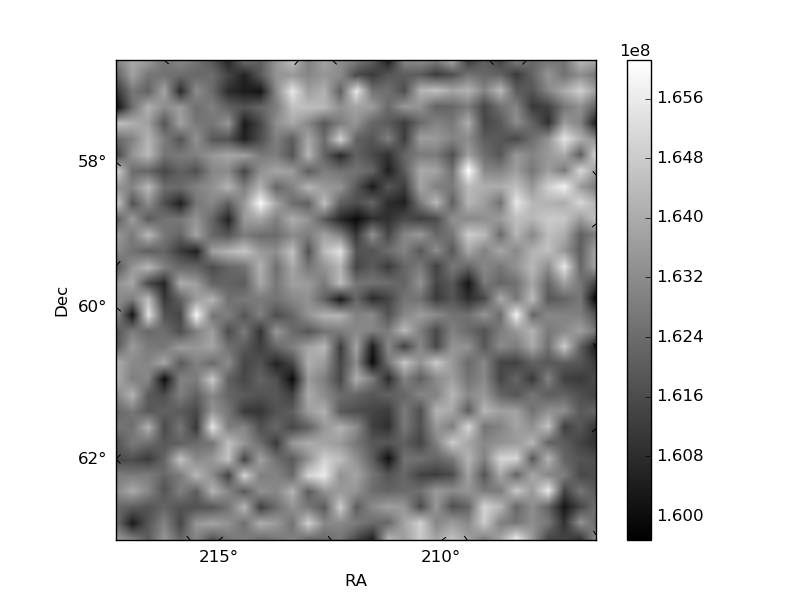
Histogram calculated using DETX and DETY for each event in the final _common_clean file
| Quadrant A | 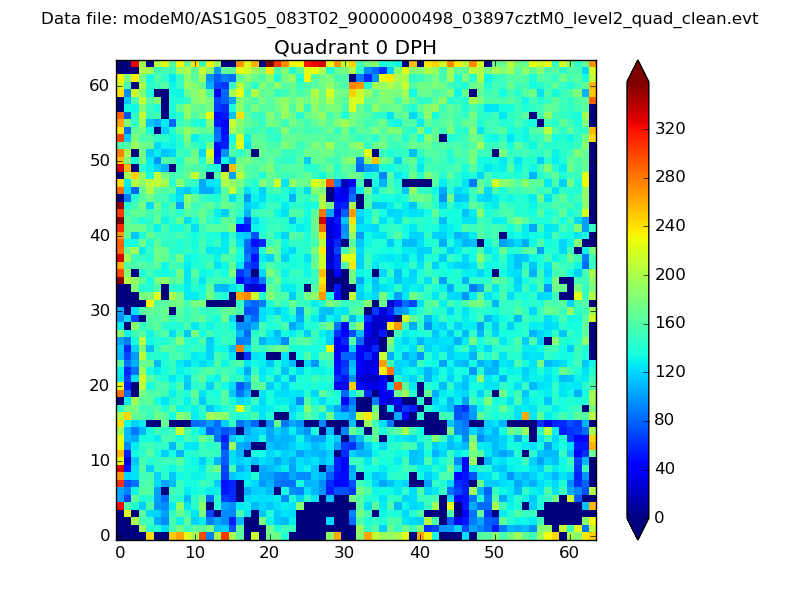 |
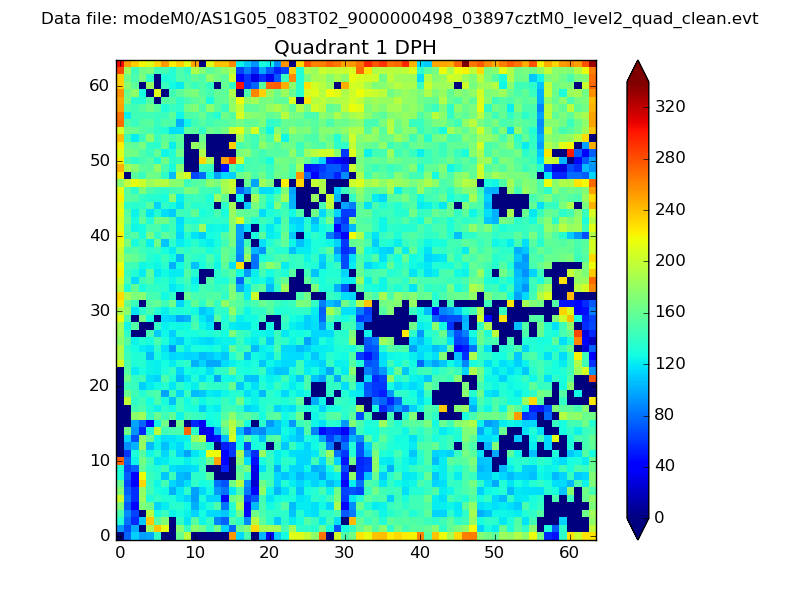 |
Quadrant B |
|---|---|---|---|
| Quadrant D | 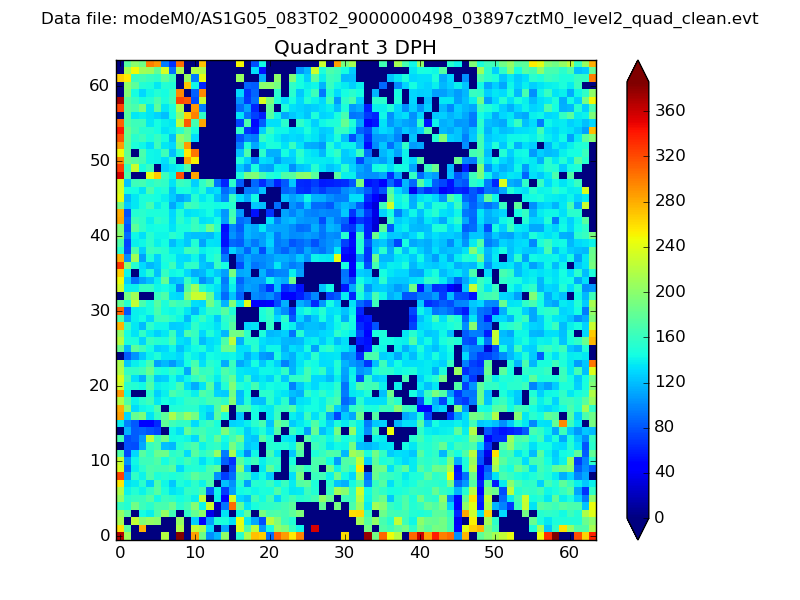 |
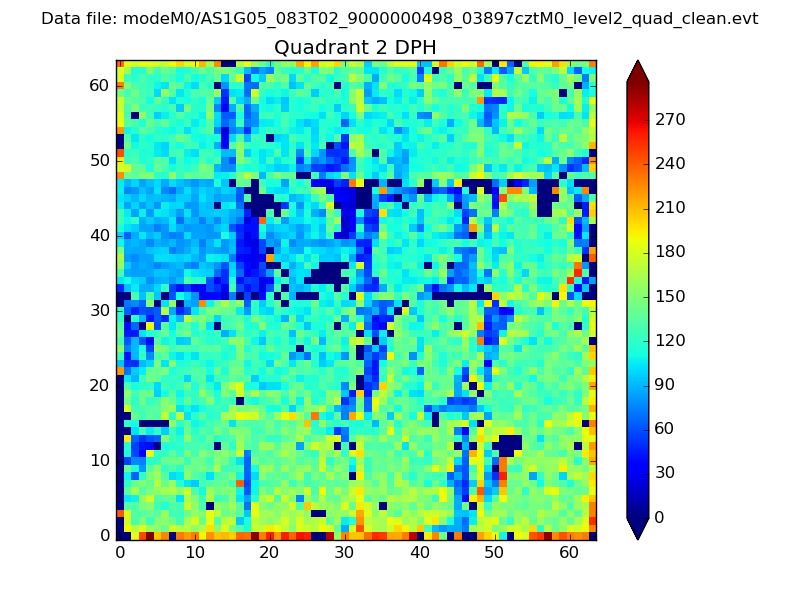 |
Quadrant C |
| Plot type | Count rate plots | Images |
|---|---|---|
| Comparison with Poisson distribution Blue bars denote a histogram of data divided into 1 sec bins. Red curve is a Poisson curve with rate = median count rate of data. |
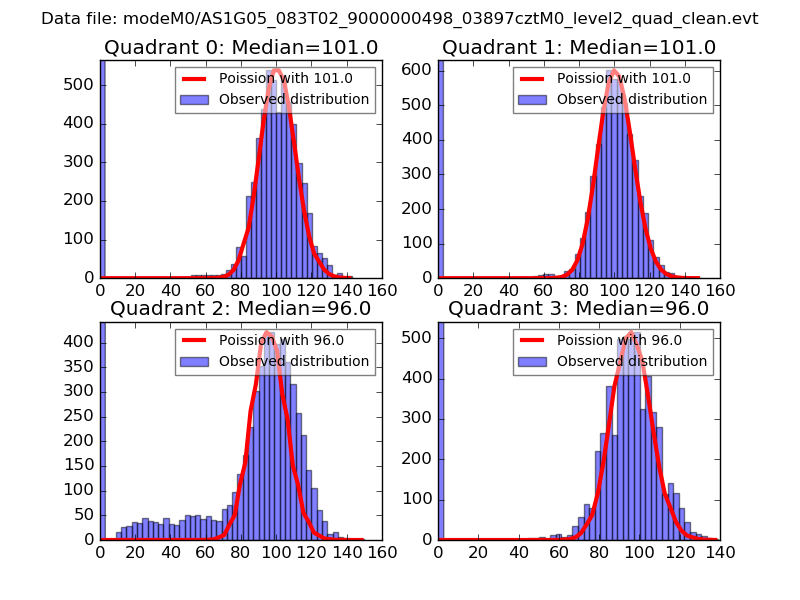 |
 |
| Quadrant-wise count rates Data is divided into 100 sec bins |
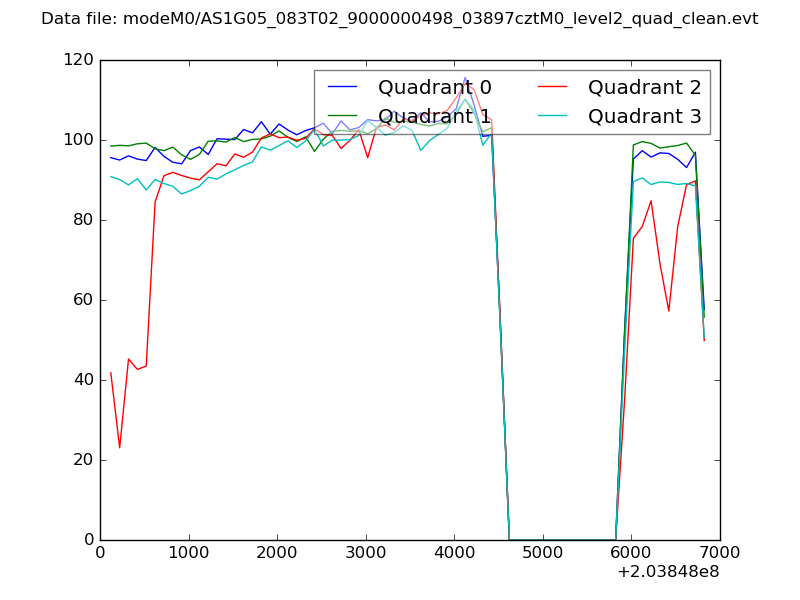 |
|
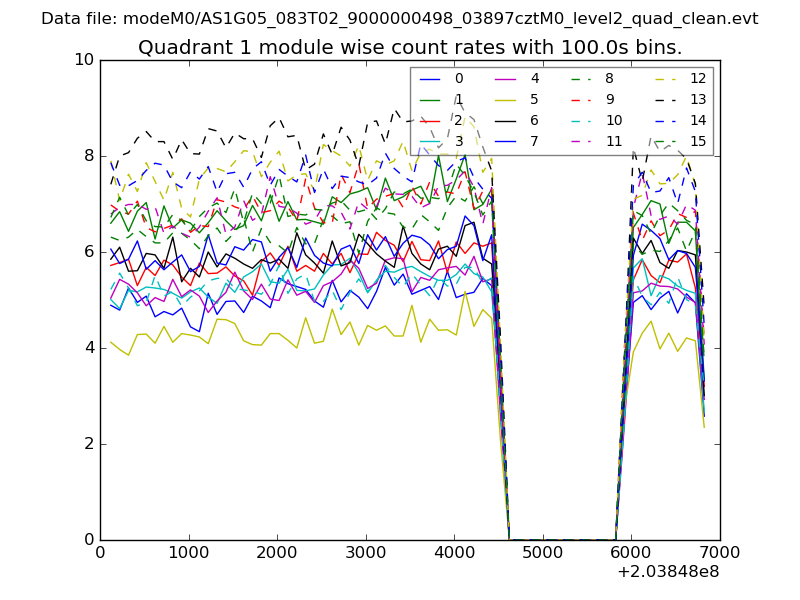
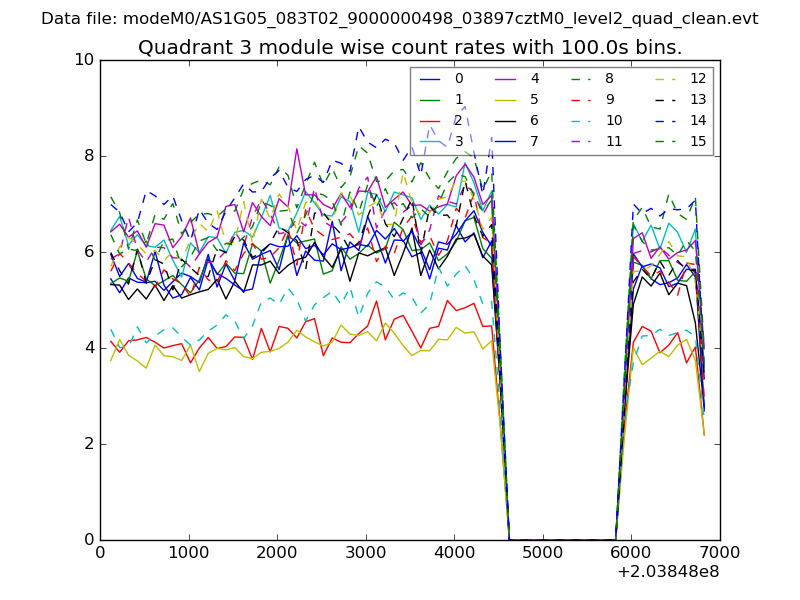
| Module-wise count rates for Quadrant A Data is divided into 100 sec bins |
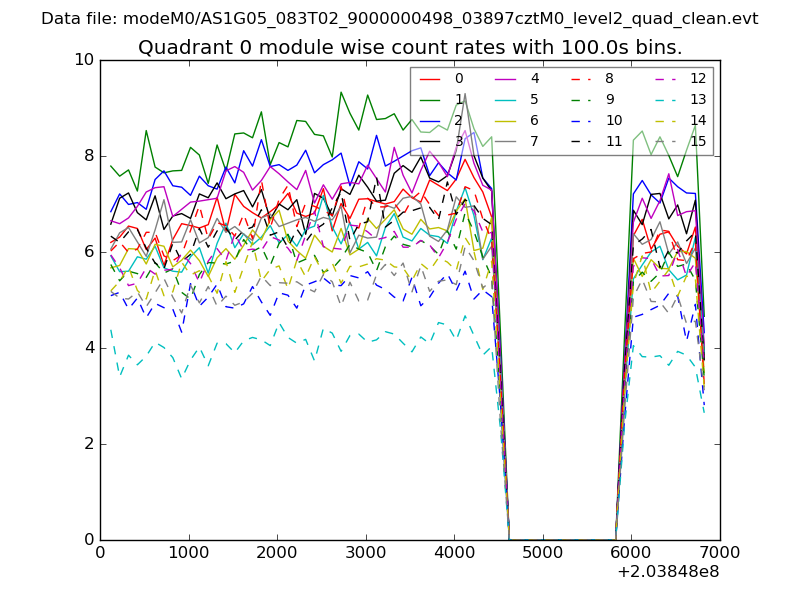 |
 |
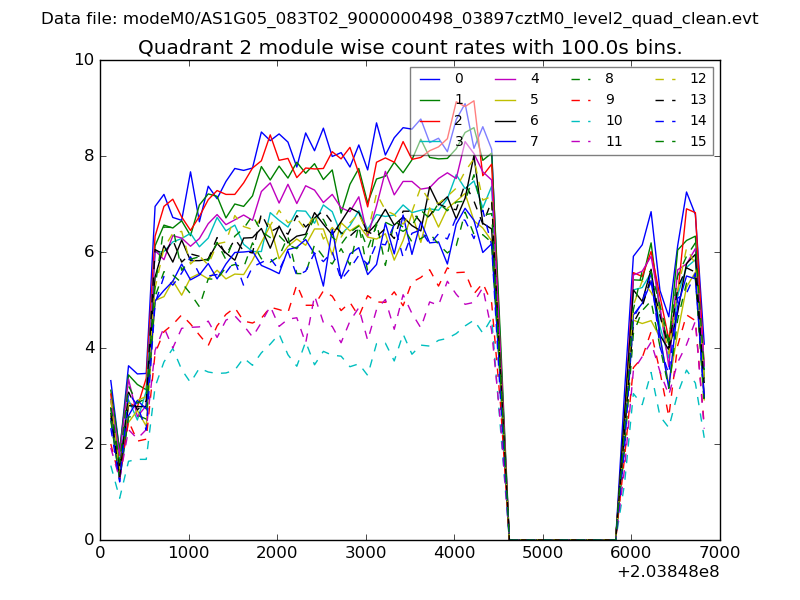
| Module-wise count rates for Quadrant B Data is divided into 100 sec bins |
 |
 |
| Module-wise count rates for Quadrant C Data is divided into 100 sec bins |
 |
 |
| Module-wise count rates for Quadrant D Data is divided into 100 sec bins |
 |
 |
| Parameter | Plot |
|---|---|
| CZT HV Monitor | 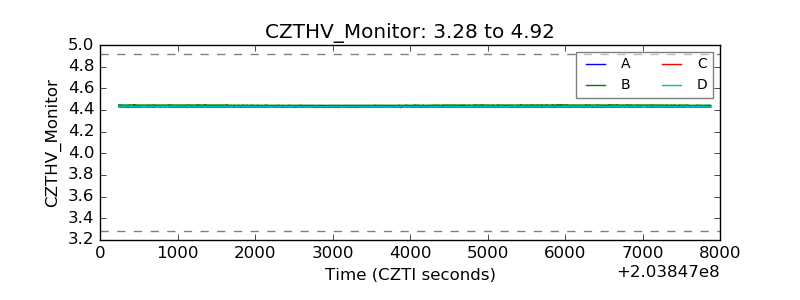 |
| D_VDD | 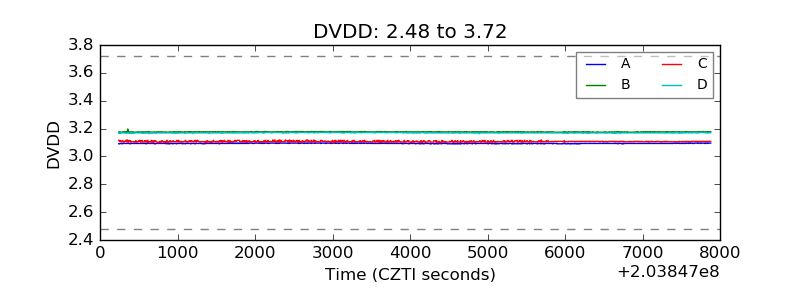 |
| Temperature 1 | 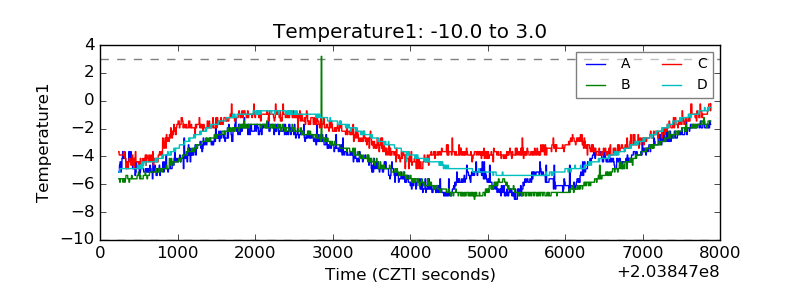 |
| Veto HV Monitor | 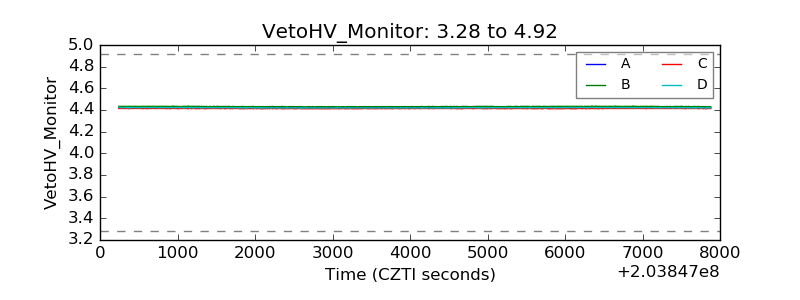 |
| Veto LLD |  |
| Alpha Counter | 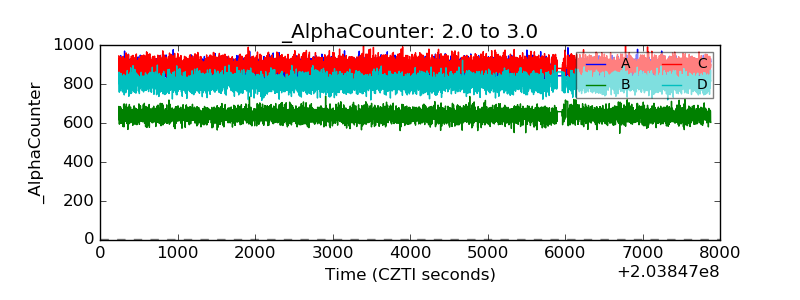 |
| _CPM_Rate | 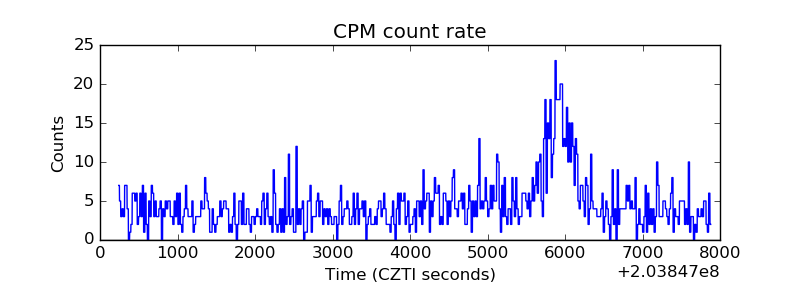 |
| CZT Counter | 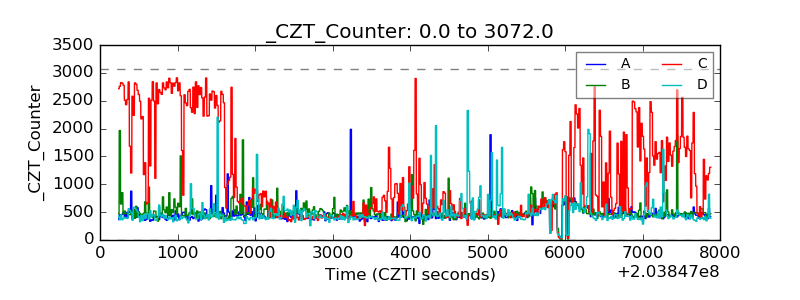 |
| +2.5 Volts monitor |  |
| +5 Volts monitor |  |
| Veto Counter | 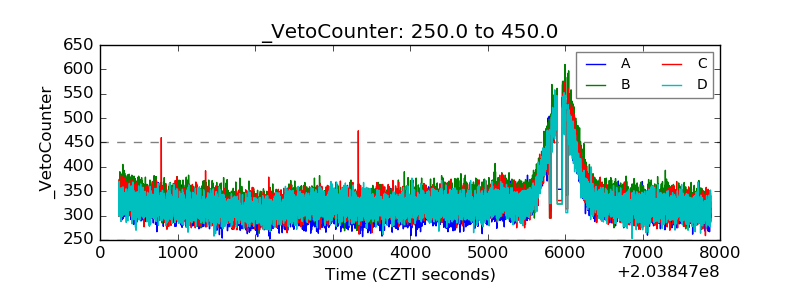 |