| Param | Original file | Final file |
|---|---|---|
| Filename | modeM0/AS1G05_083T02_9000000498_03898cztM0_level2.evt | modeM0/AS1G05_083T02_9000000498_03898cztM0_level2_quad_clean.evt |
| Size (bytes) | 666,760,320 | 87,442,560 |
| Size | 635.9 MB | 83.4 MB |
| Events in quadrant A | 3,553,405 | 568,774 |
| Events in quadrant B | 3,820,352 | 569,893 |
| Events in quadrant C | 8,627,696 | 453,009 |
| Events in quadrant D | 3,694,646 | 545,259 |
| Mode SS | |||
|---|---|---|---|
| Quadrant | BADHDUFLAG | Total packets | Discarded packets |
| A | 0 | 148 | 0 |
| B | 0 | 148 | 0 |
| C | 0 | 148 | 0 |
| D | 0 | 148 | 0 |
| Mode M0 | |||
|---|---|---|---|
| Quadrant | BADHDUFLAG | Total packets | Discarded packets |
| A | 0 | 15676 | 1 |
| B | 0 | 16126 | 0 |
| C | 0 | 30782 | 0 |
| D | 0 | 16609 | 0 |
| Quadrant | Total seconds | Saturated seconds | Saturation percentage |
|---|---|---|---|
| A | 7330 | 101 | 1.377899% |
| B | 7330 | 80 | 1.091405% |
| C | 7305 | 2096 | 28.692676% |
| D | 7330 | 158 | 2.155525% |
Noise dominated data is calculated using 1-second bins in cleaned event files. If a bin has >2000 counts, and if more than 50% of those come from <1% of pixels, then it is considered to be noise-dominated and hence unusable.
| Quadrant | # 1 sec bins | Bins with >0 counts | Bins with >2000 counts | High rate bins dominated by noise | Noise dominated (total time) | Noise dominated (detector-on time) | Marked lightcurve |
|---|---|---|---|---|---|---|---|
| A | 7329 | 7329 | 9 | 9 | 0.12% | 0.12% | 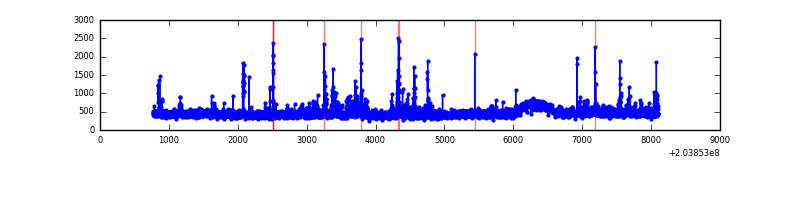 |
| B | 7329 | 7329 | 17 | 17 | 0.23% | 0.23% | 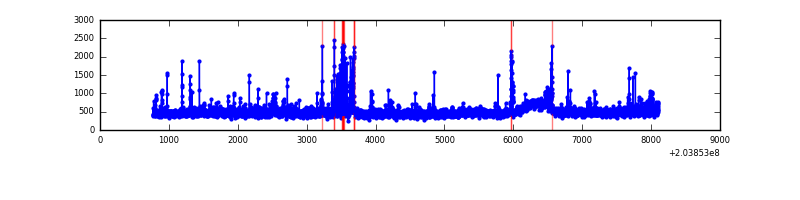 |
| C | 7329 | 7304 | 1705 | 1705 | 23.26% | 23.34% | 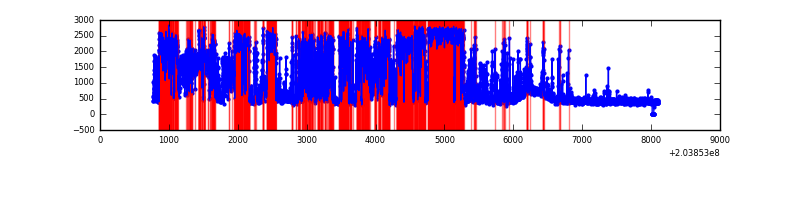 |
| D | 7329 | 7329 | 53 | 53 | 0.72% | 0.72% | 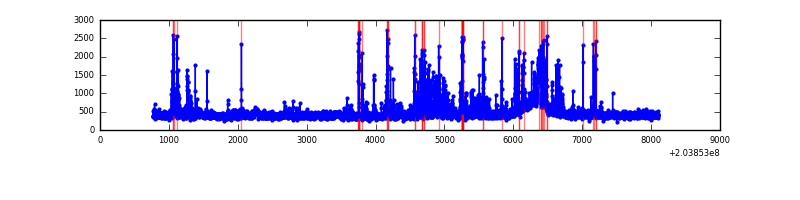 |
Top three noisy pixels from each quadrant. If the there are fewer than three noisy pixels in the level2.evt file, extra rows are filled as -1
| Pixel properties | Quadrant properties | ||||||
|---|---|---|---|---|---|---|---|
| Quadrant | DetID | PixID | Counts | Sigma | Mean | Median | Sigma |
| A | 8 | 15 | 138368 | 810.0 | 823 | 803 | 169.8 |
| A | 0 | 50 | 90830 | 530.09 | 823 | 803 | 169.8 |
| A | 0 | 118 | 72625 | 422.9 | 823 | 803 | 169.8 |
| B | 15 | 204 | 242966 | 1512.23 | 829 | 808 | 160.1 |
| B | 7 | 221 | 225982 | 1406.17 | 829 | 808 | 160.1 |
| B | 4 | 81 | 44724 | 274.25 | 829 | 808 | 160.1 |
| C | 2 | 53 | 5881293 | 36170.54 | 697 | 697 | 162.6 |
| C | 12 | 4 | 19701 | 116.89 | 697 | 697 | 162.6 |
| C | 13 | 61 | 5791 | 31.33 | 697 | 697 | 162.6 |
| D | 12 | 233 | 223523 | 1166.54 | 792 | 765 | 191.0 |
| D | 13 | 248 | 180161 | 939.46 | 792 | 765 | 191.0 |
| D | 10 | 246 | 60778 | 314.28 | 792 | 765 | 191.0 |
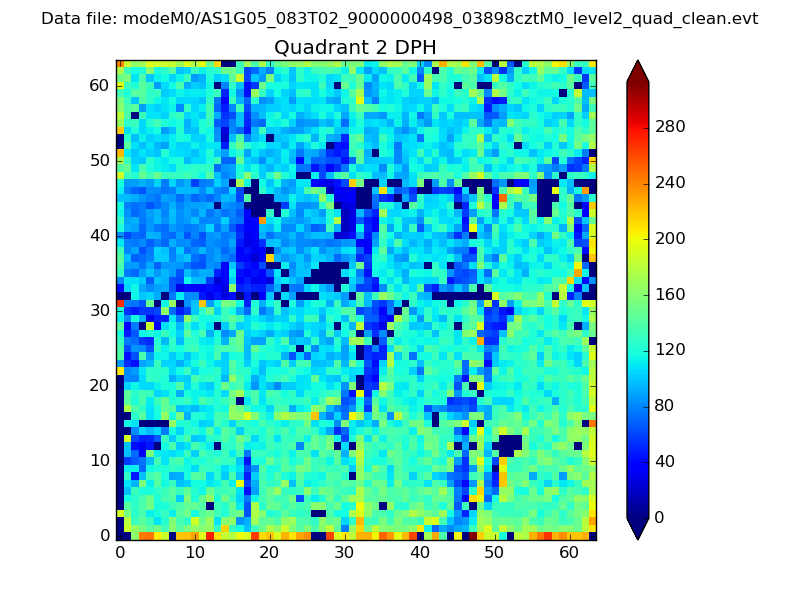
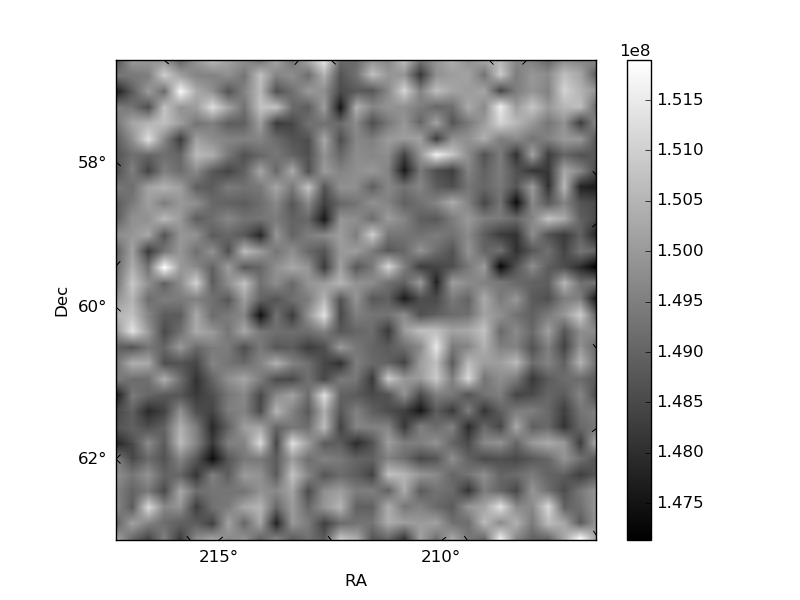
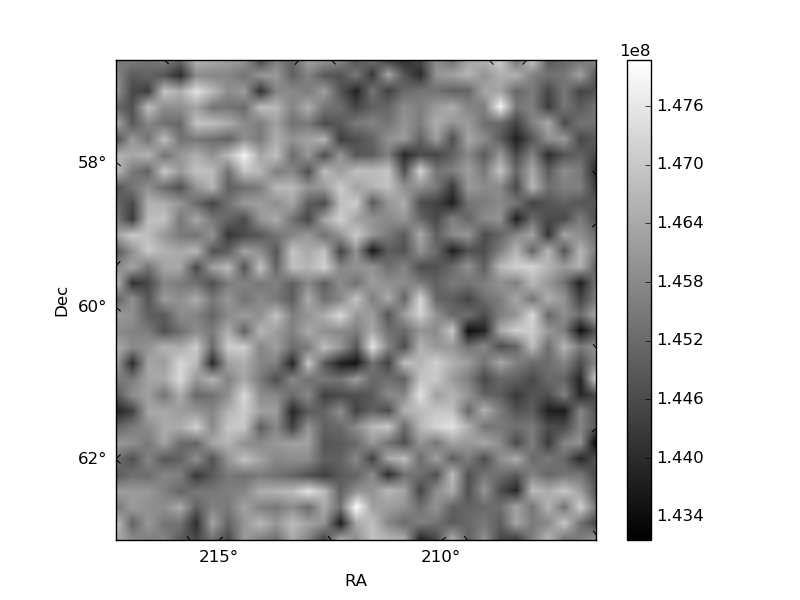
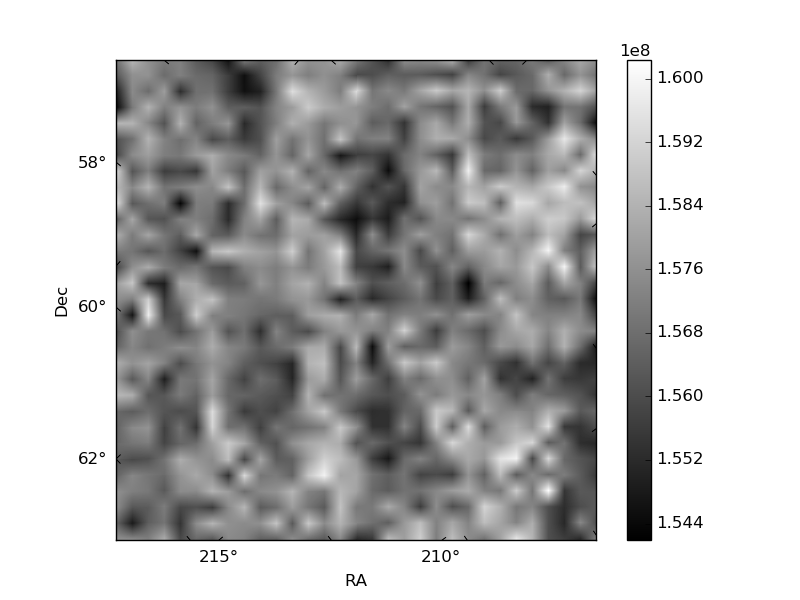
Histogram calculated using DETX and DETY for each event in the final _common_clean file
| Quadrant A | 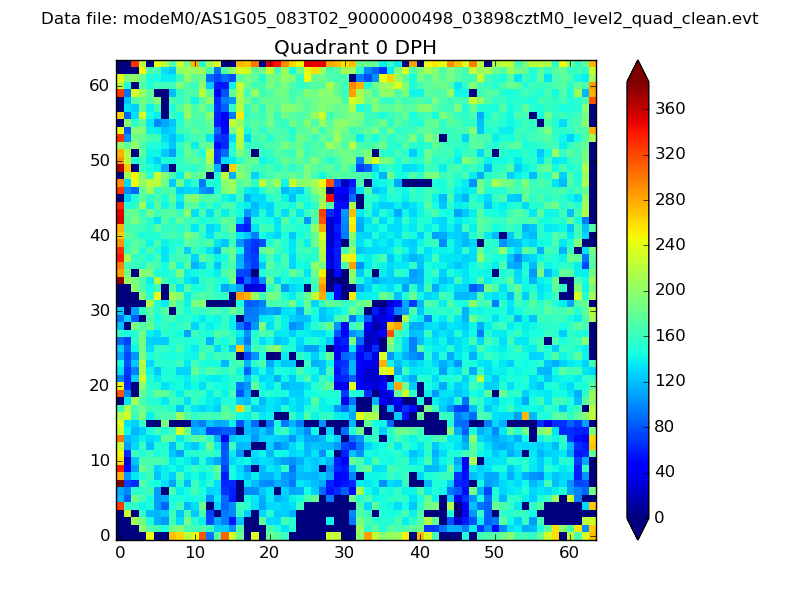 |
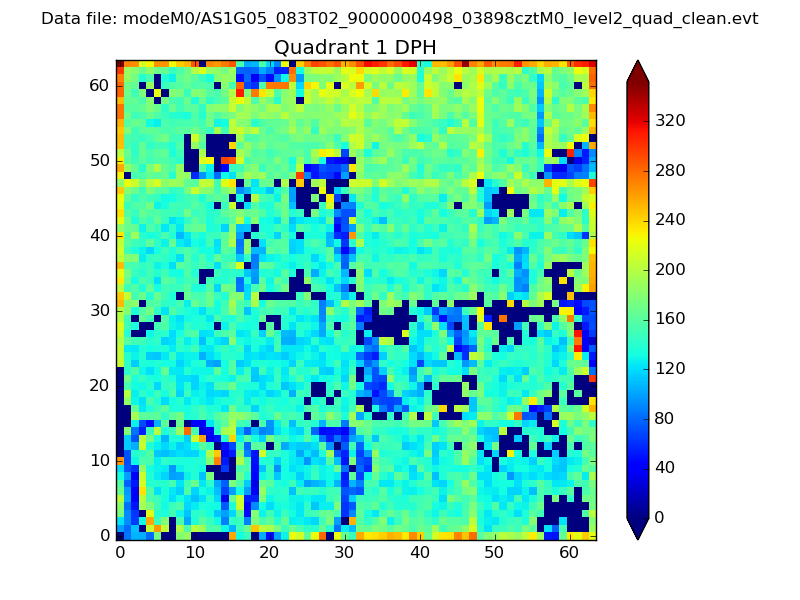 |
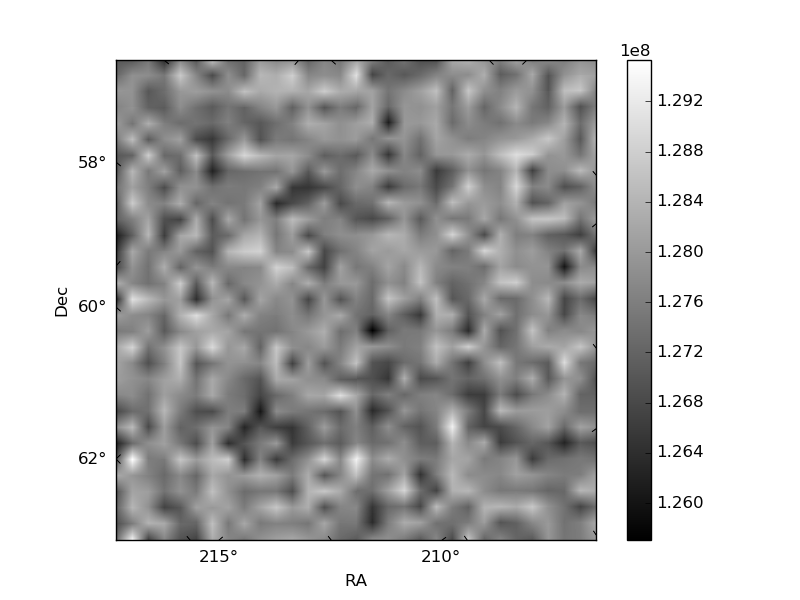
Quadrant B |
|---|---|---|---|
| Quadrant D | 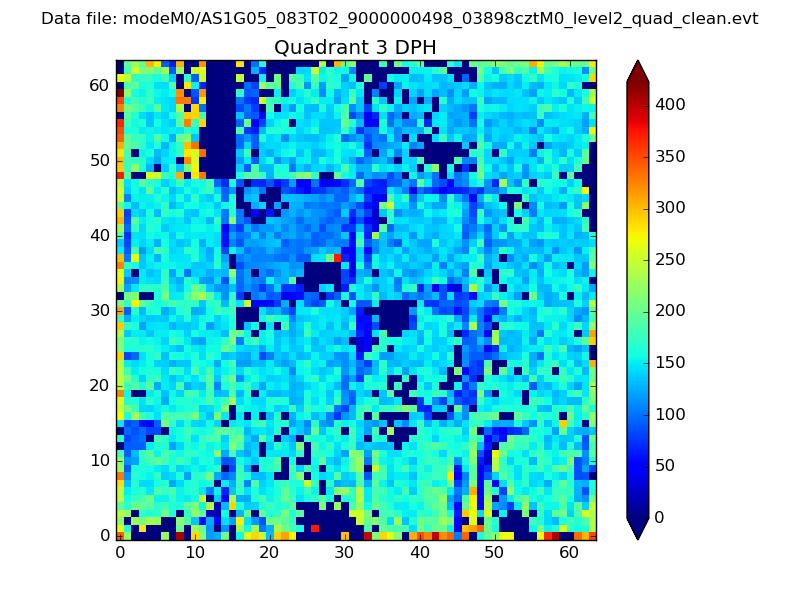 |
 |
Quadrant C |
| Plot type | Count rate plots | Images |
|---|---|---|
| Comparison with Poisson distribution Blue bars denote a histogram of data divided into 1 sec bins. Red curve is a Poisson curve with rate = median count rate of data. |
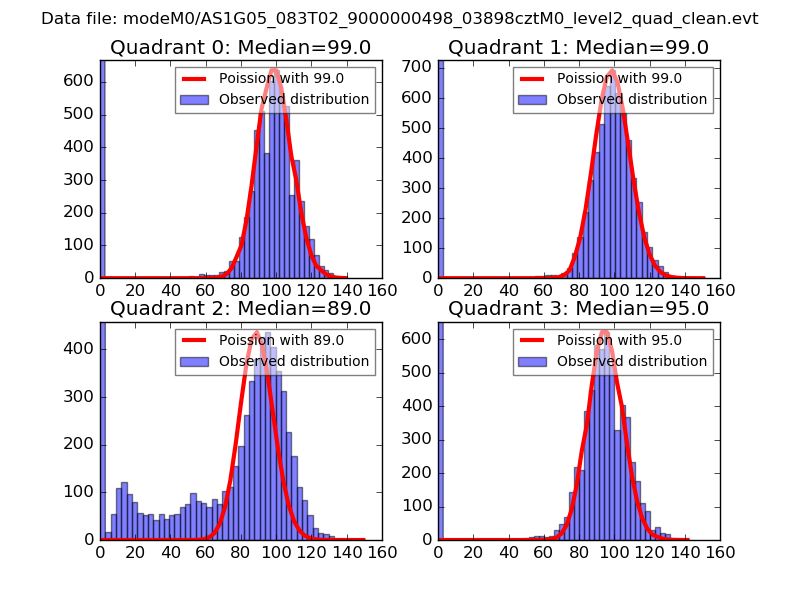 |
 |
| Quadrant-wise count rates Data is divided into 100 sec bins |
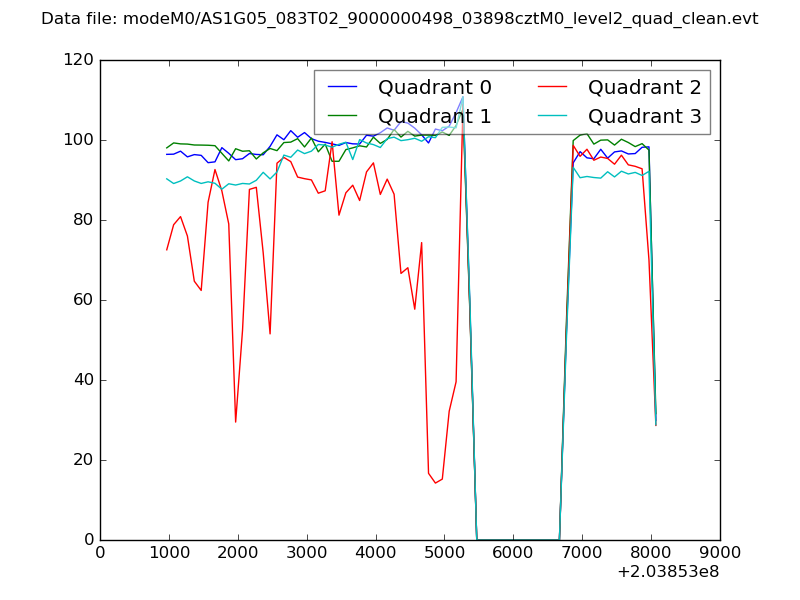 |
|
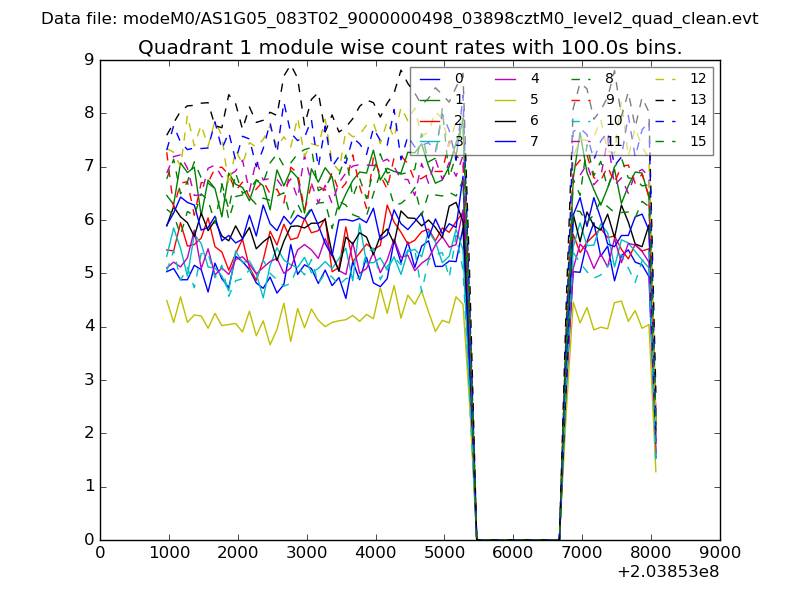
| Module-wise count rates for Quadrant A Data is divided into 100 sec bins |
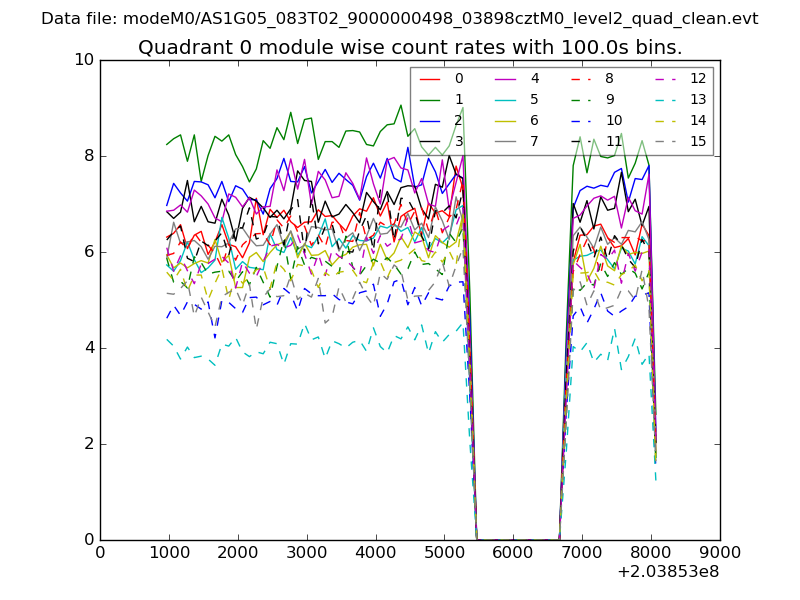 |
 |
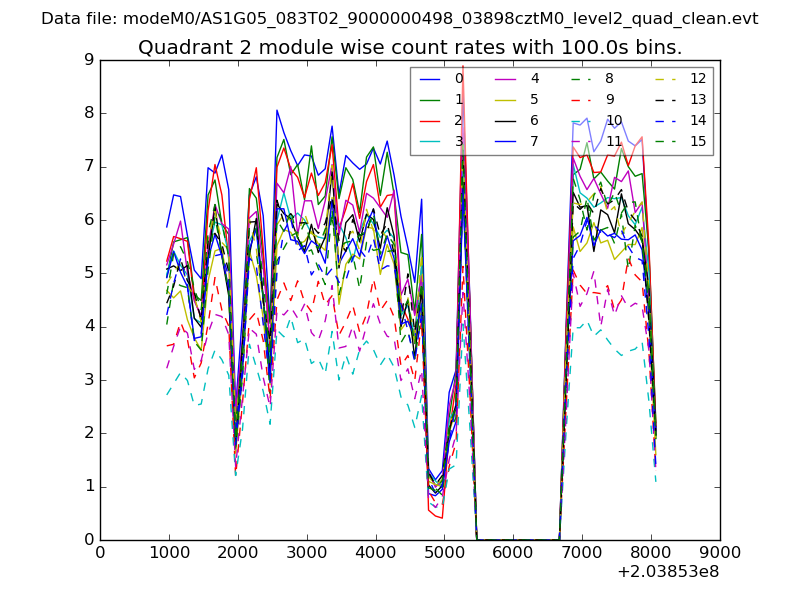
| Module-wise count rates for Quadrant B Data is divided into 100 sec bins |
 |
 |
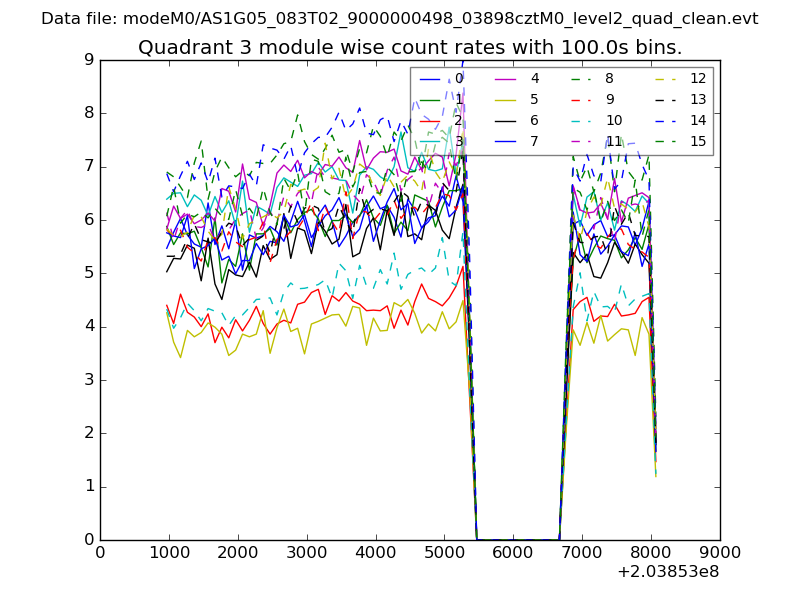
| Module-wise count rates for Quadrant C Data is divided into 100 sec bins |
 |
 |
| Module-wise count rates for Quadrant D Data is divided into 100 sec bins |
 |
 |
| Parameter | Plot |
|---|---|
| CZT HV Monitor | 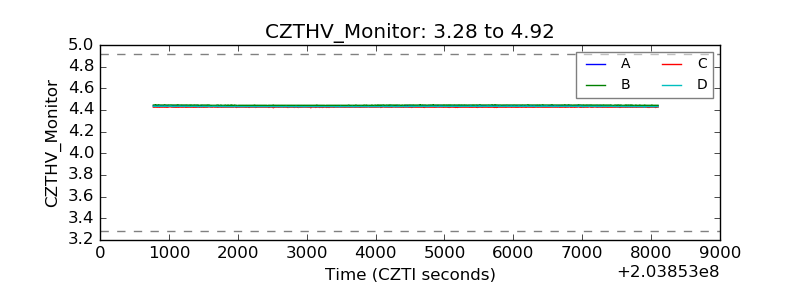 |
| D_VDD | 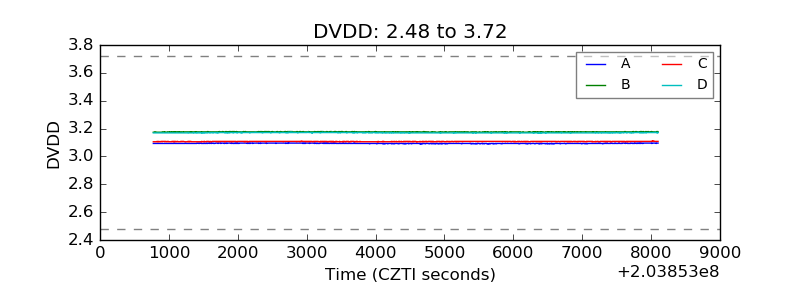 |
| Temperature 1 | 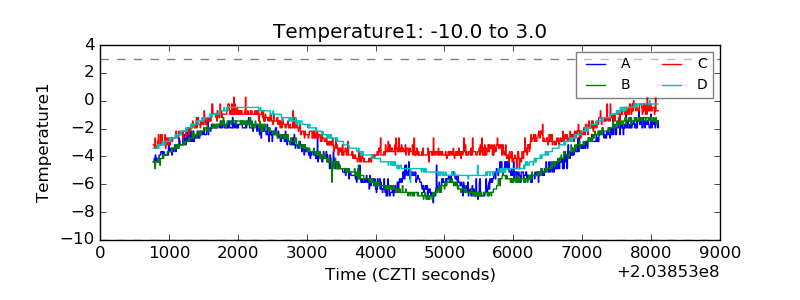 |
| Veto HV Monitor | 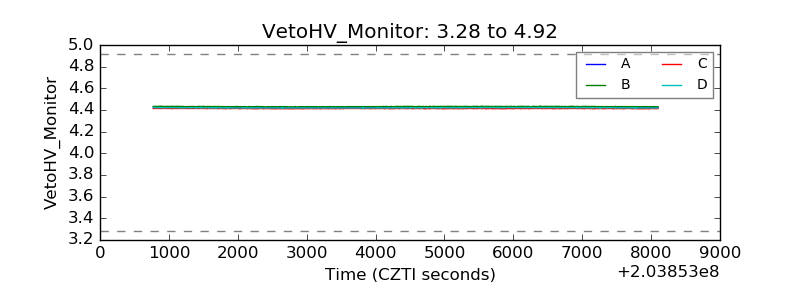 |
| Veto LLD | 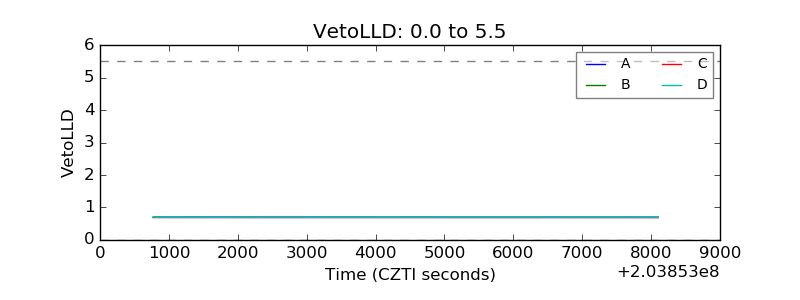 |
| Alpha Counter | 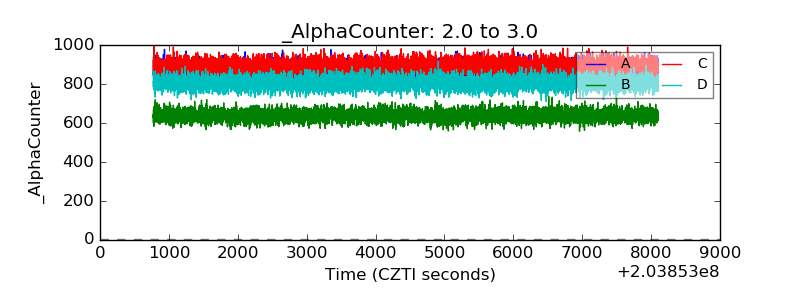 |
| _CPM_Rate | 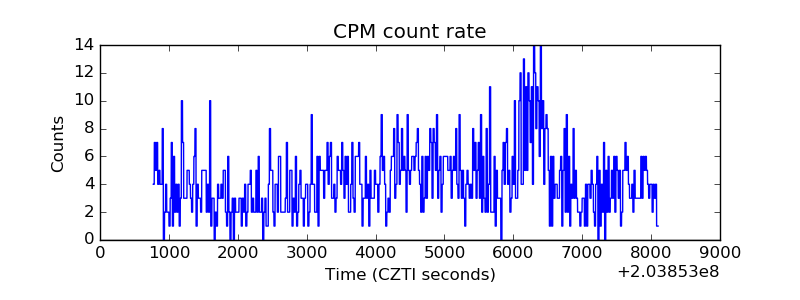 |
| CZT Counter | 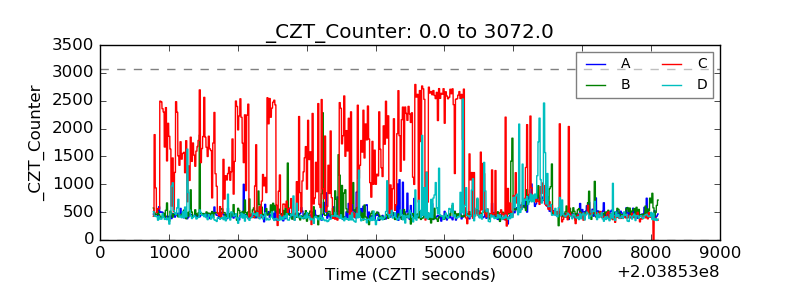 |
| +2.5 Volts monitor |  |
| +5 Volts monitor | 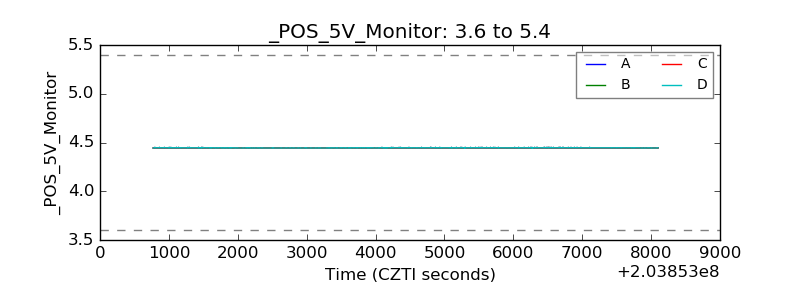 |
| Veto Counter | 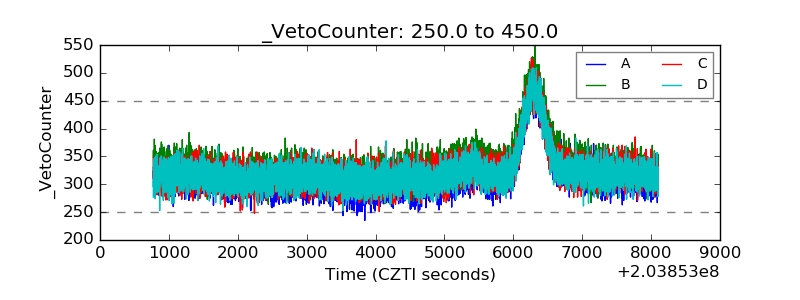 |